
|
|||||
|
 | |
| |
| |
| |
| |
| |
|
Gene: UQCRH |
Gene summary for UQCRH |
| Gene information | Species | Human | Gene symbol | UQCRH | Gene ID | 7388 |
| Gene name | ubiquinol-cytochrome c reductase hinge protein | |
| Gene Alias | QCR6 | |
| Cytomap | 1p33 | |
| Gene Type | protein-coding | GO ID | GO:0006091 | UniProtAcc | Q567R0 |
Top |
Malignant transformation analysis |
| Identification of the aberrant gene expression in precancerous and cancerous lesions by comparing the gene expression of stem-like cells in diseased tissues with normal stem cells |
| Entrez ID | Symbol | Replicates | Species | Organ | Tissue | Adj P-value | Log2FC | Malignancy |
| 7388 | UQCRH | sample3 | Human | Cervix | CC | 1.80e-05 | 8.17e-05 | 0.1387 |
| 7388 | UQCRH | H2 | Human | Cervix | HSIL_HPV | 3.31e-12 | -3.99e-01 | 0.0632 |
| 7388 | UQCRH | L1 | Human | Cervix | CC | 1.99e-06 | -1.88e-01 | 0.0802 |
| 7388 | UQCRH | T1 | Human | Cervix | CC | 1.22e-02 | -3.66e-01 | 0.0918 |
| 7388 | UQCRH | T3 | Human | Cervix | CC | 1.67e-04 | -1.14e-02 | 0.1389 |
| 7388 | UQCRH | HTA11_3410_2000001011 | Human | Colorectum | AD | 3.47e-52 | 1.28e+00 | 0.0155 |
| 7388 | UQCRH | HTA11_2487_2000001011 | Human | Colorectum | SER | 9.38e-32 | 1.30e+00 | -0.1808 |
| 7388 | UQCRH | HTA11_2951_2000001011 | Human | Colorectum | AD | 6.53e-16 | 1.34e+00 | 0.0216 |
| 7388 | UQCRH | HTA11_1938_2000001011 | Human | Colorectum | AD | 2.65e-33 | 1.65e+00 | -0.0811 |
| 7388 | UQCRH | HTA11_78_2000001011 | Human | Colorectum | AD | 2.78e-14 | 7.87e-01 | -0.1088 |
| 7388 | UQCRH | HTA11_347_2000001011 | Human | Colorectum | AD | 1.04e-56 | 1.57e+00 | -0.1954 |
| 7388 | UQCRH | HTA11_411_2000001011 | Human | Colorectum | SER | 8.62e-14 | 1.60e+00 | -0.2602 |
| 7388 | UQCRH | HTA11_2112_2000001011 | Human | Colorectum | SER | 4.45e-06 | 1.31e+00 | -0.2196 |
| 7388 | UQCRH | HTA11_3361_2000001011 | Human | Colorectum | AD | 2.10e-21 | 1.34e+00 | -0.1207 |
| 7388 | UQCRH | HTA11_83_2000001011 | Human | Colorectum | SER | 1.33e-34 | 2.00e+00 | -0.1526 |
| 7388 | UQCRH | HTA11_696_2000001011 | Human | Colorectum | AD | 8.37e-49 | 1.46e+00 | -0.1464 |
| 7388 | UQCRH | HTA11_866_2000001011 | Human | Colorectum | AD | 1.16e-26 | 1.15e+00 | -0.1001 |
| 7388 | UQCRH | HTA11_1391_2000001011 | Human | Colorectum | AD | 2.41e-53 | 2.16e+00 | -0.059 |
| 7388 | UQCRH | HTA11_2992_2000001011 | Human | Colorectum | SER | 2.09e-17 | 1.49e+00 | -0.1706 |
| 7388 | UQCRH | HTA11_5212_2000001011 | Human | Colorectum | AD | 1.54e-20 | 1.57e+00 | -0.2061 |
| Page: 1 2 3 4 5 6 7 8 9 10 11 12 13 14 15 16 |
| Tissue | Expression Dynamics | Abbreviation |
| Breast | 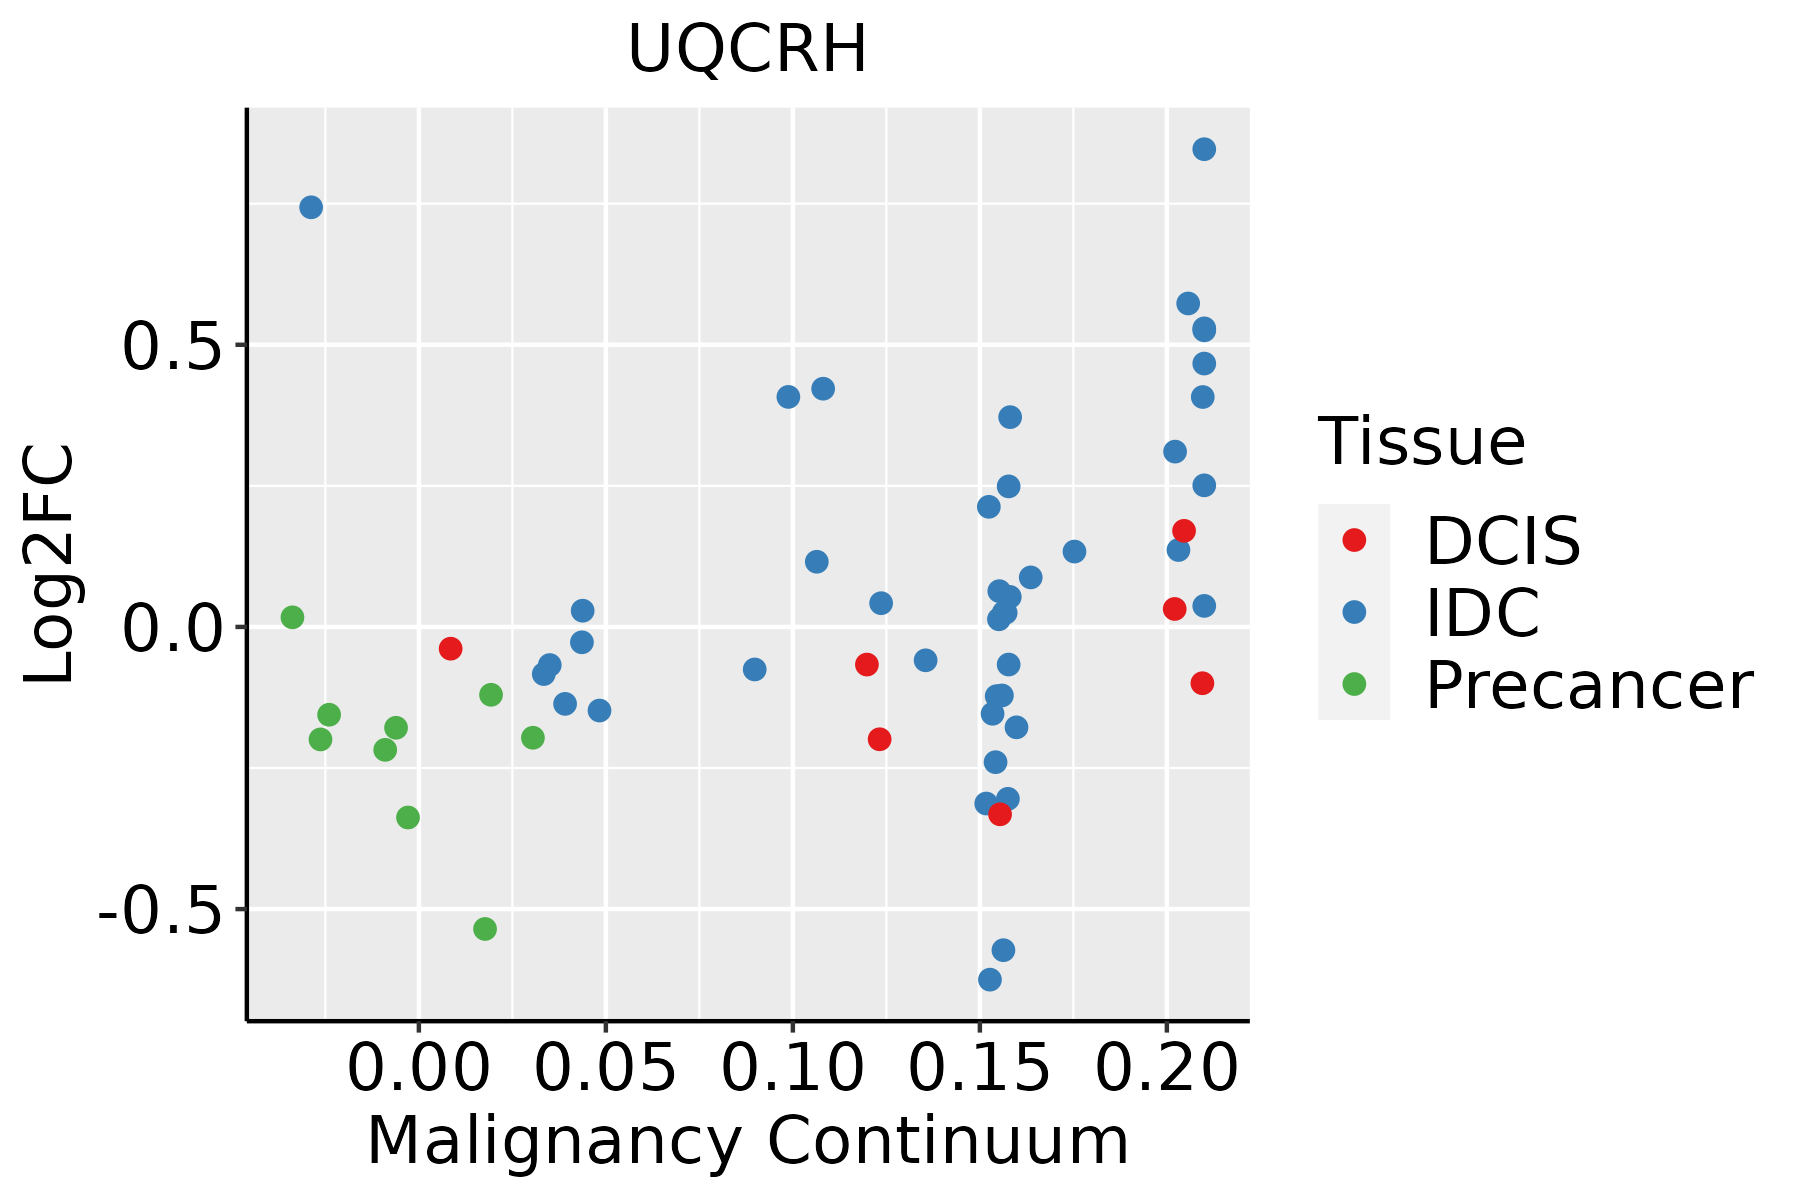 | IDC: Invasive ductal carcinoma |
| DCIS: Ductal carcinoma in situ | ||
| Precancer(BRCA1-mut): Precancerous lesion from BRCA1 mutation carriers | ||
| Cervix |  | CC: Cervix cancer |
| HSIL_HPV: HPV-infected high-grade squamous intraepithelial lesions | ||
| N_HPV: HPV-infected normal cervix | ||
| Colorectum (GSE201348) |  | FAP: Familial adenomatous polyposis |
| CRC: Colorectal cancer | ||
| Colorectum (HTA11) |  | AD: Adenomas |
| SER: Sessile serrated lesions | ||
| MSI-H: Microsatellite-high colorectal cancer | ||
| MSS: Microsatellite stable colorectal cancer | ||
| Endometrium | 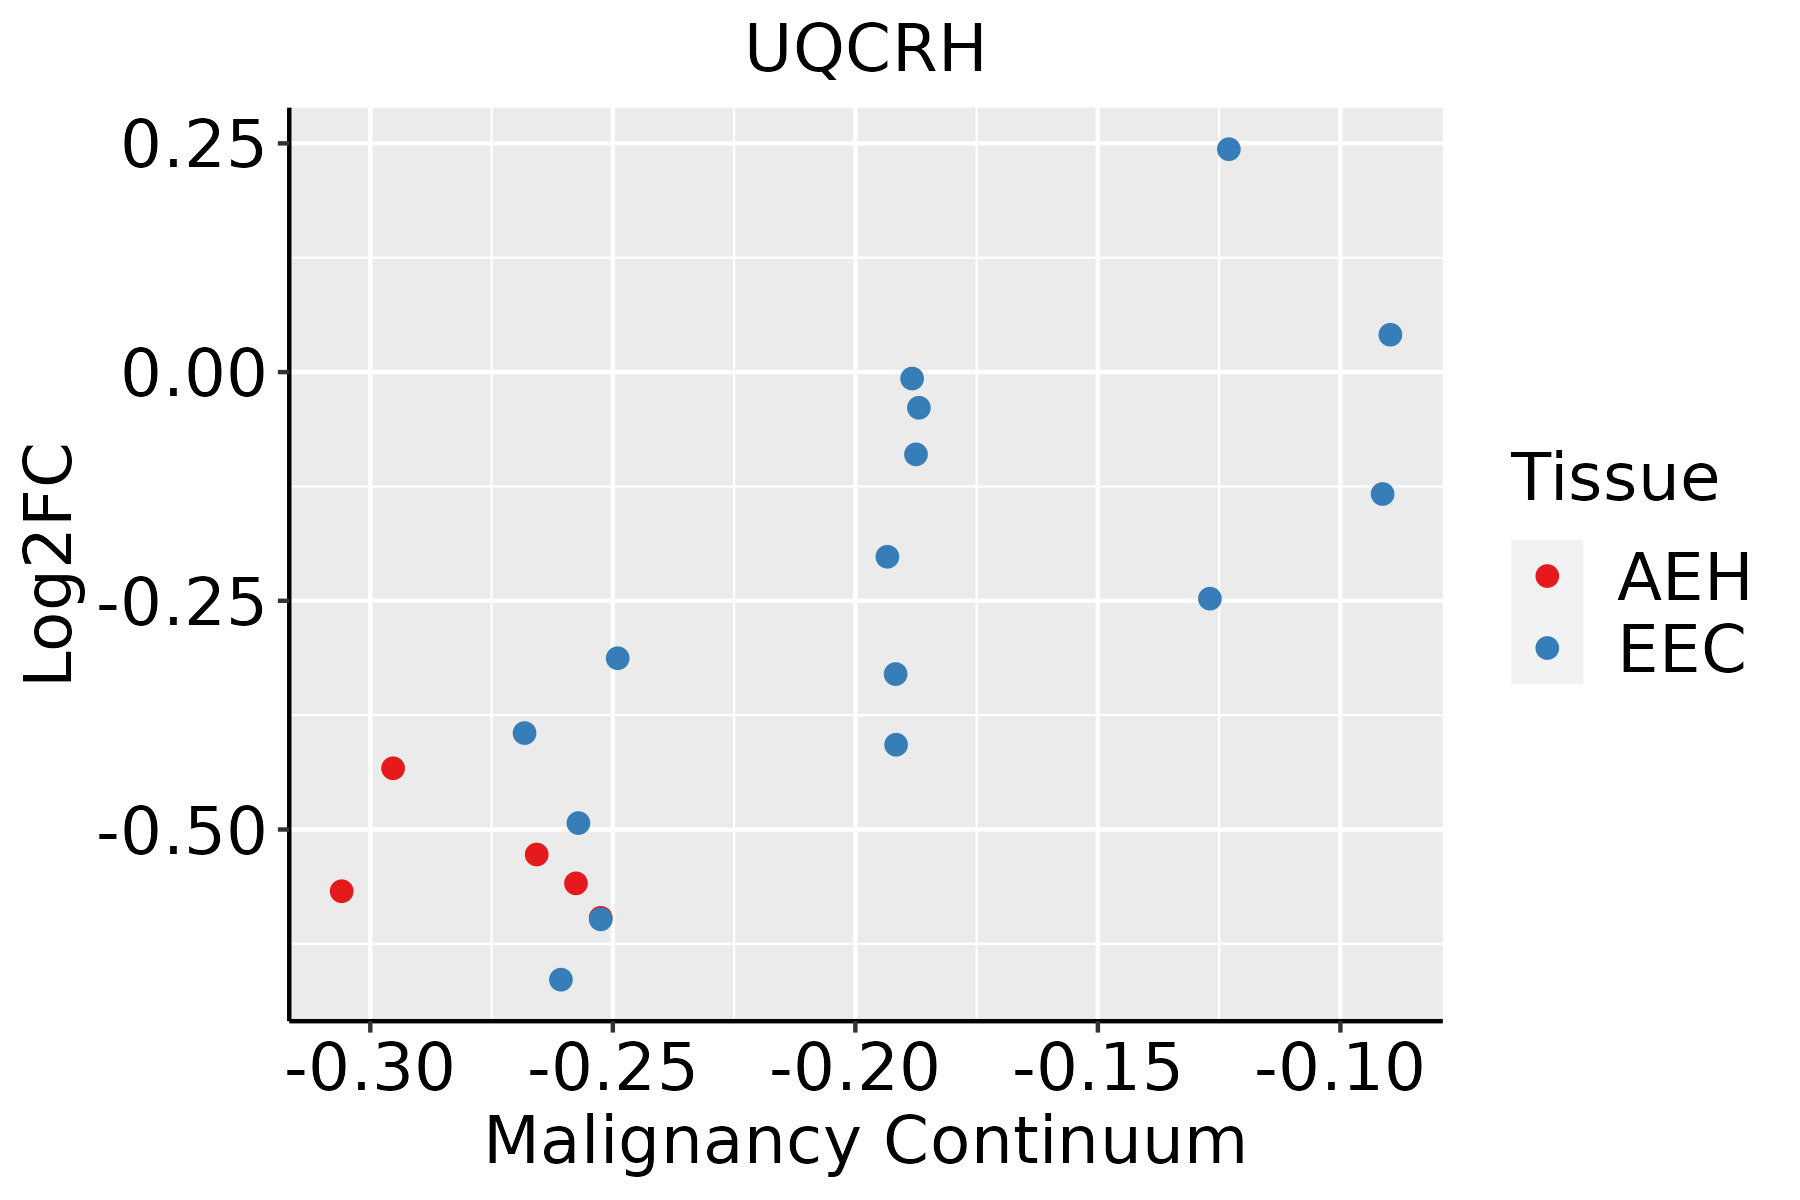 | AEH: Atypical endometrial hyperplasia |
| EEC: Endometrioid Cancer | ||
| Esophagus | 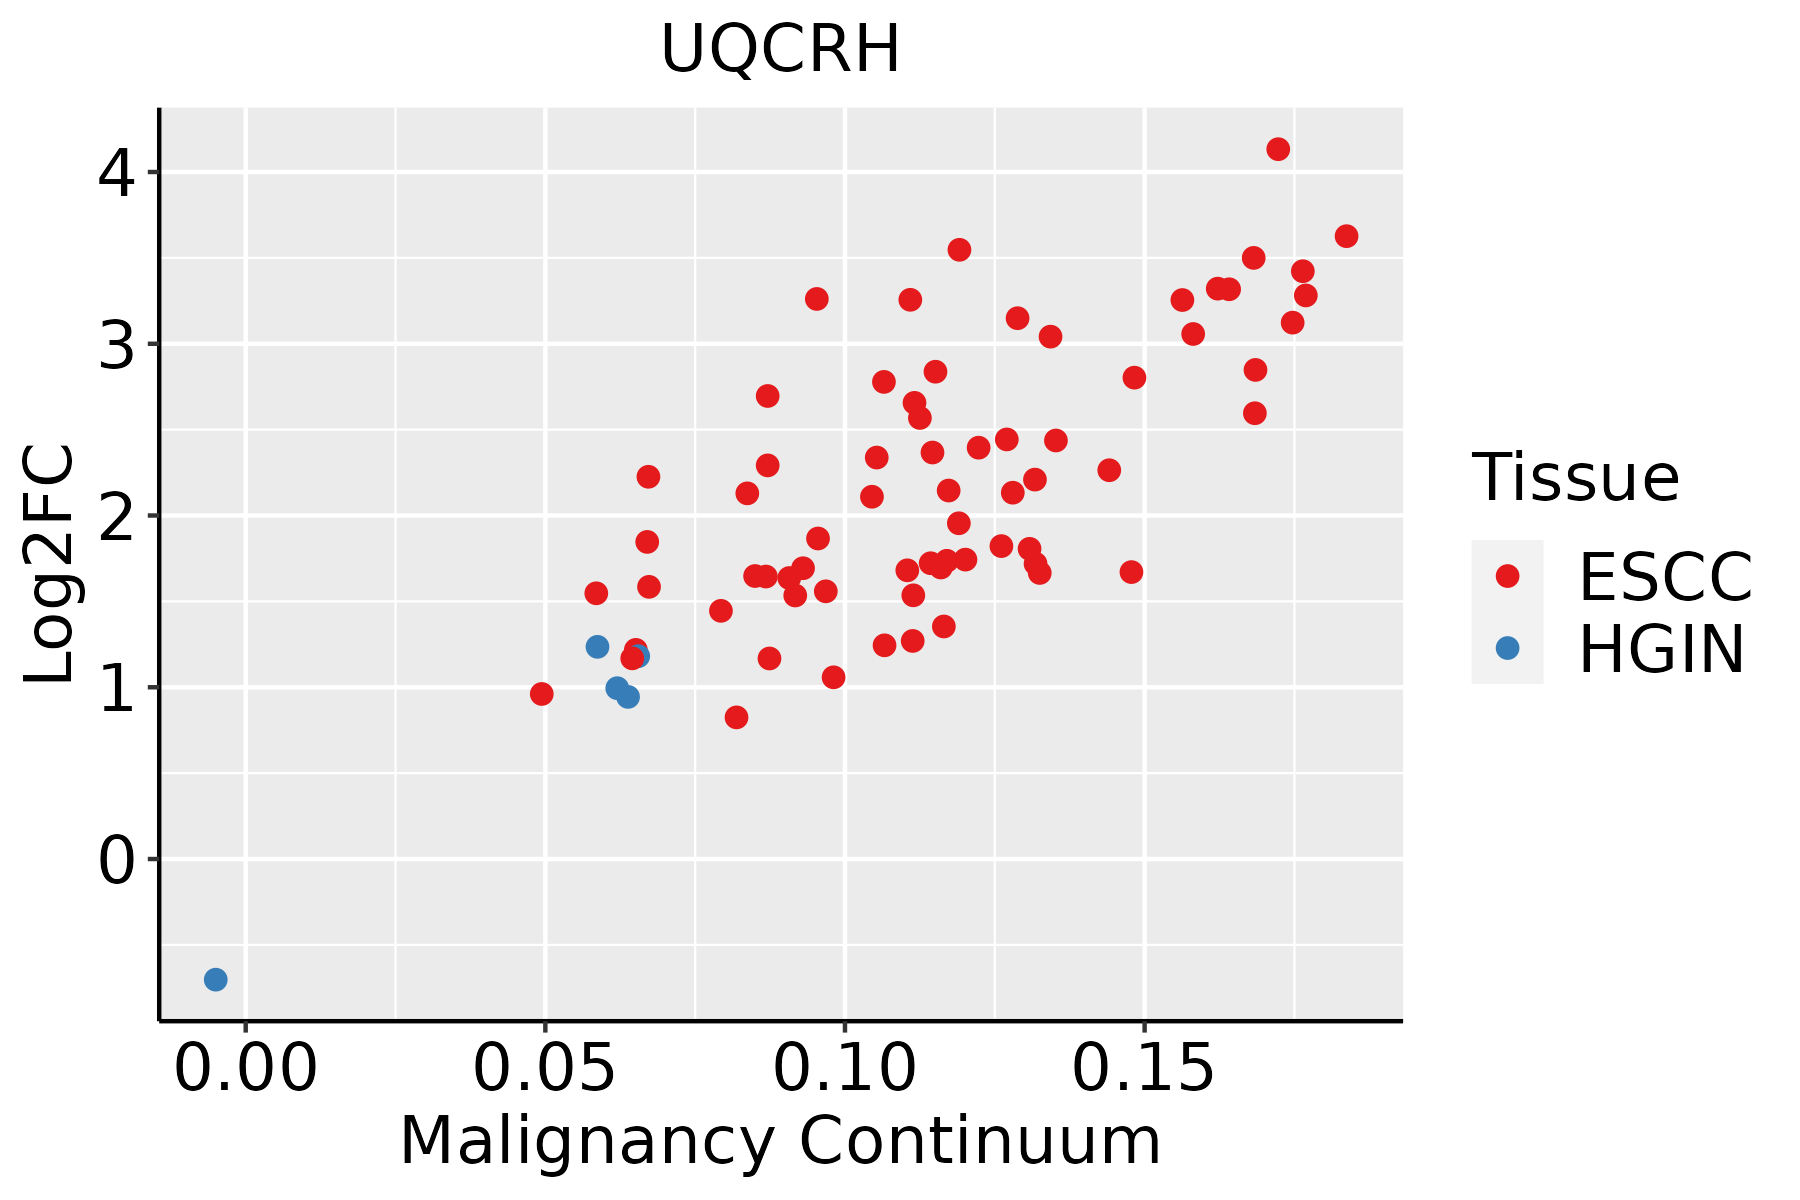 | ESCC: Esophageal squamous cell carcinoma |
| HGIN: High-grade intraepithelial neoplasias | ||
| LGIN: Low-grade intraepithelial neoplasias | ||
| Liver | 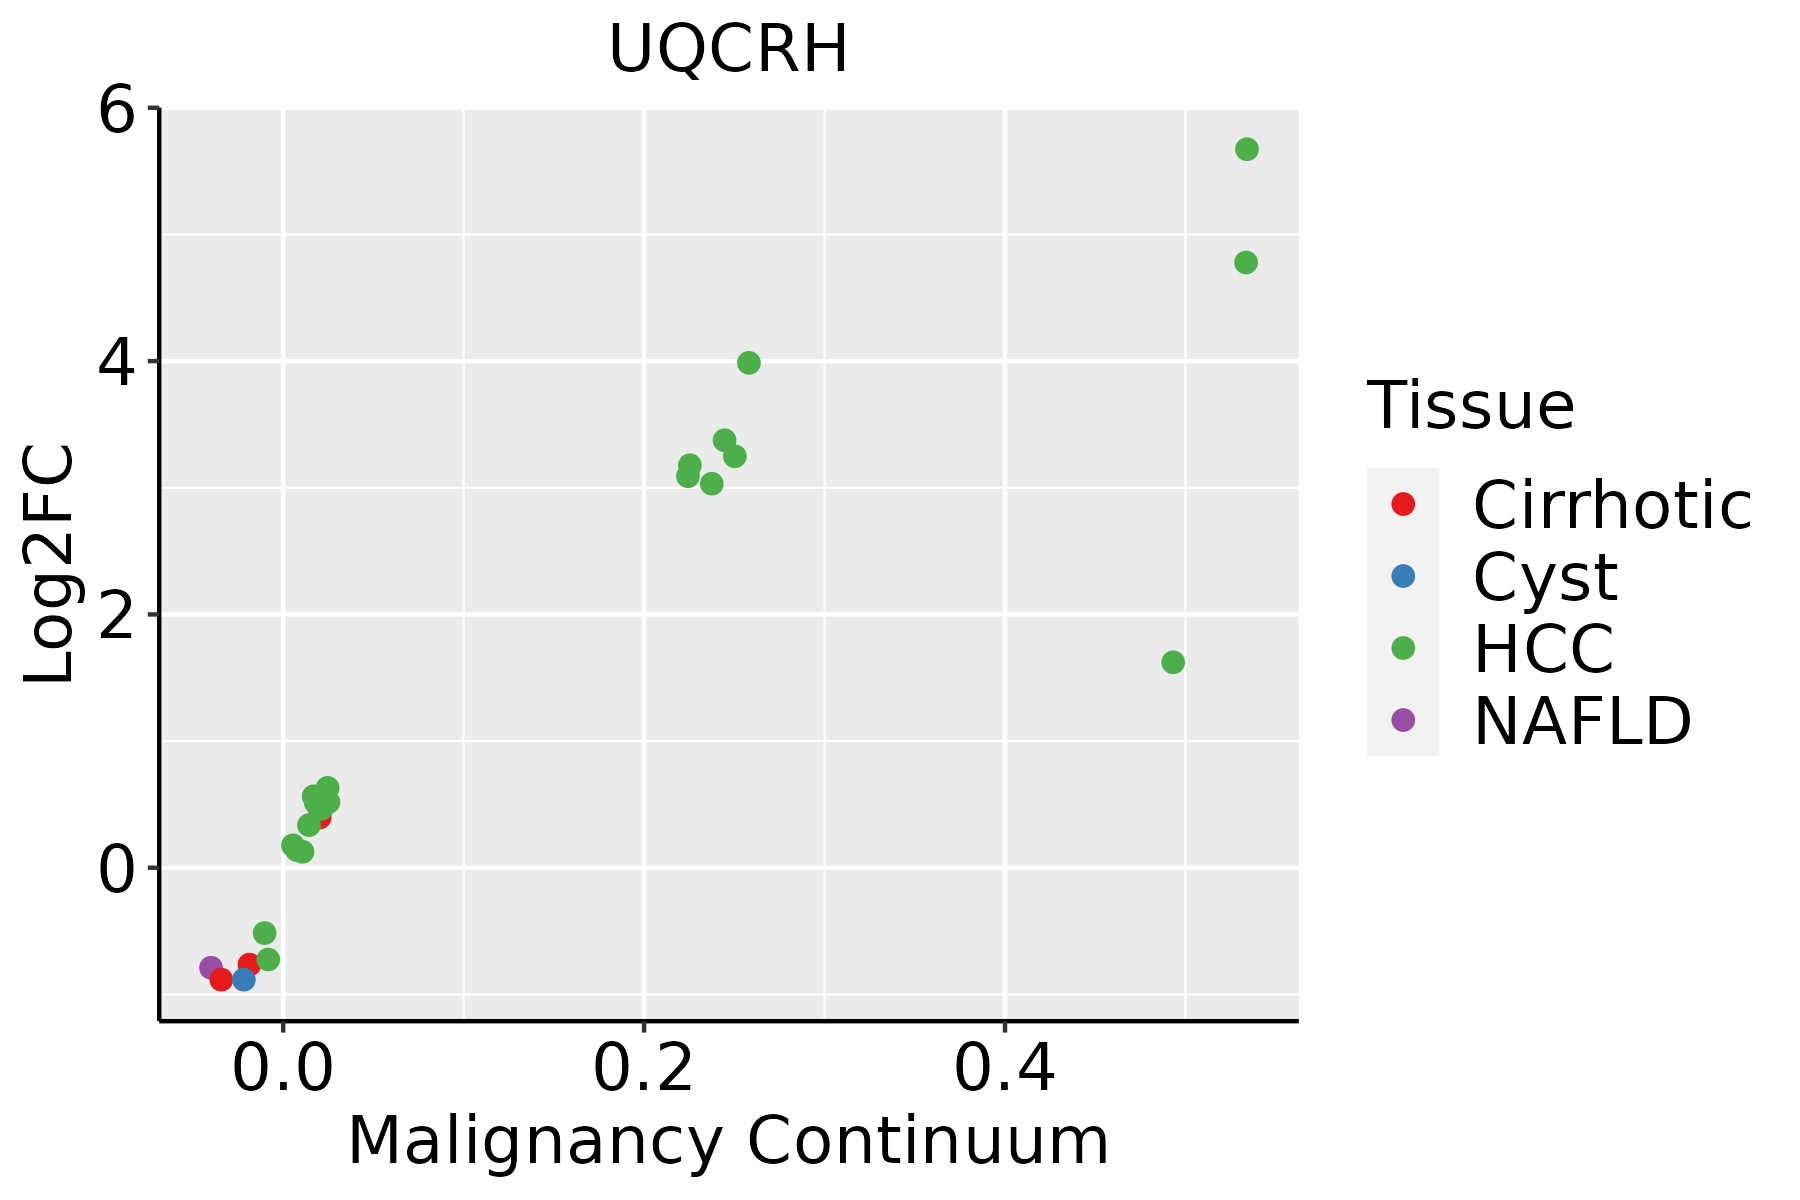 | HCC: Hepatocellular carcinoma |
| NAFLD: Non-alcoholic fatty liver disease | ||
| Oral Cavity |  | EOLP: Erosive Oral lichen planus |
| LP: leukoplakia | ||
| NEOLP: Non-erosive oral lichen planus | ||
| OSCC: Oral squamous cell carcinoma | ||
| Prostate | 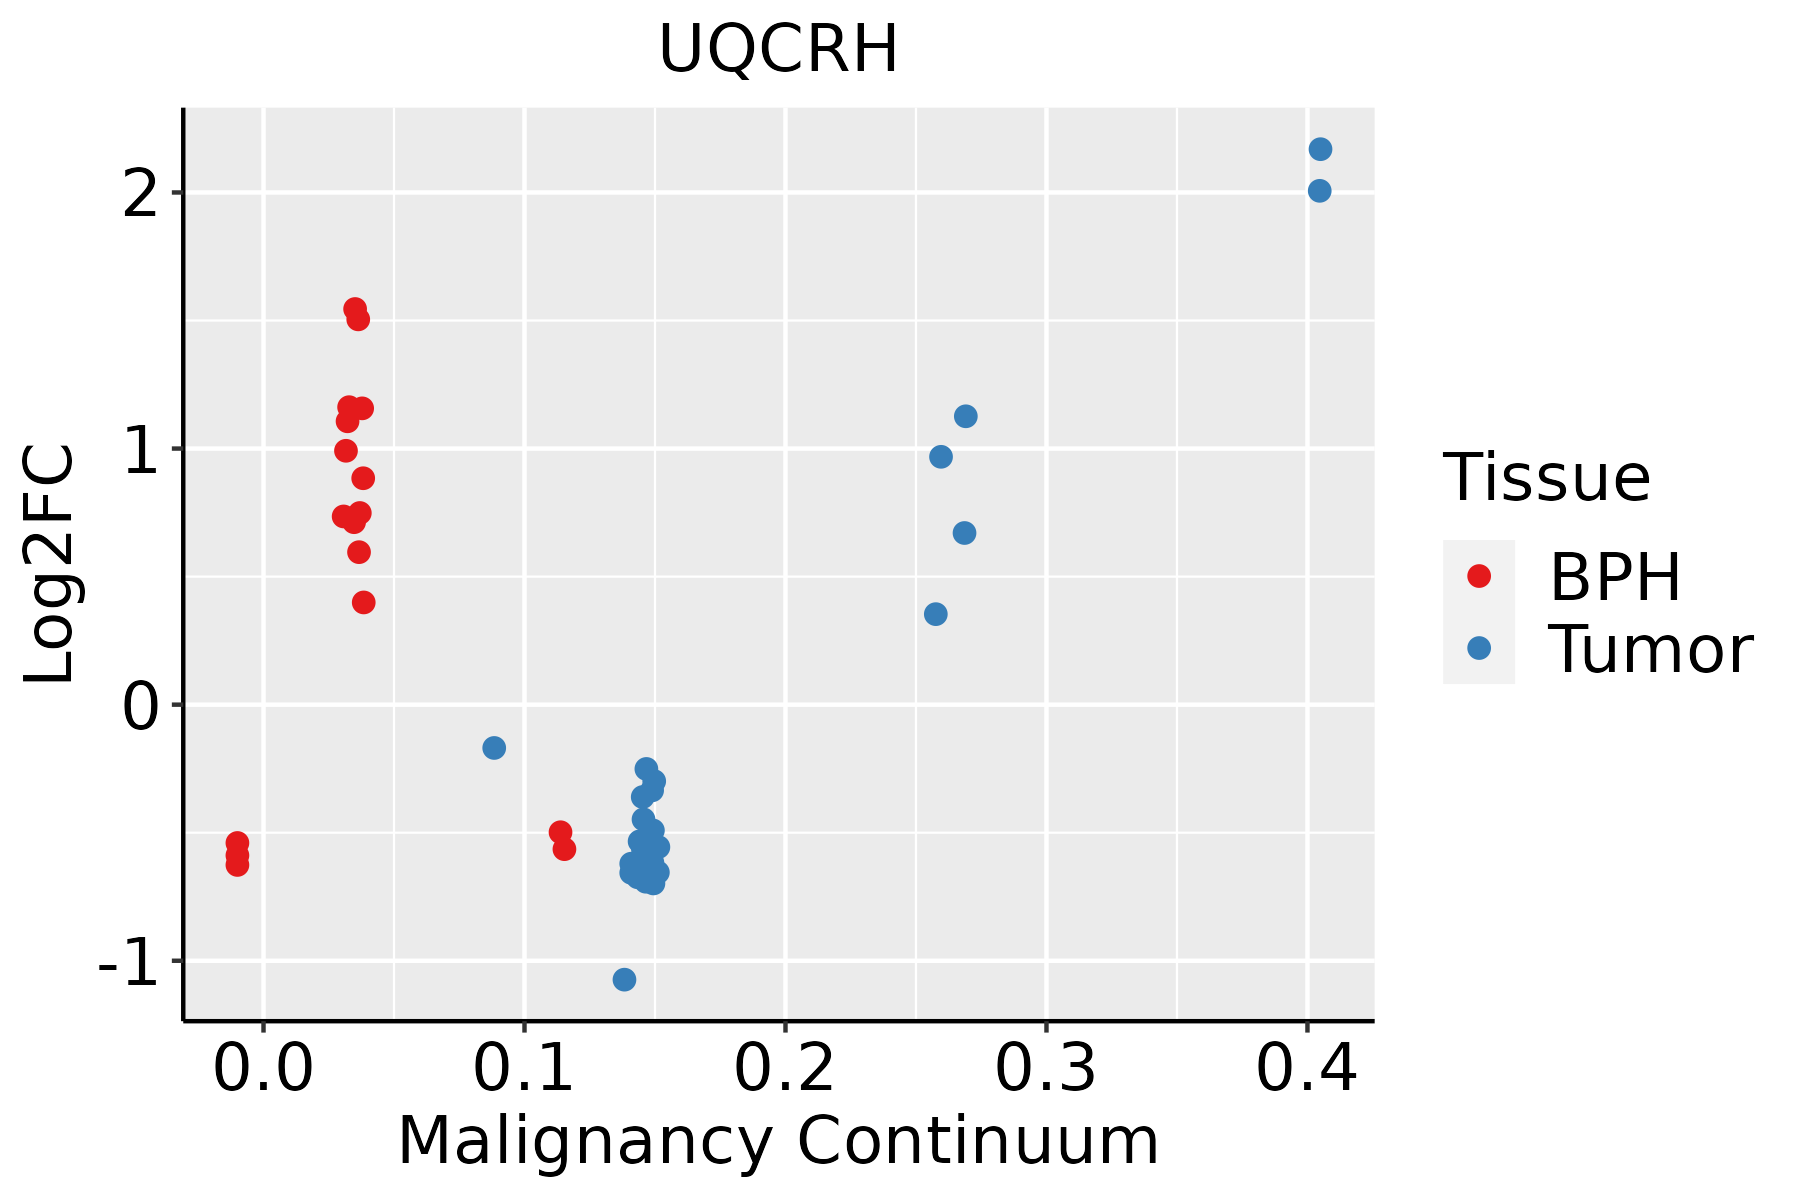 | BPH: Benign Prostatic Hyperplasia |
| Skin | 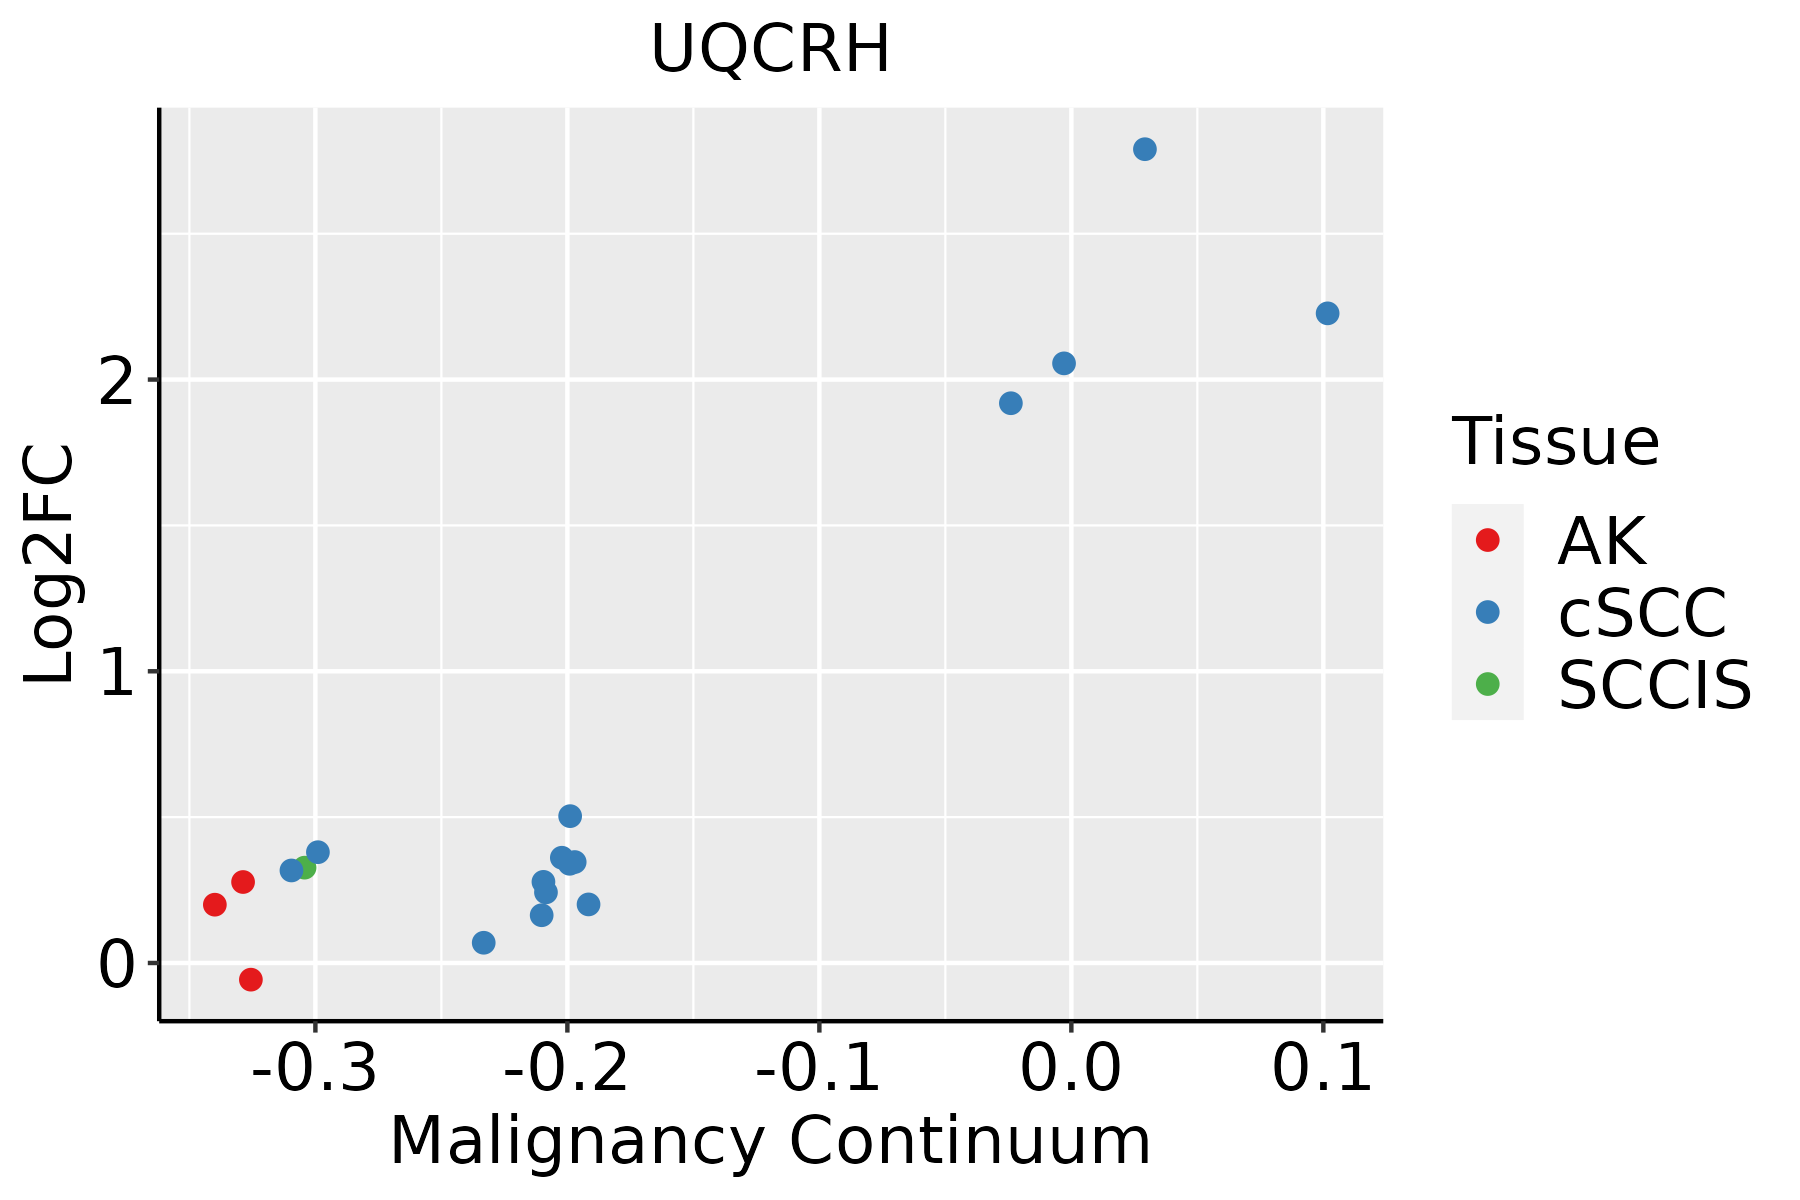 | AK: Actinic keratosis |
| cSCC: Cutaneous squamous cell carcinoma | ||
| SCCIS:squamous cell carcinoma in situ | ||
| Thyroid | 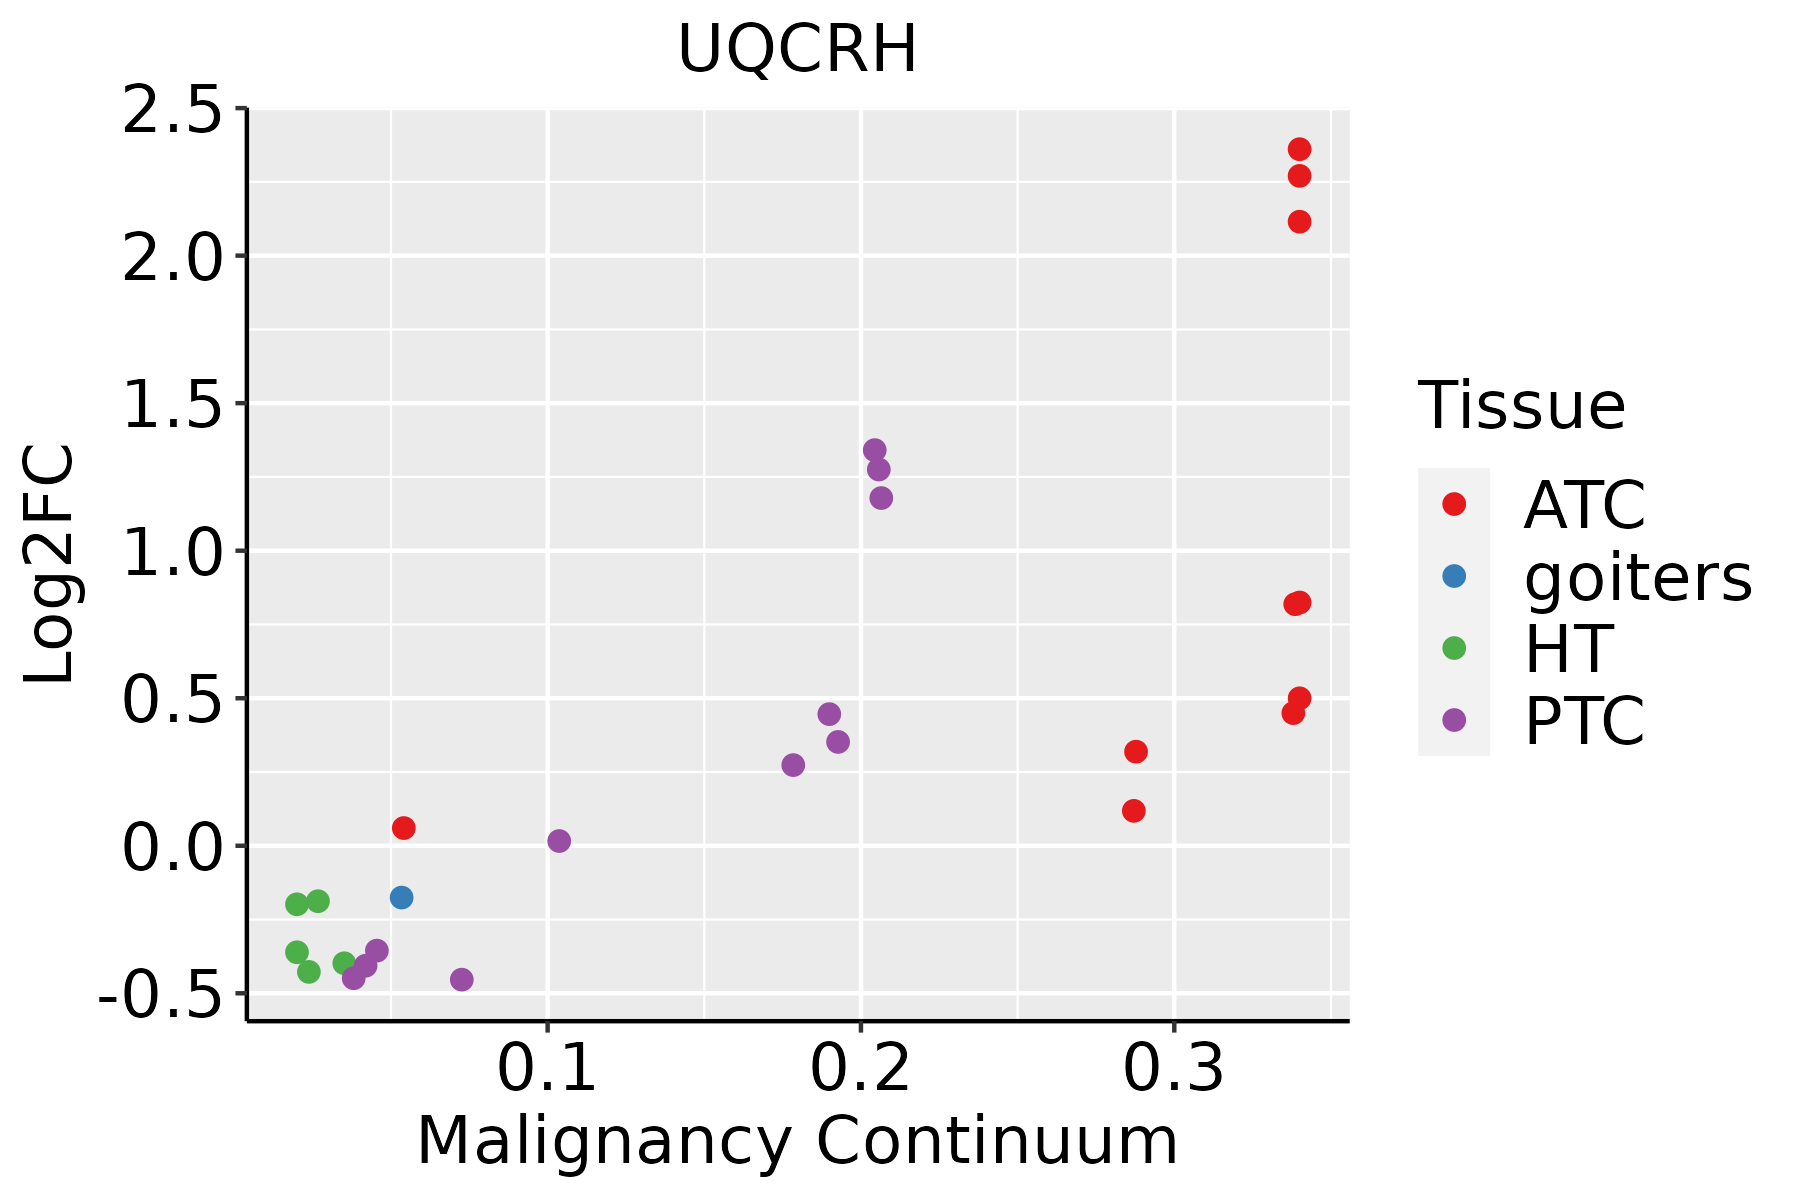 | ATC: Anaplastic thyroid cancer |
| HT: Hashimoto's thyroiditis | ||
| PTC: Papillary thyroid cancer |
| ∗log2FC in expression of this searched gene in stem-like cells from each diseased tissue sample relative to stem-like cells in normal samples in each tissue plotted against the malignancy continuum. Samples are colored based on if they are from different disease stage. |
Top |
Malignant transformation related pathway analysis |
| Find out the enriched GO biological processes and KEGG pathways involved in transition from healthy to precancer to cancer |
| Tissue | Disease Stage | Enriched GO biological Processes |
| Colorectum | AD |  |
| Colorectum | SER |  |
| Colorectum | MSS |  |
| Colorectum | MSI-H |  |
| Colorectum | FAP |  |
| ∗Top 15 enriched GO BP terms are showed in the bar plot of each disease state in each tissue. Each row represents a significant GO biological process which is colored according to the -log10(p.adjust). |
| Page: 1 2 3 4 5 6 7 8 9 |
| GO ID | Tissue | Disease Stage | Description | Gene Ratio | Bg Ratio | pvalue | p.adjust | Count |
| GO:00460349 | Breast | Precancer | ATP metabolic process | 82/1080 | 277/18723 | 1.94e-36 | 5.19e-33 | 82 |
| GO:00061199 | Breast | Precancer | oxidative phosphorylation | 53/1080 | 141/18723 | 1.15e-29 | 2.04e-26 | 53 |
| GO:00090608 | Breast | Precancer | aerobic respiration | 58/1080 | 189/18723 | 5.69e-27 | 7.62e-24 | 58 |
| GO:00060918 | Breast | Precancer | generation of precursor metabolites and energy | 94/1080 | 490/18723 | 1.54e-25 | 1.64e-22 | 94 |
| GO:00453338 | Breast | Precancer | cellular respiration | 59/1080 | 230/18723 | 5.97e-23 | 5.32e-20 | 59 |
| GO:00159808 | Breast | Precancer | energy derivation by oxidation of organic compounds | 70/1080 | 318/18723 | 8.33e-23 | 6.37e-20 | 70 |
| GO:00196468 | Breast | Precancer | aerobic electron transport chain | 34/1080 | 87/18723 | 3.95e-20 | 2.64e-17 | 34 |
| GO:00427738 | Breast | Precancer | ATP synthesis coupled electron transport | 35/1080 | 95/18723 | 1.08e-19 | 5.76e-17 | 35 |
| GO:00427758 | Breast | Precancer | mitochondrial ATP synthesis coupled electron transport | 35/1080 | 95/18723 | 1.08e-19 | 5.76e-17 | 35 |
| GO:00229048 | Breast | Precancer | respiratory electron transport chain | 35/1080 | 114/18723 | 8.51e-17 | 3.26e-14 | 35 |
| GO:00229008 | Breast | Precancer | electron transport chain | 42/1080 | 175/18723 | 1.37e-15 | 4.59e-13 | 42 |
| GO:19026008 | Breast | Precancer | proton transmembrane transport | 39/1080 | 157/18723 | 4.18e-15 | 1.18e-12 | 39 |
| GO:00061228 | Breast | Precancer | mitochondrial electron transport, ubiquinol to cytochrome c | 7/1080 | 11/18723 | 5.61e-07 | 2.46e-05 | 7 |
| GO:004603414 | Breast | IDC | ATP metabolic process | 85/1434 | 277/18723 | 6.42e-30 | 1.82e-26 | 85 |
| GO:000611913 | Breast | IDC | oxidative phosphorylation | 56/1434 | 141/18723 | 1.87e-26 | 3.53e-23 | 56 |
| GO:000906013 | Breast | IDC | aerobic respiration | 61/1434 | 189/18723 | 4.42e-23 | 6.27e-20 | 61 |
| GO:000609113 | Breast | IDC | generation of precursor metabolites and energy | 103/1434 | 490/18723 | 1.53e-21 | 1.74e-18 | 103 |
| GO:004533313 | Breast | IDC | cellular respiration | 62/1434 | 230/18723 | 5.98e-19 | 4.25e-16 | 62 |
| GO:004277313 | Breast | IDC | ATP synthesis coupled electron transport | 38/1434 | 95/18723 | 1.65e-18 | 9.36e-16 | 38 |
| GO:004277513 | Breast | IDC | mitochondrial ATP synthesis coupled electron transport | 38/1434 | 95/18723 | 1.65e-18 | 9.36e-16 | 38 |
| Page: 1 2 3 4 5 6 7 8 9 10 11 12 13 14 15 16 17 18 |
| Pathway ID | Tissue | Disease Stage | Description | Gene Ratio | Bg Ratio | pvalue | p.adjust | qvalue | Count |
| hsa0501218 | Breast | Precancer | Parkinson disease | 99/684 | 266/8465 | 3.58e-42 | 5.65e-40 | 4.33e-40 | 99 |
| hsa0502016 | Breast | Precancer | Prion disease | 95/684 | 273/8465 | 1.39e-37 | 1.46e-35 | 1.12e-35 | 95 |
| hsa0501616 | Breast | Precancer | Huntington disease | 98/684 | 306/8465 | 2.85e-35 | 2.25e-33 | 1.72e-33 | 98 |
| hsa0019016 | Breast | Precancer | Oxidative phosphorylation | 59/684 | 134/8465 | 6.15e-30 | 3.24e-28 | 2.48e-28 | 59 |
| hsa0501016 | Breast | Precancer | Alzheimer disease | 103/684 | 384/8465 | 1.03e-29 | 4.66e-28 | 3.57e-28 | 103 |
| hsa0501416 | Breast | Precancer | Amyotrophic lateral sclerosis | 98/684 | 364/8465 | 2.13e-28 | 8.41e-27 | 6.44e-27 | 98 |
| hsa0502216 | Breast | Precancer | Pathways of neurodegeneration - multiple diseases | 112/684 | 476/8465 | 6.96e-27 | 2.44e-25 | 1.87e-25 | 112 |
| hsa0520818 | Breast | Precancer | Chemical carcinogenesis - reactive oxygen species | 68/684 | 223/8465 | 3.61e-23 | 1.14e-21 | 8.73e-22 | 68 |
| hsa0471418 | Breast | Precancer | Thermogenesis | 68/684 | 232/8465 | 4.40e-22 | 1.26e-20 | 9.69e-21 | 68 |
| hsa0541518 | Breast | Precancer | Diabetic cardiomyopathy | 63/684 | 203/8465 | 5.63e-22 | 1.48e-20 | 1.14e-20 | 63 |
| hsa0493216 | Breast | Precancer | Non-alcoholic fatty liver disease | 48/684 | 155/8465 | 6.16e-17 | 1.50e-15 | 1.15e-15 | 48 |
| hsa0426016 | Breast | Precancer | Cardiac muscle contraction | 22/684 | 87/8465 | 9.72e-07 | 1.62e-05 | 1.24e-05 | 22 |
| hsa0501219 | Breast | Precancer | Parkinson disease | 99/684 | 266/8465 | 3.58e-42 | 5.65e-40 | 4.33e-40 | 99 |
| hsa0502017 | Breast | Precancer | Prion disease | 95/684 | 273/8465 | 1.39e-37 | 1.46e-35 | 1.12e-35 | 95 |
| hsa0501617 | Breast | Precancer | Huntington disease | 98/684 | 306/8465 | 2.85e-35 | 2.25e-33 | 1.72e-33 | 98 |
| hsa0019017 | Breast | Precancer | Oxidative phosphorylation | 59/684 | 134/8465 | 6.15e-30 | 3.24e-28 | 2.48e-28 | 59 |
| hsa0501017 | Breast | Precancer | Alzheimer disease | 103/684 | 384/8465 | 1.03e-29 | 4.66e-28 | 3.57e-28 | 103 |
| hsa0501417 | Breast | Precancer | Amyotrophic lateral sclerosis | 98/684 | 364/8465 | 2.13e-28 | 8.41e-27 | 6.44e-27 | 98 |
| hsa0502217 | Breast | Precancer | Pathways of neurodegeneration - multiple diseases | 112/684 | 476/8465 | 6.96e-27 | 2.44e-25 | 1.87e-25 | 112 |
| hsa0520819 | Breast | Precancer | Chemical carcinogenesis - reactive oxygen species | 68/684 | 223/8465 | 3.61e-23 | 1.14e-21 | 8.73e-22 | 68 |
| Page: 1 2 3 4 5 6 7 8 9 10 11 12 13 14 15 16 17 18 19 20 21 22 23 24 25 26 27 28 |
Top |
Cell-cell communication analysis |
| Identification of potential cell-cell interactions between two cell types and their ligand-receptor pairs for different disease states |
| Ligand | Receptor | LRpair | Pathway | Tissue | Disease Stage |
| Page: 1 |
Top |
Single-cell gene regulatory network inference analysis |
| Find out the significant the regulons (TFs) and the target genes of each regulon across cell types for different disease states |
| TF | Cell Type | Tissue | Disease Stage | Target Gene | RSS | Regulon Activity |
| ∗The dot plots of a searched regulon are shown for all cell subpopulations in each disease state of each tissue based on the regulon specific score inferred using pySCENIC and by calculating the average expression. |
| Page: 1 |
Top |
Somatic mutation of malignant transformation related genes |
| Annotation of somatic variants for genes involved in malignant transformation |
| Hugo Symbol | Variant Class | Variant Classification | dbSNP RS | HGVSc | HGVSp | HGVSp Short | SWISSPROT | BIOTYPE | SIFT | PolyPhen | Tumor Sample Barcode | Tissue | Histology | Sex | Age | Stage | Therapy Types | Drugs | Outcome |
| UQCRH | SNV | Missense_Mutation | novel | c.266A>G | p.Asn89Ser | p.N89S | P07919 | protein_coding | tolerated(0.81) | benign(0.001) | TCGA-2W-A8YY-01 | Cervix | cervical & endocervical cancer | Female | <65 | I/II | Chemotherapy | cisplatin | CR |
| UQCRH | SNV | Missense_Mutation | novel | c.49N>A | p.Glu17Lys | p.E17K | P07919 | protein_coding | tolerated(1) | benign(0) | TCGA-C5-A8XK-01 | Cervix | cervical & endocervical cancer | Female | <65 | I/II | Chemotherapy | cisplatin | SD |
| UQCRH | SNV | Missense_Mutation | rs771218841 | c.203C>T | p.Thr68Met | p.T68M | P07919 | protein_coding | tolerated(0.13) | probably_damaging(0.999) | TCGA-AA-3994-01 | Colorectum | colon adenocarcinoma | Male | >=65 | III/IV | Chemotherapy | capecitabine | CR |
| UQCRH | SNV | Missense_Mutation | rs181971906 | c.230N>T | p.Ala77Val | p.A77V | P07919 | protein_coding | deleterious(0.01) | probably_damaging(0.991) | TCGA-EI-6917-01 | Colorectum | rectum adenocarcinoma | Male | <65 | III/IV | Chemotherapy | 5fluorouracil+oxaciplatina+l-folinian | SD |
| UQCRH | SNV | Missense_Mutation | c.72G>T | p.Glu24Asp | p.E24D | P07919 | protein_coding | tolerated(0.09) | benign(0.058) | TCGA-AP-A051-01 | Endometrium | uterine corpus endometrioid carcinoma | Female | >=65 | I/II | Unknown | Unknown | SD | |
| UQCRH | SNV | Missense_Mutation | novel | c.205N>A | p.Glu69Lys | p.E69K | P07919 | protein_coding | deleterious(0) | probably_damaging(0.969) | TCGA-AX-A06F-01 | Endometrium | uterine corpus endometrioid carcinoma | Female | <65 | III/IV | Chemotherapy | carboplatin | SD |
| UQCRH | SNV | Missense_Mutation | rs777050301 | c.145C>T | p.Arg49Trp | p.R49W | P07919 | protein_coding | deleterious(0.03) | benign(0.04) | TCGA-FI-A2D0-01 | Endometrium | uterine corpus endometrioid carcinoma | Female | <65 | I/II | Unknown | Unknown | SD |
| UQCRH | SNV | Missense_Mutation | novel | c.28N>A | p.Leu10Ile | p.L10I | P07919 | protein_coding | tolerated(0.28) | benign(0.003) | TCGA-49-AARO-01 | Lung | lung adenocarcinoma | Female | <65 | I/II | Unknown | Unknown | PD |
| UQCRH | SNV | Missense_Mutation | rs762474674 | c.146G>A | p.Arg49Gln | p.R49Q | P07919 | protein_coding | tolerated(0.11) | benign(0.042) | TCGA-55-A4DG-01 | Lung | lung adenocarcinoma | Male | >=65 | I/II | Unknown | Unknown | SD |
| Page: 1 |
Top |
Related drugs of malignant transformation related genes |
| Identification of chemicals and drugs interact with genes involved in malignant transfromation |
| (DGIdb 4.0) |
| Entrez ID | Symbol | Category | Interaction Types | Drug Claim Name | Drug Name | PMIDs |
| Page: 1 |

Copyright 2023-Present -The University of Texas Health Science Center at Houston |