
|
|||||
|
 | |
| |
| |
| |
| |
| |
|
Gene: UHRF1 |
Gene summary for UHRF1 |
| Gene information | Species | Human | Gene symbol | UHRF1 | Gene ID | 29128 |
| Gene name | ubiquitin like with PHD and ring finger domains 1 | |
| Gene Alias | ICBP90 | |
| Cytomap | 19p13.3 | |
| Gene Type | protein-coding | GO ID | GO:0000122 | UniProtAcc | Q96T88 |
Top |
Malignant transformation analysis |
| Identification of the aberrant gene expression in precancerous and cancerous lesions by comparing the gene expression of stem-like cells in diseased tissues with normal stem cells |
| Entrez ID | Symbol | Replicates | Species | Organ | Tissue | Adj P-value | Log2FC | Malignancy |
| 29128 | UHRF1 | P83T-E | Human | Esophagus | ESCC | 5.54e-12 | 4.25e-01 | 0.1738 |
| 29128 | UHRF1 | P89T-E | Human | Esophagus | ESCC | 5.33e-06 | 3.13e-01 | 0.1752 |
| 29128 | UHRF1 | P91T-E | Human | Esophagus | ESCC | 4.77e-11 | 1.35e+00 | 0.1828 |
| 29128 | UHRF1 | P104T-E | Human | Esophagus | ESCC | 2.70e-02 | 2.16e-01 | 0.0931 |
| 29128 | UHRF1 | P107T-E | Human | Esophagus | ESCC | 3.64e-18 | 5.49e-01 | 0.171 |
| 29128 | UHRF1 | P128T-E | Human | Esophagus | ESCC | 5.67e-04 | 1.83e-01 | 0.1241 |
| 29128 | UHRF1 | P130T-E | Human | Esophagus | ESCC | 5.17e-27 | 7.94e-01 | 0.1676 |
| 29128 | UHRF1 | C04 | Human | Oral cavity | OSCC | 2.63e-15 | 7.91e-01 | 0.2633 |
| 29128 | UHRF1 | C21 | Human | Oral cavity | OSCC | 1.81e-25 | 1.29e+00 | 0.2678 |
| 29128 | UHRF1 | C30 | Human | Oral cavity | OSCC | 5.89e-22 | 1.08e+00 | 0.3055 |
| 29128 | UHRF1 | C38 | Human | Oral cavity | OSCC | 8.34e-05 | 7.13e-01 | 0.172 |
| 29128 | UHRF1 | C43 | Human | Oral cavity | OSCC | 8.91e-18 | 2.96e-01 | 0.1704 |
| 29128 | UHRF1 | C46 | Human | Oral cavity | OSCC | 5.29e-13 | 3.66e-01 | 0.1673 |
| 29128 | UHRF1 | C51 | Human | Oral cavity | OSCC | 3.68e-08 | 5.44e-01 | 0.2674 |
| 29128 | UHRF1 | C57 | Human | Oral cavity | OSCC | 4.96e-04 | 2.77e-01 | 0.1679 |
| 29128 | UHRF1 | C08 | Human | Oral cavity | OSCC | 1.86e-04 | 1.65e-01 | 0.1919 |
| 29128 | UHRF1 | LN22 | Human | Oral cavity | OSCC | 3.91e-03 | 6.49e-01 | 0.1733 |
| 29128 | UHRF1 | LN46 | Human | Oral cavity | OSCC | 7.94e-05 | 2.06e-01 | 0.1666 |
| 29128 | UHRF1 | LP17 | Human | Oral cavity | LP | 2.26e-02 | 3.64e-01 | 0.2349 |
| 29128 | UHRF1 | SYSMH2 | Human | Oral cavity | OSCC | 9.07e-06 | 2.14e-01 | 0.2326 |
| Page: 1 2 3 4 |
| Tissue | Expression Dynamics | Abbreviation |
| Esophagus | 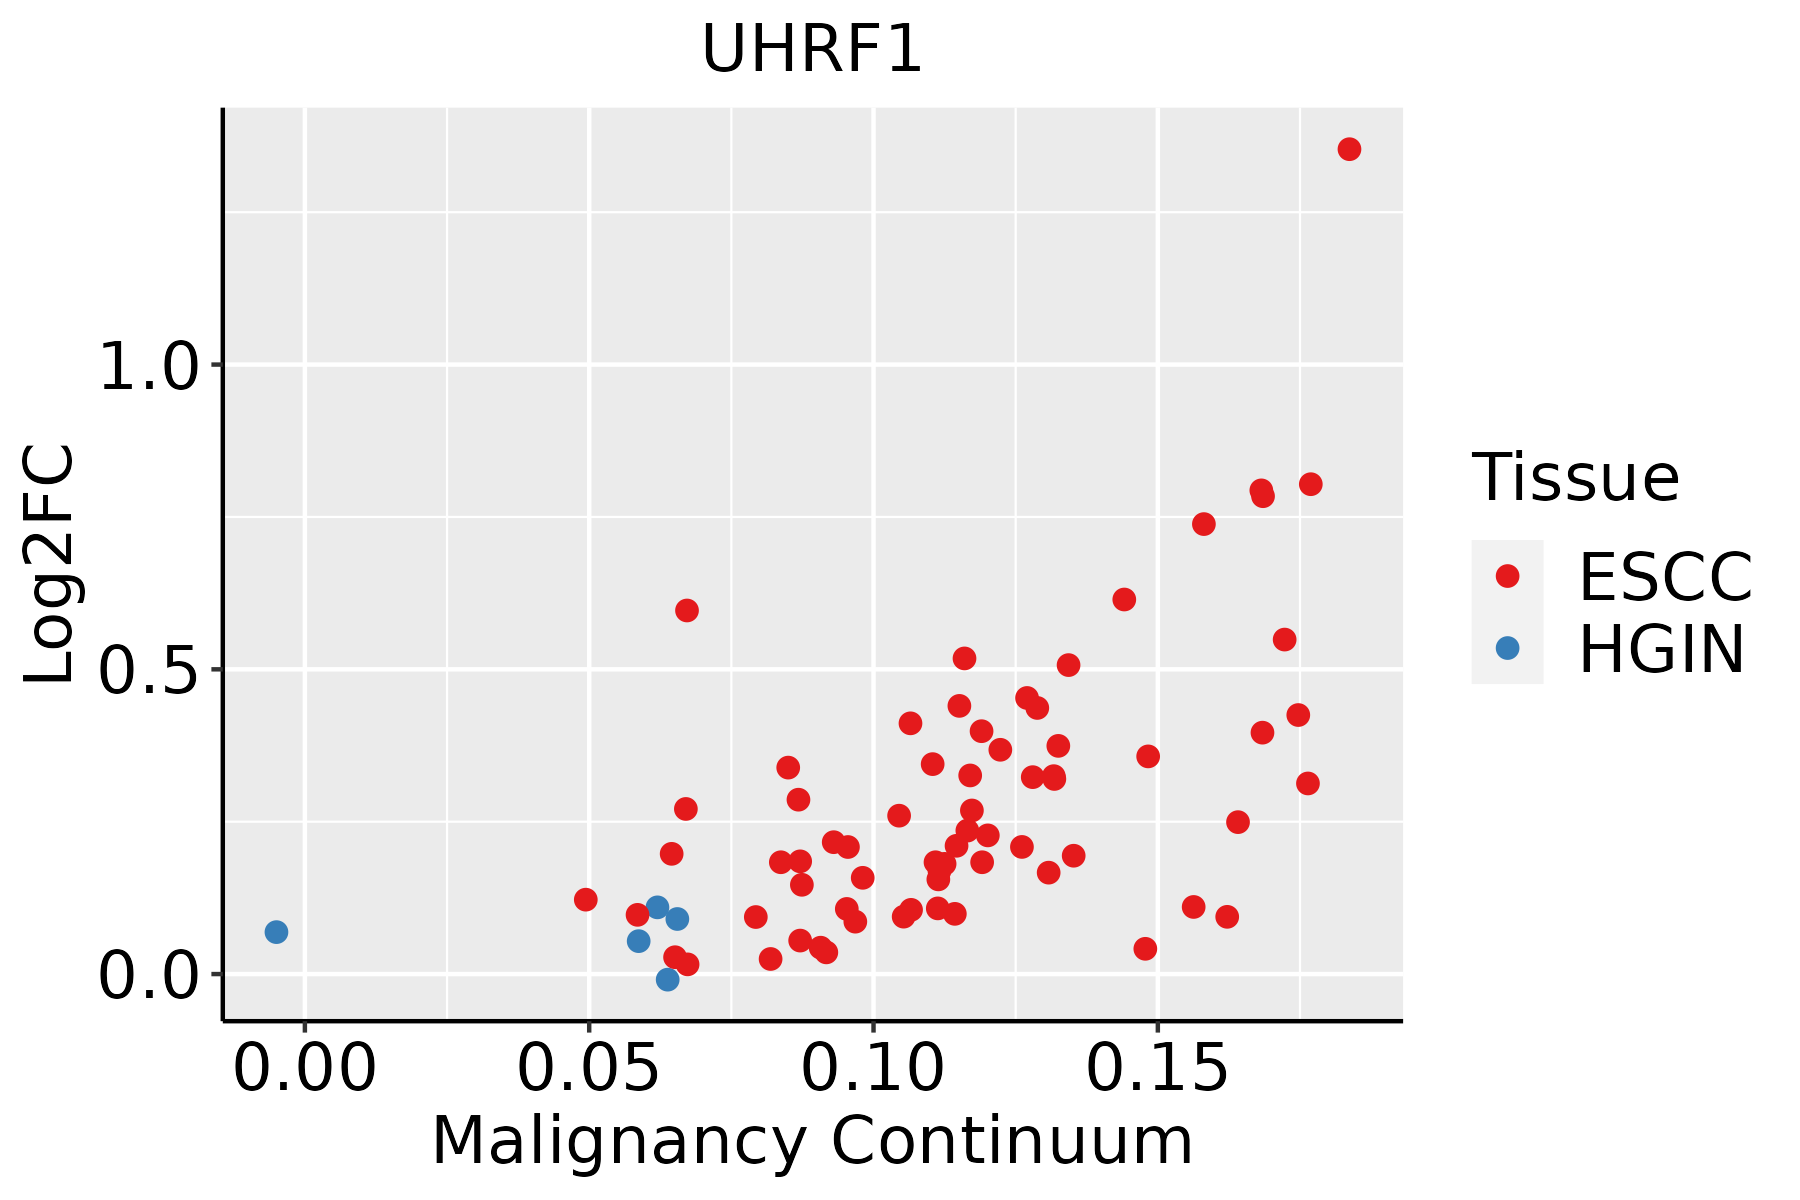 | ESCC: Esophageal squamous cell carcinoma |
| HGIN: High-grade intraepithelial neoplasias | ||
| LGIN: Low-grade intraepithelial neoplasias | ||
| Oral Cavity | 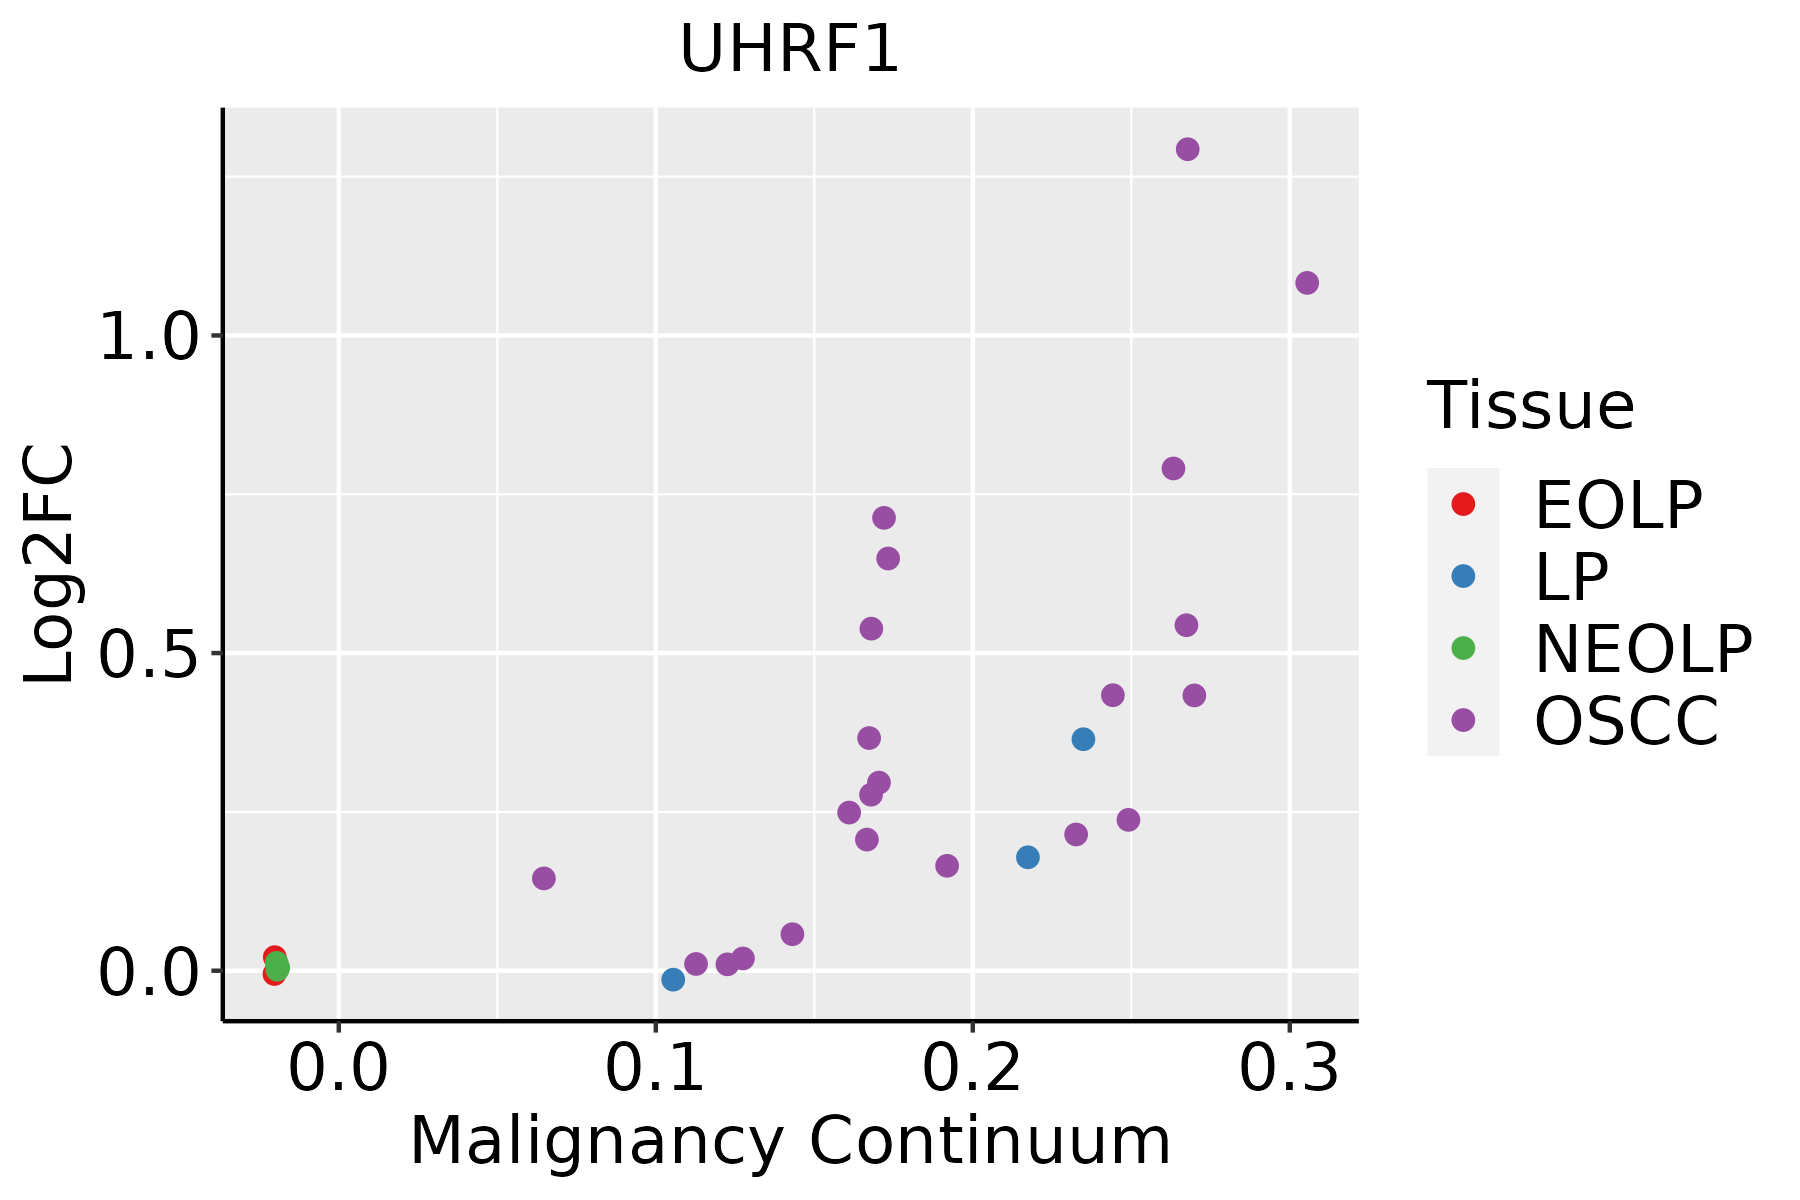 | EOLP: Erosive Oral lichen planus |
| LP: leukoplakia | ||
| NEOLP: Non-erosive oral lichen planus | ||
| OSCC: Oral squamous cell carcinoma | ||
| Thyroid | 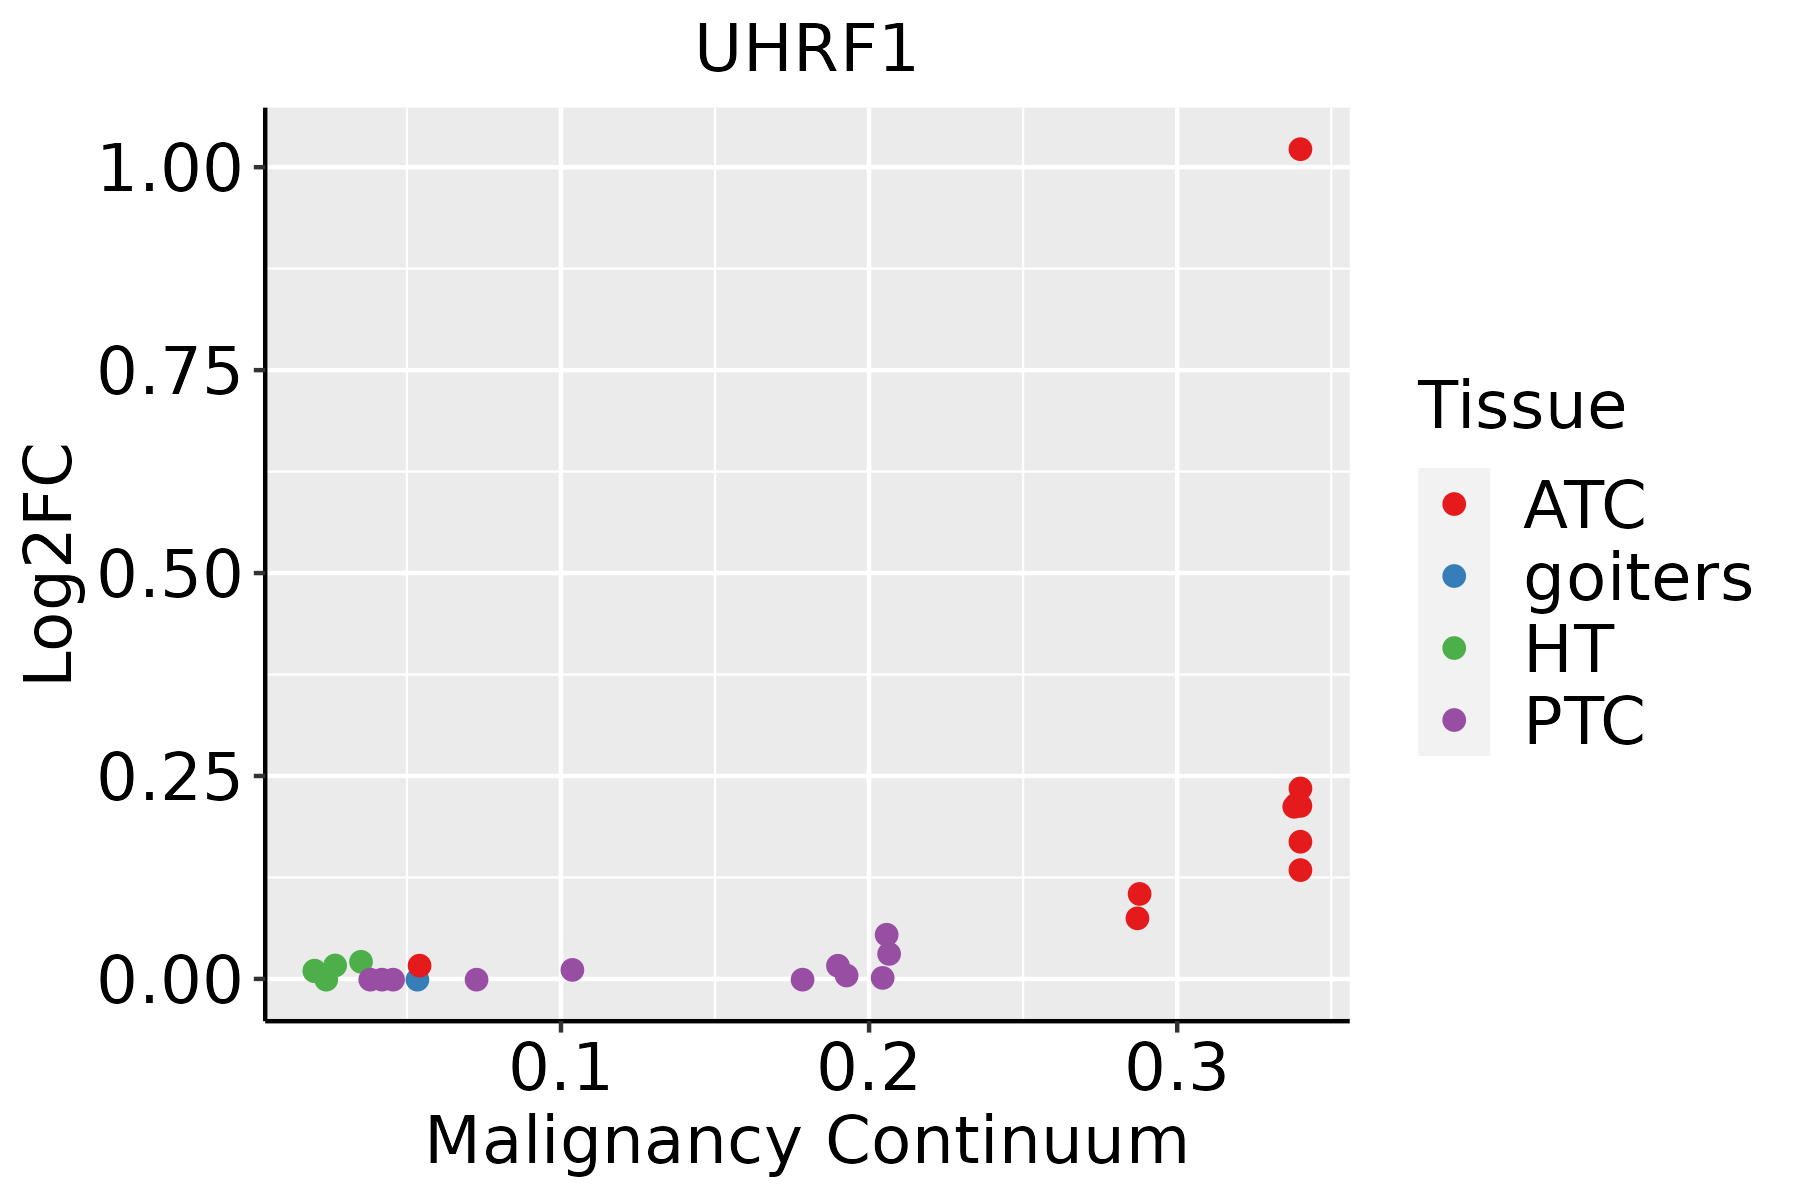 | ATC: Anaplastic thyroid cancer |
| HT: Hashimoto's thyroiditis | ||
| PTC: Papillary thyroid cancer |
| ∗log2FC in expression of this searched gene in stem-like cells from each diseased tissue sample relative to stem-like cells in normal samples in each tissue plotted against the malignancy continuum. Samples are colored based on if they are from different disease stage. |
Top |
Malignant transformation related pathway analysis |
| Find out the enriched GO biological processes and KEGG pathways involved in transition from healthy to precancer to cancer |
| Tissue | Disease Stage | Enriched GO biological Processes |
| Colorectum | AD |  |
| Colorectum | SER |  |
| Colorectum | MSS |  |
| Colorectum | MSI-H |  |
| Colorectum | FAP |  |
| ∗Top 15 enriched GO BP terms are showed in the bar plot of each disease state in each tissue. Each row represents a significant GO biological process which is colored according to the -log10(p.adjust). |
| Page: 1 2 3 4 5 6 7 8 9 |
| GO ID | Tissue | Disease Stage | Description | Gene Ratio | Bg Ratio | pvalue | p.adjust | Count |
| GO:001657015 | Esophagus | ESCC | histone modification | 323/8552 | 463/18723 | 2.61e-26 | 7.88e-24 | 323 |
| GO:00065136 | Esophagus | ESCC | protein monoubiquitination | 53/8552 | 67/18723 | 2.11e-08 | 4.03e-07 | 53 |
| GO:001657414 | Esophagus | ESCC | histone ubiquitination | 40/8552 | 47/18723 | 2.40e-08 | 4.55e-07 | 40 |
| GO:00103904 | Esophagus | ESCC | histone monoubiquitination | 25/8552 | 29/18723 | 7.24e-06 | 7.20e-05 | 25 |
| GO:005067318 | Esophagus | ESCC | epithelial cell proliferation | 238/8552 | 437/18723 | 1.19e-04 | 8.20e-04 | 238 |
| GO:005067817 | Esophagus | ESCC | regulation of epithelial cell proliferation | 206/8552 | 381/18723 | 5.51e-04 | 3.02e-03 | 206 |
| GO:00518658 | Esophagus | ESCC | protein autoubiquitination | 47/8552 | 73/18723 | 9.72e-04 | 4.93e-03 | 47 |
| GO:00165707 | Oral cavity | OSCC | histone modification | 270/7305 | 463/18723 | 1.59e-17 | 1.50e-15 | 270 |
| GO:00165746 | Oral cavity | OSCC | histone ubiquitination | 38/7305 | 47/18723 | 5.22e-09 | 1.14e-07 | 38 |
| GO:00065135 | Oral cavity | OSCC | protein monoubiquitination | 47/7305 | 67/18723 | 2.32e-07 | 3.68e-06 | 47 |
| GO:00103903 | Oral cavity | OSCC | histone monoubiquitination | 24/7305 | 29/18723 | 1.74e-06 | 2.26e-05 | 24 |
| GO:005067310 | Oral cavity | OSCC | epithelial cell proliferation | 212/7305 | 437/18723 | 2.82e-05 | 2.61e-04 | 212 |
| GO:005067810 | Oral cavity | OSCC | regulation of epithelial cell proliferation | 180/7305 | 381/18723 | 5.88e-04 | 3.35e-03 | 180 |
| GO:00518657 | Oral cavity | OSCC | protein autoubiquitination | 40/7305 | 73/18723 | 4.45e-03 | 1.79e-02 | 40 |
| GO:001657014 | Oral cavity | LP | histone modification | 152/4623 | 463/18723 | 4.04e-05 | 5.90e-04 | 152 |
| GO:000651313 | Oral cavity | LP | protein monoubiquitination | 29/4623 | 67/18723 | 6.51e-04 | 5.90e-03 | 29 |
| GO:001657413 | Oral cavity | LP | histone ubiquitination | 22/4623 | 47/18723 | 8.02e-04 | 7.05e-03 | 22 |
| GO:00103901 | Oral cavity | LP | histone monoubiquitination | 15/4623 | 29/18723 | 1.55e-03 | 1.20e-02 | 15 |
| GO:005186512 | Oral cavity | LP | protein autoubiquitination | 29/4623 | 73/18723 | 3.20e-03 | 2.18e-02 | 29 |
| GO:001657017 | Thyroid | ATC | histone modification | 243/6293 | 463/18723 | 2.23e-17 | 2.27e-15 | 243 |
| Page: 1 2 |
| Pathway ID | Tissue | Disease Stage | Description | Gene Ratio | Bg Ratio | pvalue | p.adjust | qvalue | Count |
| Page: 1 |
Top |
Cell-cell communication analysis |
| Identification of potential cell-cell interactions between two cell types and their ligand-receptor pairs for different disease states |
| Ligand | Receptor | LRpair | Pathway | Tissue | Disease Stage |
| Page: 1 |
Top |
Single-cell gene regulatory network inference analysis |
| Find out the significant the regulons (TFs) and the target genes of each regulon across cell types for different disease states |
| TF | Cell Type | Tissue | Disease Stage | Target Gene | RSS | Regulon Activity |
| ∗The dot plots of a searched regulon are shown for all cell subpopulations in each disease state of each tissue based on the regulon specific score inferred using pySCENIC and by calculating the average expression. |
| Page: 1 |
Top |
Somatic mutation of malignant transformation related genes |
| Annotation of somatic variants for genes involved in malignant transformation |
| Hugo Symbol | Variant Class | Variant Classification | dbSNP RS | HGVSc | HGVSp | HGVSp Short | SWISSPROT | BIOTYPE | SIFT | PolyPhen | Tumor Sample Barcode | Tissue | Histology | Sex | Age | Stage | Therapy Types | Drugs | Outcome |
| UHRF1 | SNV | Missense_Mutation | novel | c.1526N>G | p.Ser509Cys | p.S509C | protein_coding | deleterious(0.02) | probably_damaging(0.995) | TCGA-AC-A23H-01 | Breast | breast invasive carcinoma | Female | >=65 | I/II | Unknown | Unknown | PD | |
| UHRF1 | SNV | Missense_Mutation | novel | c.2181N>A | p.Phe727Leu | p.F727L | protein_coding | deleterious(0.02) | possibly_damaging(0.767) | TCGA-AC-A23H-01 | Breast | breast invasive carcinoma | Female | >=65 | I/II | Unknown | Unknown | PD | |
| UHRF1 | SNV | Missense_Mutation | novel | c.2212A>G | p.Ile738Val | p.I738V | protein_coding | tolerated(0.42) | possibly_damaging(0.514) | TCGA-AN-A0XV-01 | Breast | breast invasive carcinoma | Female | >=65 | III/IV | Unknown | Unknown | SD | |
| UHRF1 | SNV | Missense_Mutation | novel | c.2246C>T | p.Thr749Met | p.T749M | protein_coding | deleterious(0) | probably_damaging(0.999) | TCGA-BH-A0DO-01 | Breast | breast invasive carcinoma | Female | >=65 | I/II | Unknown | Unknown | SD | |
| UHRF1 | SNV | Missense_Mutation | novel | c.829N>T | p.Asp277Tyr | p.D277Y | protein_coding | deleterious(0) | possibly_damaging(0.459) | TCGA-C8-A1HM-01 | Breast | breast invasive carcinoma | Female | >=65 | I/II | Chemotherapy | doxorubicin | CR | |
| UHRF1 | SNV | Missense_Mutation | novel | c.901N>T | p.Pro301Ser | p.P301S | protein_coding | tolerated(0.3) | benign(0.02) | TCGA-E2-A9RU-01 | Breast | breast invasive carcinoma | Female | >=65 | III/IV | Hormone Therapy | arimidex | SD | |
| UHRF1 | SNV | Missense_Mutation | novel | c.1456G>T | p.Gly486Trp | p.G486W | protein_coding | deleterious(0) | probably_damaging(1) | TCGA-OL-A6VR-01 | Breast | breast invasive carcinoma | Female | <65 | I/II | Unknown | Unknown | SD | |
| UHRF1 | insertion | Nonsense_Mutation | novel | c.1604_1605insATAATCTCGGCT | p.Ala535_Glu536insTer | p.A535_E536ins* | protein_coding | TCGA-A8-A06P-01 | Breast | breast invasive carcinoma | Female | <65 | III/IV | Unspecific | SD | ||||
| UHRF1 | insertion | Frame_Shift_Ins | novel | c.761_762insCCTGCCTGGATTTCCAGCTTCTCTTGACAAAT | p.Glu255LeufsTer36 | p.E255Lfs*36 | protein_coding | TCGA-A8-A08R-01 | Breast | breast invasive carcinoma | Female | <65 | I/II | Unknown | Unknown | SD | |||
| UHRF1 | insertion | In_Frame_Ins | novel | c.1696_1697insCGCGCC | p.Asn566delinsThrArgHis | p.N566delinsTRH | protein_coding | TCGA-B6-A0IM-01 | Breast | breast invasive carcinoma | Female | >=65 | I/II | Unknown | Unknown | SD |
| Page: 1 2 3 4 5 6 7 8 9 |
Top |
Related drugs of malignant transformation related genes |
| Identification of chemicals and drugs interact with genes involved in malignant transfromation |
| (DGIdb 4.0) |
| Entrez ID | Symbol | Category | Interaction Types | Drug Claim Name | Drug Name | PMIDs |
| Page: 1 |

Copyright 2023-Present -The University of Texas Health Science Center at Houston |