
|
|||||
|
 | |
| |
| |
| |
| |
| |
|
Gene: UBL7 |
Gene summary for UBL7 |
| Gene information | Species | Human | Gene symbol | UBL7 | Gene ID | 84993 |
| Gene name | ubiquitin like 7 | |
| Gene Alias | BMSC-UbP | |
| Cytomap | 15q24.1 | |
| Gene Type | protein-coding | GO ID | GO:0006508 | UniProtAcc | Q96S82 |
Top |
Malignant transformation analysis |
| Identification of the aberrant gene expression in precancerous and cancerous lesions by comparing the gene expression of stem-like cells in diseased tissues with normal stem cells |
| Entrez ID | Symbol | Replicates | Species | Organ | Tissue | Adj P-value | Log2FC | Malignancy |
| 84993 | UBL7 | P30T-E | Human | Esophagus | ESCC | 4.65e-29 | 1.02e+00 | 0.137 |
| 84993 | UBL7 | P31T-E | Human | Esophagus | ESCC | 5.29e-35 | 6.85e-01 | 0.1251 |
| 84993 | UBL7 | P32T-E | Human | Esophagus | ESCC | 2.40e-46 | 8.51e-01 | 0.1666 |
| 84993 | UBL7 | P36T-E | Human | Esophagus | ESCC | 5.67e-16 | 5.22e-01 | 0.1187 |
| 84993 | UBL7 | P37T-E | Human | Esophagus | ESCC | 1.13e-30 | 5.93e-01 | 0.1371 |
| 84993 | UBL7 | P38T-E | Human | Esophagus | ESCC | 2.35e-12 | 7.26e-01 | 0.127 |
| 84993 | UBL7 | P39T-E | Human | Esophagus | ESCC | 4.63e-24 | 4.79e-01 | 0.0894 |
| 84993 | UBL7 | P40T-E | Human | Esophagus | ESCC | 2.50e-13 | 2.88e-01 | 0.109 |
| 84993 | UBL7 | P42T-E | Human | Esophagus | ESCC | 2.84e-25 | 6.28e-01 | 0.1175 |
| 84993 | UBL7 | P44T-E | Human | Esophagus | ESCC | 2.28e-12 | 4.21e-01 | 0.1096 |
| 84993 | UBL7 | P47T-E | Human | Esophagus | ESCC | 4.49e-29 | 4.81e-01 | 0.1067 |
| 84993 | UBL7 | P48T-E | Human | Esophagus | ESCC | 7.64e-29 | 4.83e-01 | 0.0959 |
| 84993 | UBL7 | P49T-E | Human | Esophagus | ESCC | 3.06e-14 | 1.22e+00 | 0.1768 |
| 84993 | UBL7 | P52T-E | Human | Esophagus | ESCC | 2.55e-32 | 8.10e-01 | 0.1555 |
| 84993 | UBL7 | P54T-E | Human | Esophagus | ESCC | 3.26e-14 | 4.41e-01 | 0.0975 |
| 84993 | UBL7 | P56T-E | Human | Esophagus | ESCC | 3.42e-13 | 1.58e+00 | 0.1613 |
| 84993 | UBL7 | P57T-E | Human | Esophagus | ESCC | 1.33e-19 | 4.39e-01 | 0.0926 |
| 84993 | UBL7 | P61T-E | Human | Esophagus | ESCC | 3.90e-19 | 4.81e-01 | 0.099 |
| 84993 | UBL7 | P62T-E | Human | Esophagus | ESCC | 8.65e-31 | 5.30e-01 | 0.1302 |
| 84993 | UBL7 | P65T-E | Human | Esophagus | ESCC | 6.98e-18 | 4.32e-01 | 0.0978 |
| Page: 1 2 3 4 5 6 |
| Tissue | Expression Dynamics | Abbreviation |
| Colorectum (GSE201348) |  | FAP: Familial adenomatous polyposis |
| CRC: Colorectal cancer | ||
| Colorectum (HTA11) |  | AD: Adenomas |
| SER: Sessile serrated lesions | ||
| MSI-H: Microsatellite-high colorectal cancer | ||
| MSS: Microsatellite stable colorectal cancer | ||
| Esophagus | 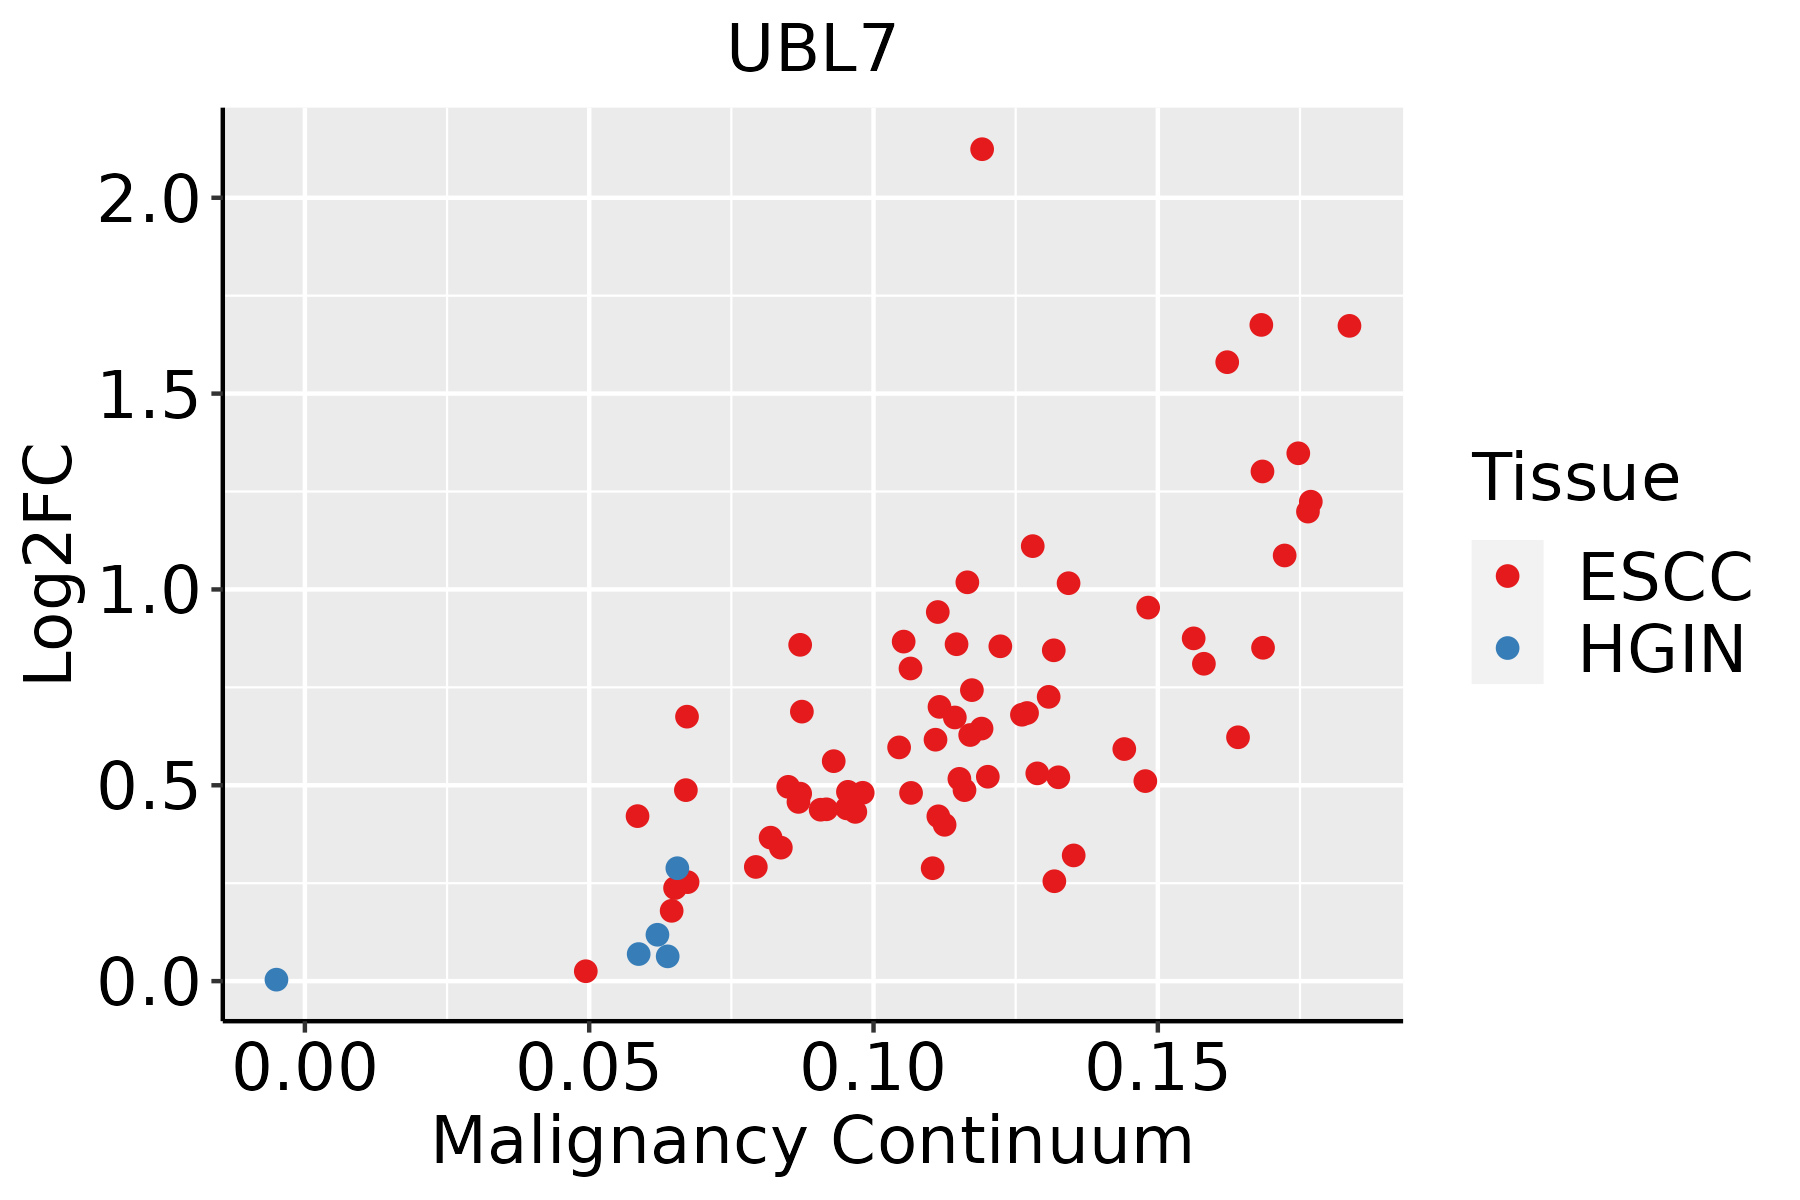 | ESCC: Esophageal squamous cell carcinoma |
| HGIN: High-grade intraepithelial neoplasias | ||
| LGIN: Low-grade intraepithelial neoplasias | ||
| Liver |  | HCC: Hepatocellular carcinoma |
| NAFLD: Non-alcoholic fatty liver disease | ||
| Oral Cavity |  | EOLP: Erosive Oral lichen planus |
| LP: leukoplakia | ||
| NEOLP: Non-erosive oral lichen planus | ||
| OSCC: Oral squamous cell carcinoma | ||
| Skin | 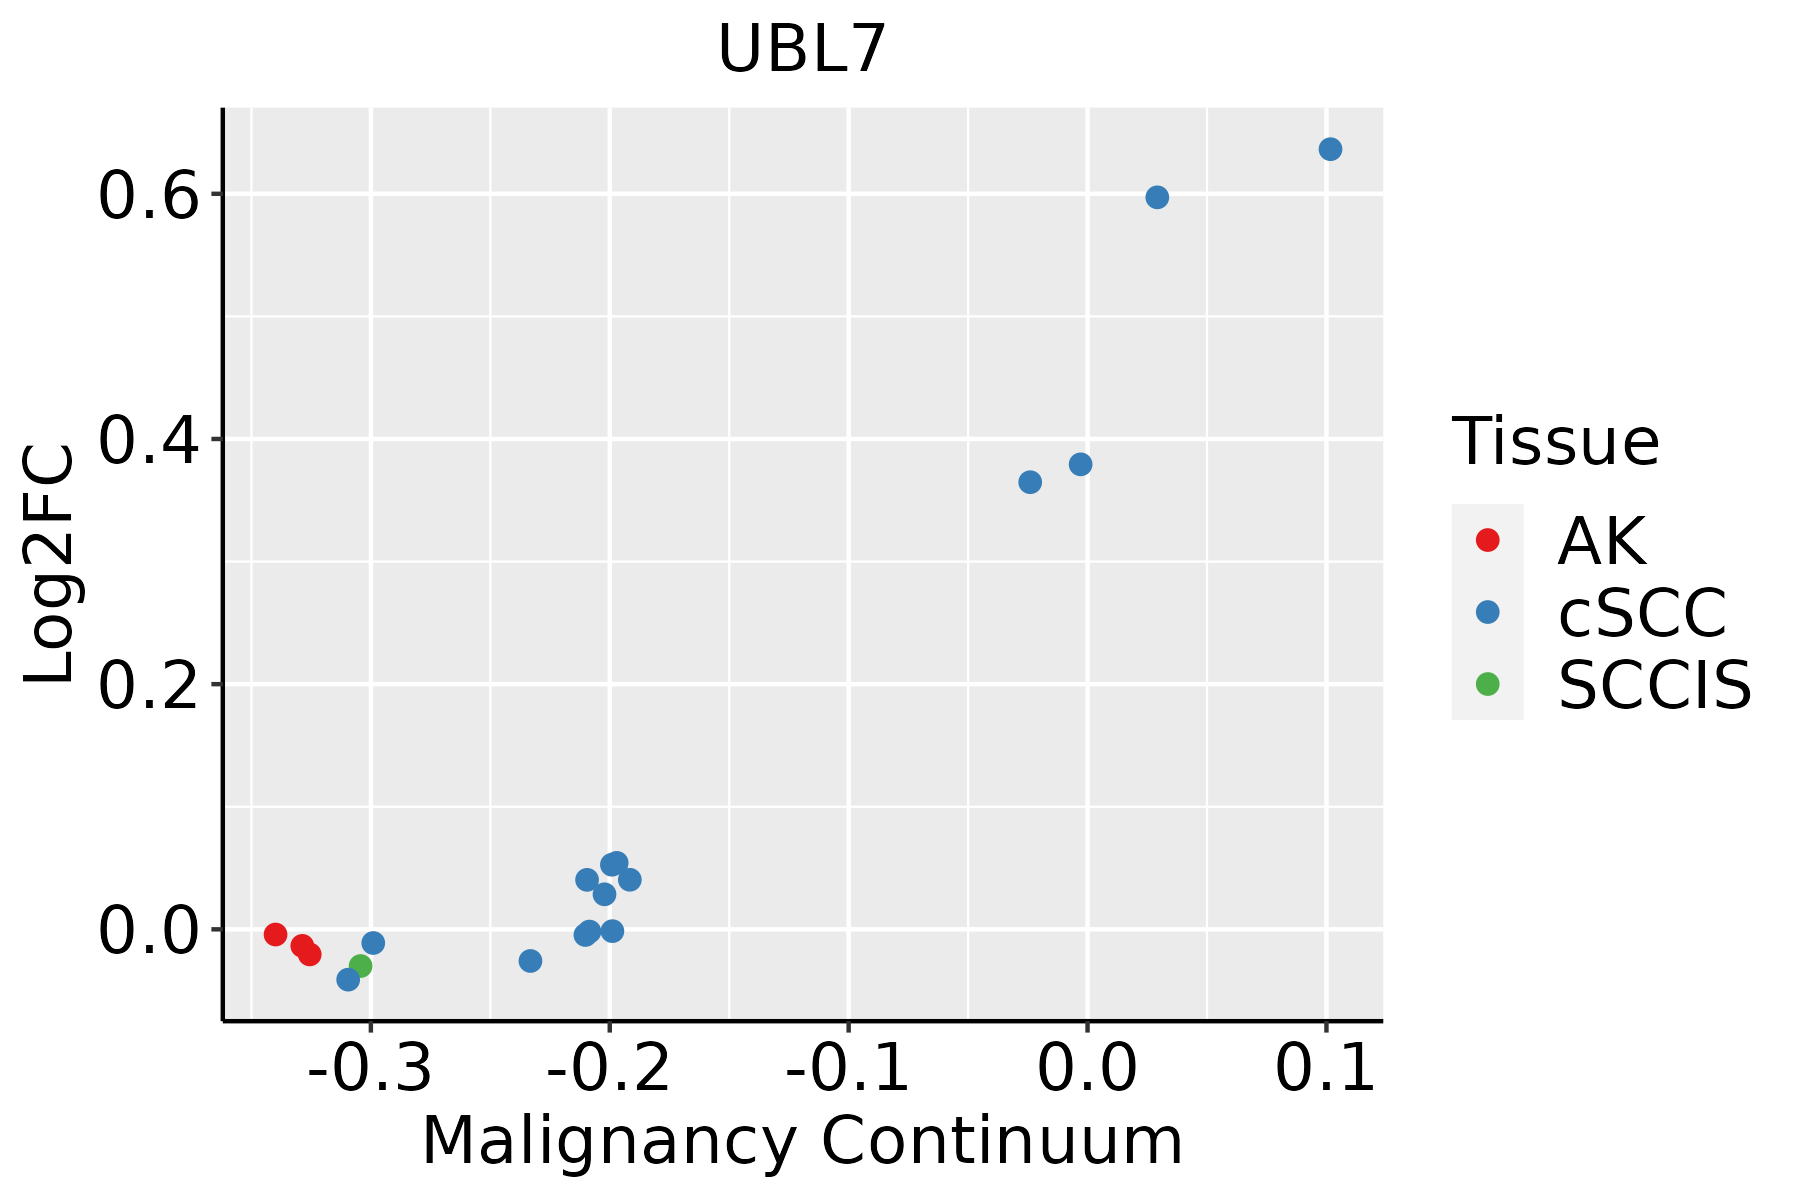 | AK: Actinic keratosis |
| cSCC: Cutaneous squamous cell carcinoma | ||
| SCCIS:squamous cell carcinoma in situ |
| ∗log2FC in expression of this searched gene in stem-like cells from each diseased tissue sample relative to stem-like cells in normal samples in each tissue plotted against the malignancy continuum. Samples are colored based on if they are from different disease stage. |
Top |
Malignant transformation related pathway analysis |
| Find out the enriched GO biological processes and KEGG pathways involved in transition from healthy to precancer to cancer |
| Tissue | Disease Stage | Enriched GO biological Processes |
| Colorectum | AD |  |
| Colorectum | SER |  |
| Colorectum | MSS |  |
| Colorectum | MSI-H |  |
| Colorectum | FAP |  |
| ∗Top 15 enriched GO BP terms are showed in the bar plot of each disease state in each tissue. Each row represents a significant GO biological process which is colored according to the -log10(p.adjust). |
| Page: 1 2 3 4 5 6 7 8 9 |
| GO ID | Tissue | Disease Stage | Description | Gene Ratio | Bg Ratio | pvalue | p.adjust | Count |
| Page: 1 |
| Pathway ID | Tissue | Disease Stage | Description | Gene Ratio | Bg Ratio | pvalue | p.adjust | qvalue | Count |
| Page: 1 |
Top |
Cell-cell communication analysis |
| Identification of potential cell-cell interactions between two cell types and their ligand-receptor pairs for different disease states |
| Ligand | Receptor | LRpair | Pathway | Tissue | Disease Stage |
| Page: 1 |
Top |
Single-cell gene regulatory network inference analysis |
| Find out the significant the regulons (TFs) and the target genes of each regulon across cell types for different disease states |
| TF | Cell Type | Tissue | Disease Stage | Target Gene | RSS | Regulon Activity |
| ∗The dot plots of a searched regulon are shown for all cell subpopulations in each disease state of each tissue based on the regulon specific score inferred using pySCENIC and by calculating the average expression. |
| Page: 1 |
Top |
Somatic mutation of malignant transformation related genes |
| Annotation of somatic variants for genes involved in malignant transformation |
| Hugo Symbol | Variant Class | Variant Classification | dbSNP RS | HGVSc | HGVSp | HGVSp Short | SWISSPROT | BIOTYPE | SIFT | PolyPhen | Tumor Sample Barcode | Tissue | Histology | Sex | Age | Stage | Therapy Types | Drugs | Outcome |
| UBL7 | SNV | Missense_Mutation | novel | c.871N>T | p.Pro291Ser | p.P291S | Q96S82 | protein_coding | tolerated(0.49) | benign(0.006) | TCGA-5L-AAT1-01 | Breast | breast invasive carcinoma | Female | <65 | III/IV | Hormone Therapy | letrozol | SD |
| UBL7 | SNV | Missense_Mutation | novel | c.807N>C | p.Gln269His | p.Q269H | Q96S82 | protein_coding | deleterious(0.02) | benign(0.371) | TCGA-AC-A3W6-01 | Breast | breast invasive carcinoma | Female | >=65 | III/IV | Unknown | Unknown | SD |
| UBL7 | insertion | Nonsense_Mutation | novel | c.885_886insGAATTCAAATTGATCTGTGTGCATTTTTTTTAAGC | p.His296GlufsTer11 | p.H296Efs*11 | Q96S82 | protein_coding | TCGA-A2-A0EV-01 | Breast | breast invasive carcinoma | Female | >=65 | I/II | Unknown | Unknown | SD | ||
| UBL7 | insertion | Frame_Shift_Ins | novel | c.907_908insGGAGAGGAGGAGGTAGAGAGGCT | p.Met303ArgfsTer61 | p.M303Rfs*61 | Q96S82 | protein_coding | TCGA-A8-A09N-01 | Breast | breast invasive carcinoma | Female | <65 | III/IV | Unknown | Unknown | SD | ||
| UBL7 | insertion | Nonsense_Mutation | novel | c.371_372insGACTTTGGCTGAACTGCCTGCTTACTGCCCCTTGACCTAGAT | p.Ser124_Ser125insThrLeuAlaGluLeuProAlaTyrCysProLeuThrTerIle | p.S124_S125insTLAELPAYCPLT*I | Q96S82 | protein_coding | TCGA-BH-A0HU-01 | Breast | breast invasive carcinoma | Female | <65 | I/II | Chemotherapy | docetaxel | SD | ||
| UBL7 | SNV | Missense_Mutation | novel | c.339N>A | p.Phe113Leu | p.F113L | Q96S82 | protein_coding | tolerated(0.51) | benign(0.031) | TCGA-2W-A8YY-01 | Cervix | cervical & endocervical cancer | Female | <65 | I/II | Chemotherapy | cisplatin | CR |
| UBL7 | SNV | Missense_Mutation | c.982N>A | p.Ala328Thr | p.A328T | Q96S82 | protein_coding | deleterious(0) | benign(0.438) | TCGA-CK-4950-01 | Colorectum | colon adenocarcinoma | Female | >=65 | III/IV | Chemotherapy | folfox | SD | |
| UBL7 | SNV | Missense_Mutation | c.754C>T | p.Arg252Cys | p.R252C | Q96S82 | protein_coding | deleterious(0.01) | benign(0.386) | TCGA-G4-6628-01 | Colorectum | colon adenocarcinoma | Male | >=65 | I/II | Unknown | Unknown | SD | |
| UBL7 | SNV | Missense_Mutation | novel | c.302N>A | p.Pro101Gln | p.P101Q | Q96S82 | protein_coding | deleterious(0.01) | benign(0.221) | TCGA-A5-A0G2-01 | Endometrium | uterine corpus endometrioid carcinoma | Female | <65 | III/IV | Unknown | Unknown | SD |
| UBL7 | SNV | Missense_Mutation | novel | c.239G>A | p.Gly80Asp | p.G80D | Q96S82 | protein_coding | deleterious(0.01) | probably_damaging(0.999) | TCGA-AP-A0LM-01 | Endometrium | uterine corpus endometrioid carcinoma | Female | <65 | III/IV | Chemotherapy | cisplatin | SD |
| Page: 1 2 |
Top |
Related drugs of malignant transformation related genes |
| Identification of chemicals and drugs interact with genes involved in malignant transfromation |
| (DGIdb 4.0) |
| Entrez ID | Symbol | Category | Interaction Types | Drug Claim Name | Drug Name | PMIDs |
| Page: 1 |

Copyright 2023-Present -The University of Texas Health Science Center at Houston |