
|
|||||
|
 | |
| |
| |
| |
| |
| |
|
Gene: UBAP2L |
Gene summary for UBAP2L |
| Gene information | Species | Human | Gene symbol | UBAP2L | Gene ID | 9898 |
| Gene name | ubiquitin associated protein 2 like | |
| Gene Alias | NICE-4 | |
| Cytomap | 1q21.3 | |
| Gene Type | protein-coding | GO ID | GO:0000003 | UniProtAcc | Q14157 |
Top |
Malignant transformation analysis |
| Identification of the aberrant gene expression in precancerous and cancerous lesions by comparing the gene expression of stem-like cells in diseased tissues with normal stem cells |
| Entrez ID | Symbol | Replicates | Species | Organ | Tissue | Adj P-value | Log2FC | Malignancy |
| 9898 | UBAP2L | P48T-E | Human | Esophagus | ESCC | 7.65e-21 | 4.82e-01 | 0.0959 |
| 9898 | UBAP2L | P49T-E | Human | Esophagus | ESCC | 5.04e-10 | 1.19e+00 | 0.1768 |
| 9898 | UBAP2L | P52T-E | Human | Esophagus | ESCC | 1.48e-30 | 6.34e-01 | 0.1555 |
| 9898 | UBAP2L | P54T-E | Human | Esophagus | ESCC | 5.58e-14 | 3.84e-01 | 0.0975 |
| 9898 | UBAP2L | P56T-E | Human | Esophagus | ESCC | 1.77e-08 | 1.05e+00 | 0.1613 |
| 9898 | UBAP2L | P57T-E | Human | Esophagus | ESCC | 1.36e-18 | 2.75e-01 | 0.0926 |
| 9898 | UBAP2L | P61T-E | Human | Esophagus | ESCC | 1.45e-14 | 3.67e-01 | 0.099 |
| 9898 | UBAP2L | P62T-E | Human | Esophagus | ESCC | 7.26e-49 | 9.23e-01 | 0.1302 |
| 9898 | UBAP2L | P65T-E | Human | Esophagus | ESCC | 2.25e-21 | 3.25e-01 | 0.0978 |
| 9898 | UBAP2L | P74T-E | Human | Esophagus | ESCC | 6.59e-23 | 6.02e-01 | 0.1479 |
| 9898 | UBAP2L | P75T-E | Human | Esophagus | ESCC | 6.87e-29 | 5.53e-01 | 0.1125 |
| 9898 | UBAP2L | P76T-E | Human | Esophagus | ESCC | 1.33e-20 | 4.38e-01 | 0.1207 |
| 9898 | UBAP2L | P79T-E | Human | Esophagus | ESCC | 1.73e-26 | 4.93e-01 | 0.1154 |
| 9898 | UBAP2L | P80T-E | Human | Esophagus | ESCC | 3.65e-22 | 7.30e-01 | 0.155 |
| 9898 | UBAP2L | P82T-E | Human | Esophagus | ESCC | 9.65e-16 | 5.66e-01 | 0.1072 |
| 9898 | UBAP2L | P83T-E | Human | Esophagus | ESCC | 6.44e-29 | 8.63e-01 | 0.1738 |
| 9898 | UBAP2L | P89T-E | Human | Esophagus | ESCC | 3.09e-19 | 1.30e+00 | 0.1752 |
| 9898 | UBAP2L | P91T-E | Human | Esophagus | ESCC | 1.13e-09 | 9.24e-01 | 0.1828 |
| 9898 | UBAP2L | P104T-E | Human | Esophagus | ESCC | 2.82e-03 | 3.91e-01 | 0.0931 |
| 9898 | UBAP2L | P107T-E | Human | Esophagus | ESCC | 3.49e-46 | 1.04e+00 | 0.171 |
| Page: 1 2 3 4 5 6 |
| Tissue | Expression Dynamics | Abbreviation |
| Esophagus | 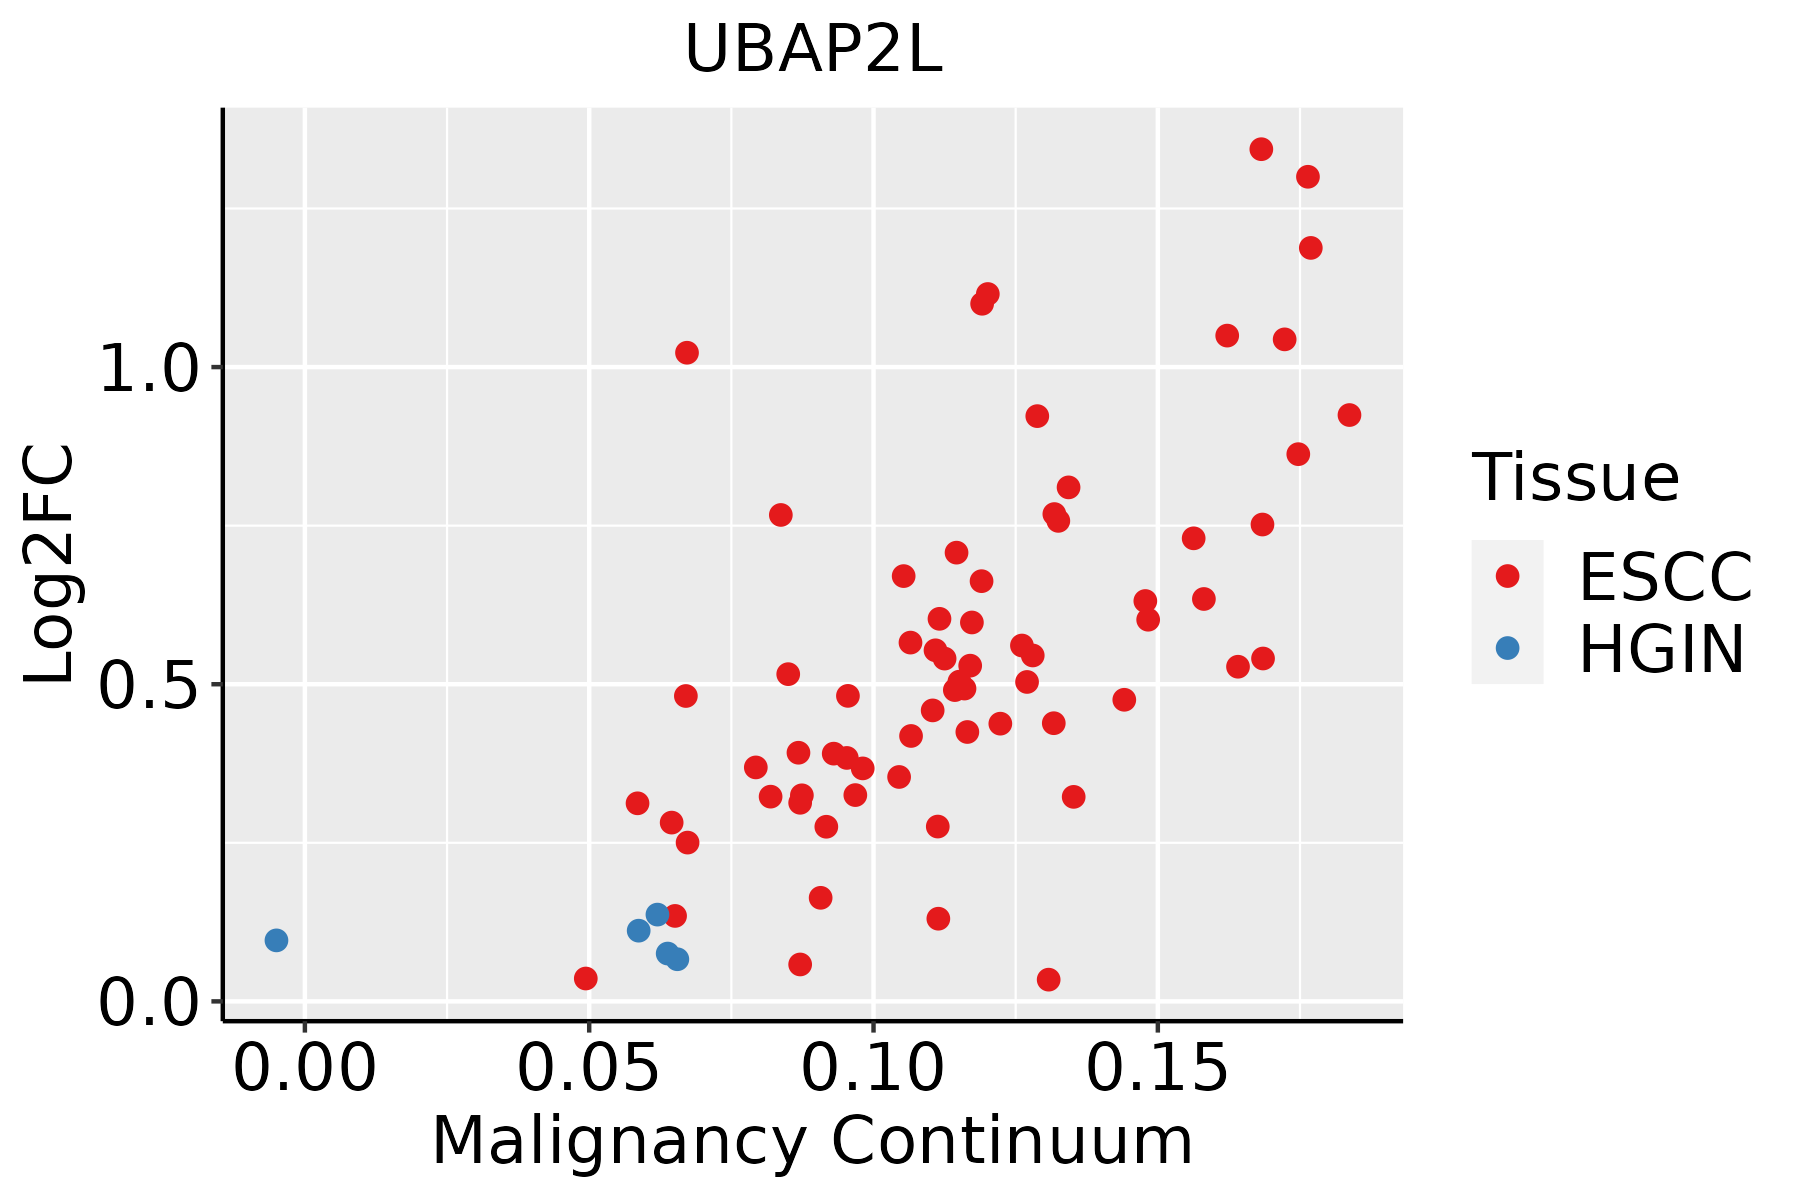 | ESCC: Esophageal squamous cell carcinoma |
| HGIN: High-grade intraepithelial neoplasias | ||
| LGIN: Low-grade intraepithelial neoplasias | ||
| Liver |  | HCC: Hepatocellular carcinoma |
| NAFLD: Non-alcoholic fatty liver disease | ||
| Oral Cavity | 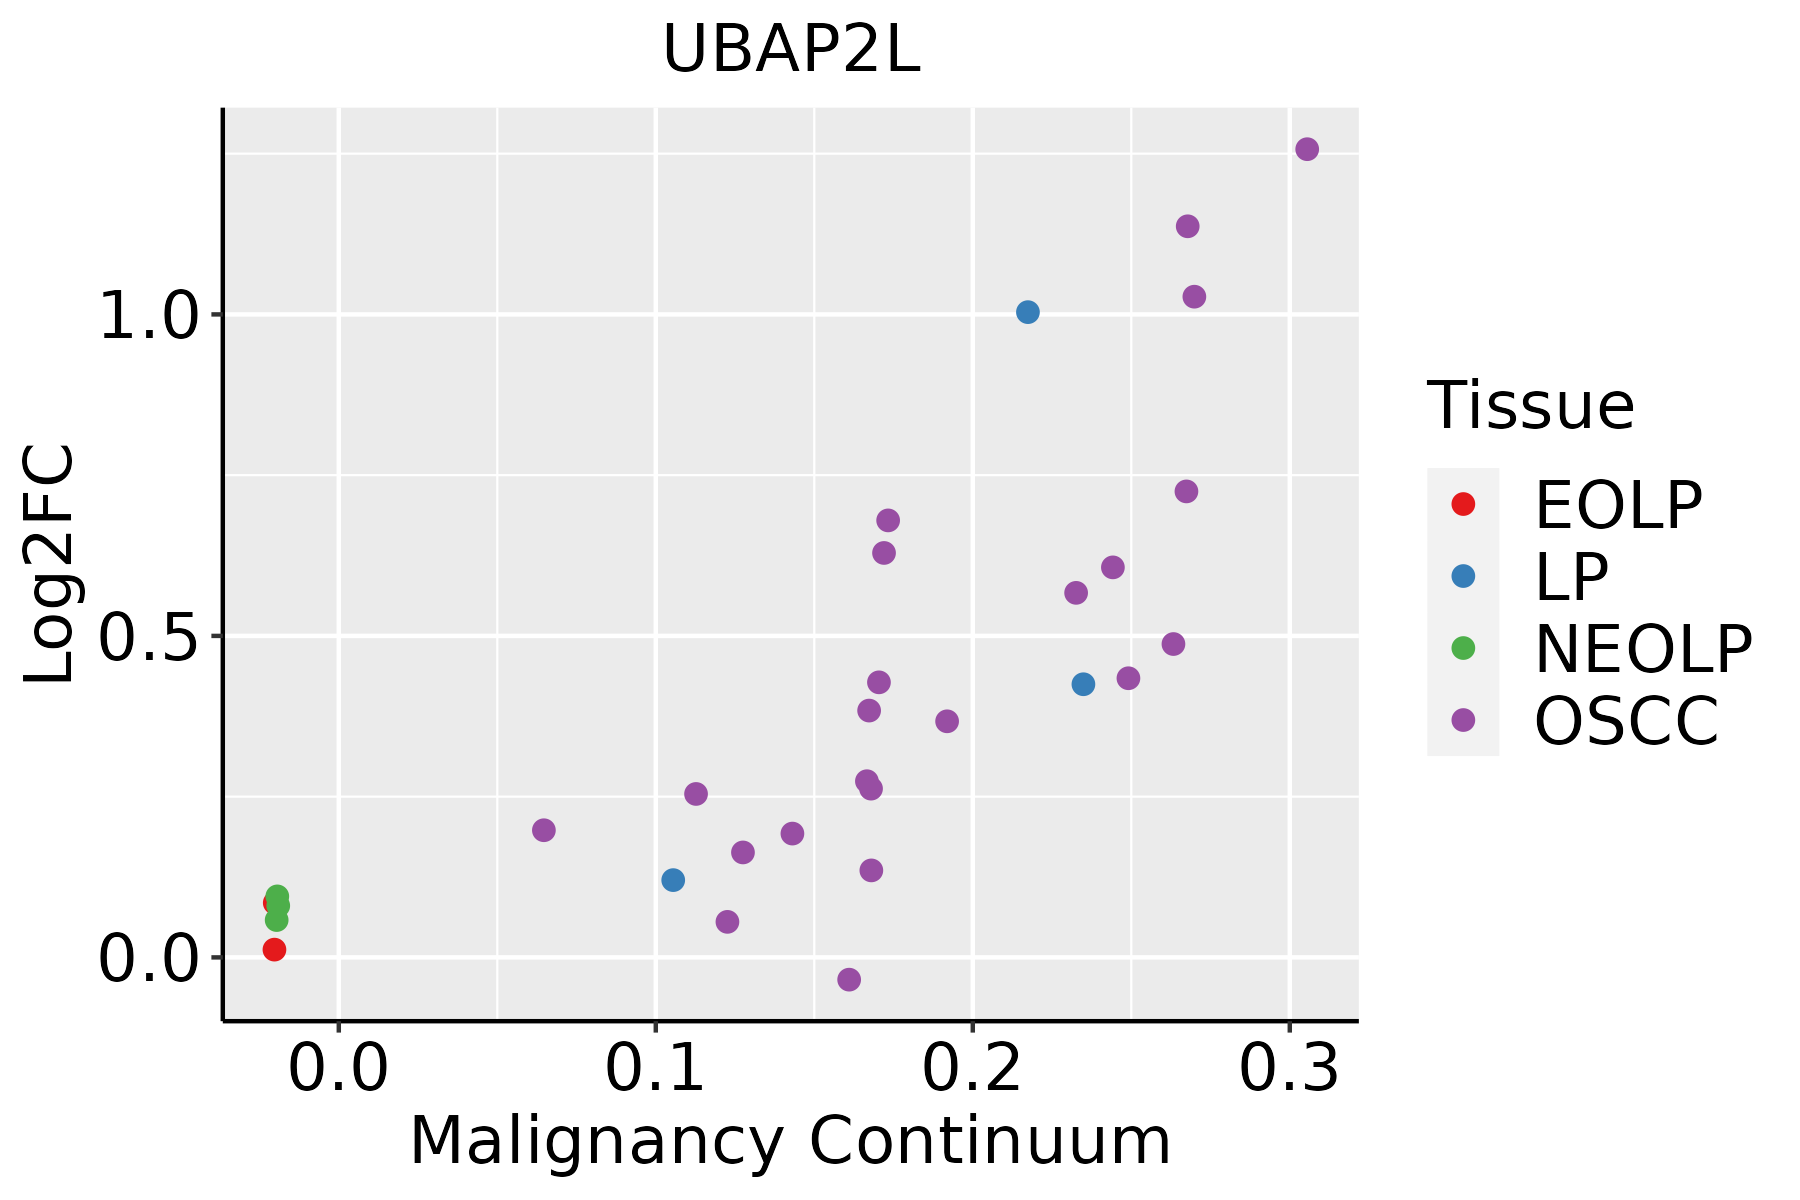 | EOLP: Erosive Oral lichen planus |
| LP: leukoplakia | ||
| NEOLP: Non-erosive oral lichen planus | ||
| OSCC: Oral squamous cell carcinoma | ||
| Prostate | 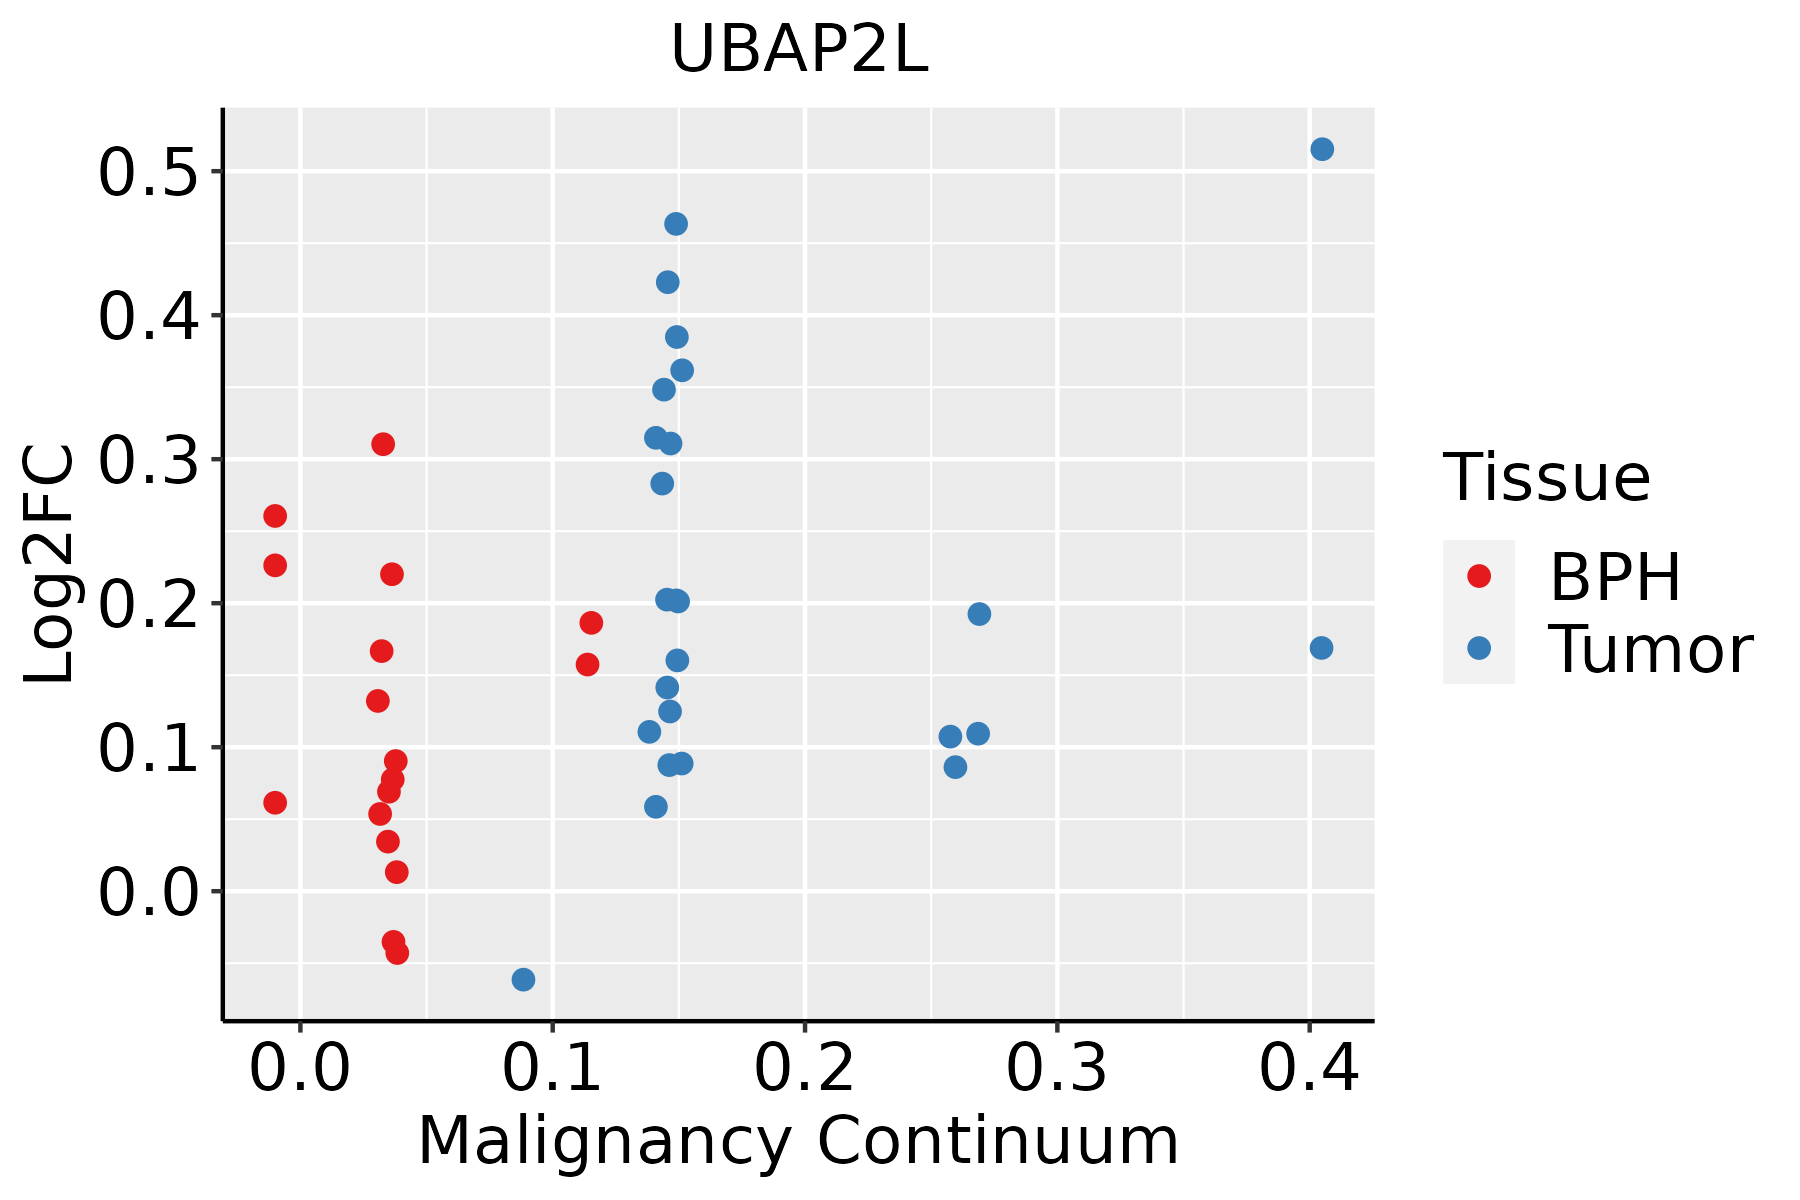 | BPH: Benign Prostatic Hyperplasia |
| Skin | 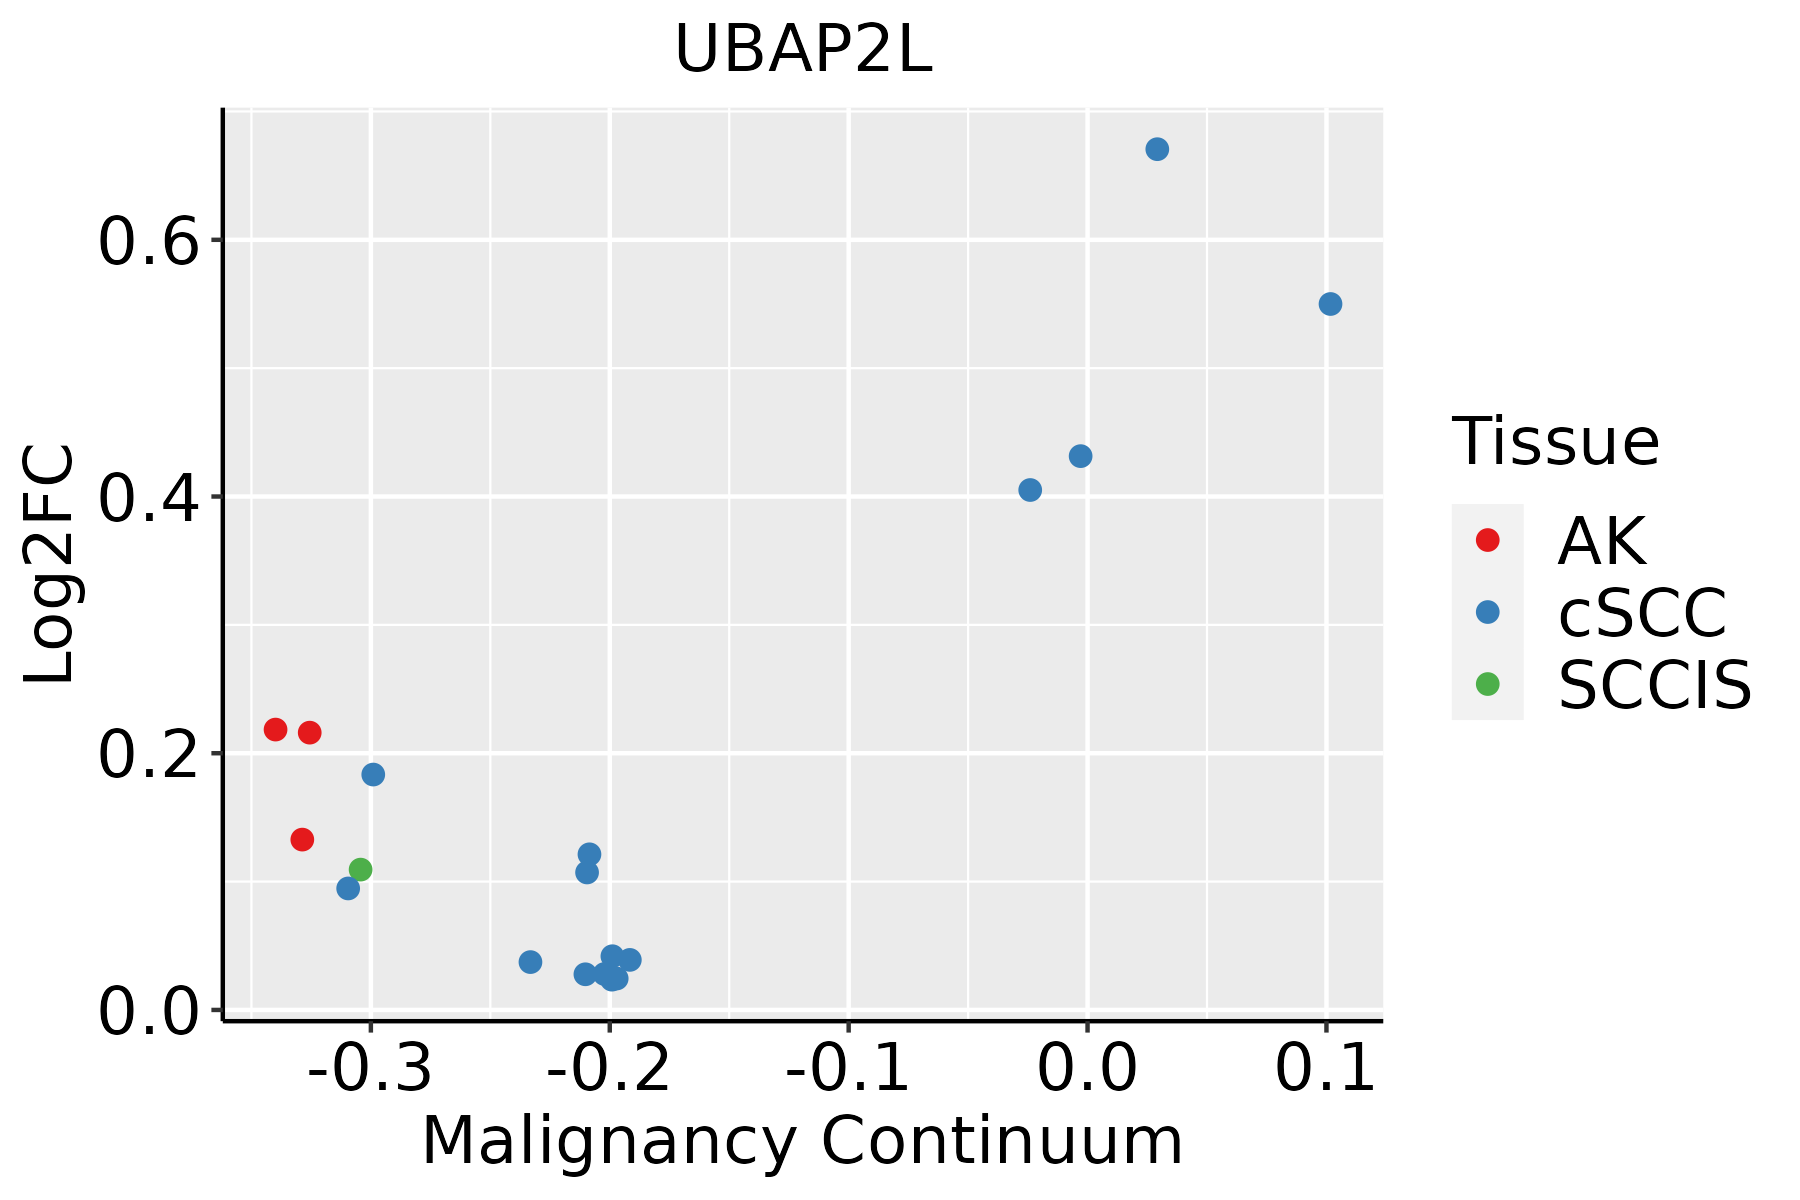 | AK: Actinic keratosis |
| cSCC: Cutaneous squamous cell carcinoma | ||
| SCCIS:squamous cell carcinoma in situ | ||
| Thyroid | 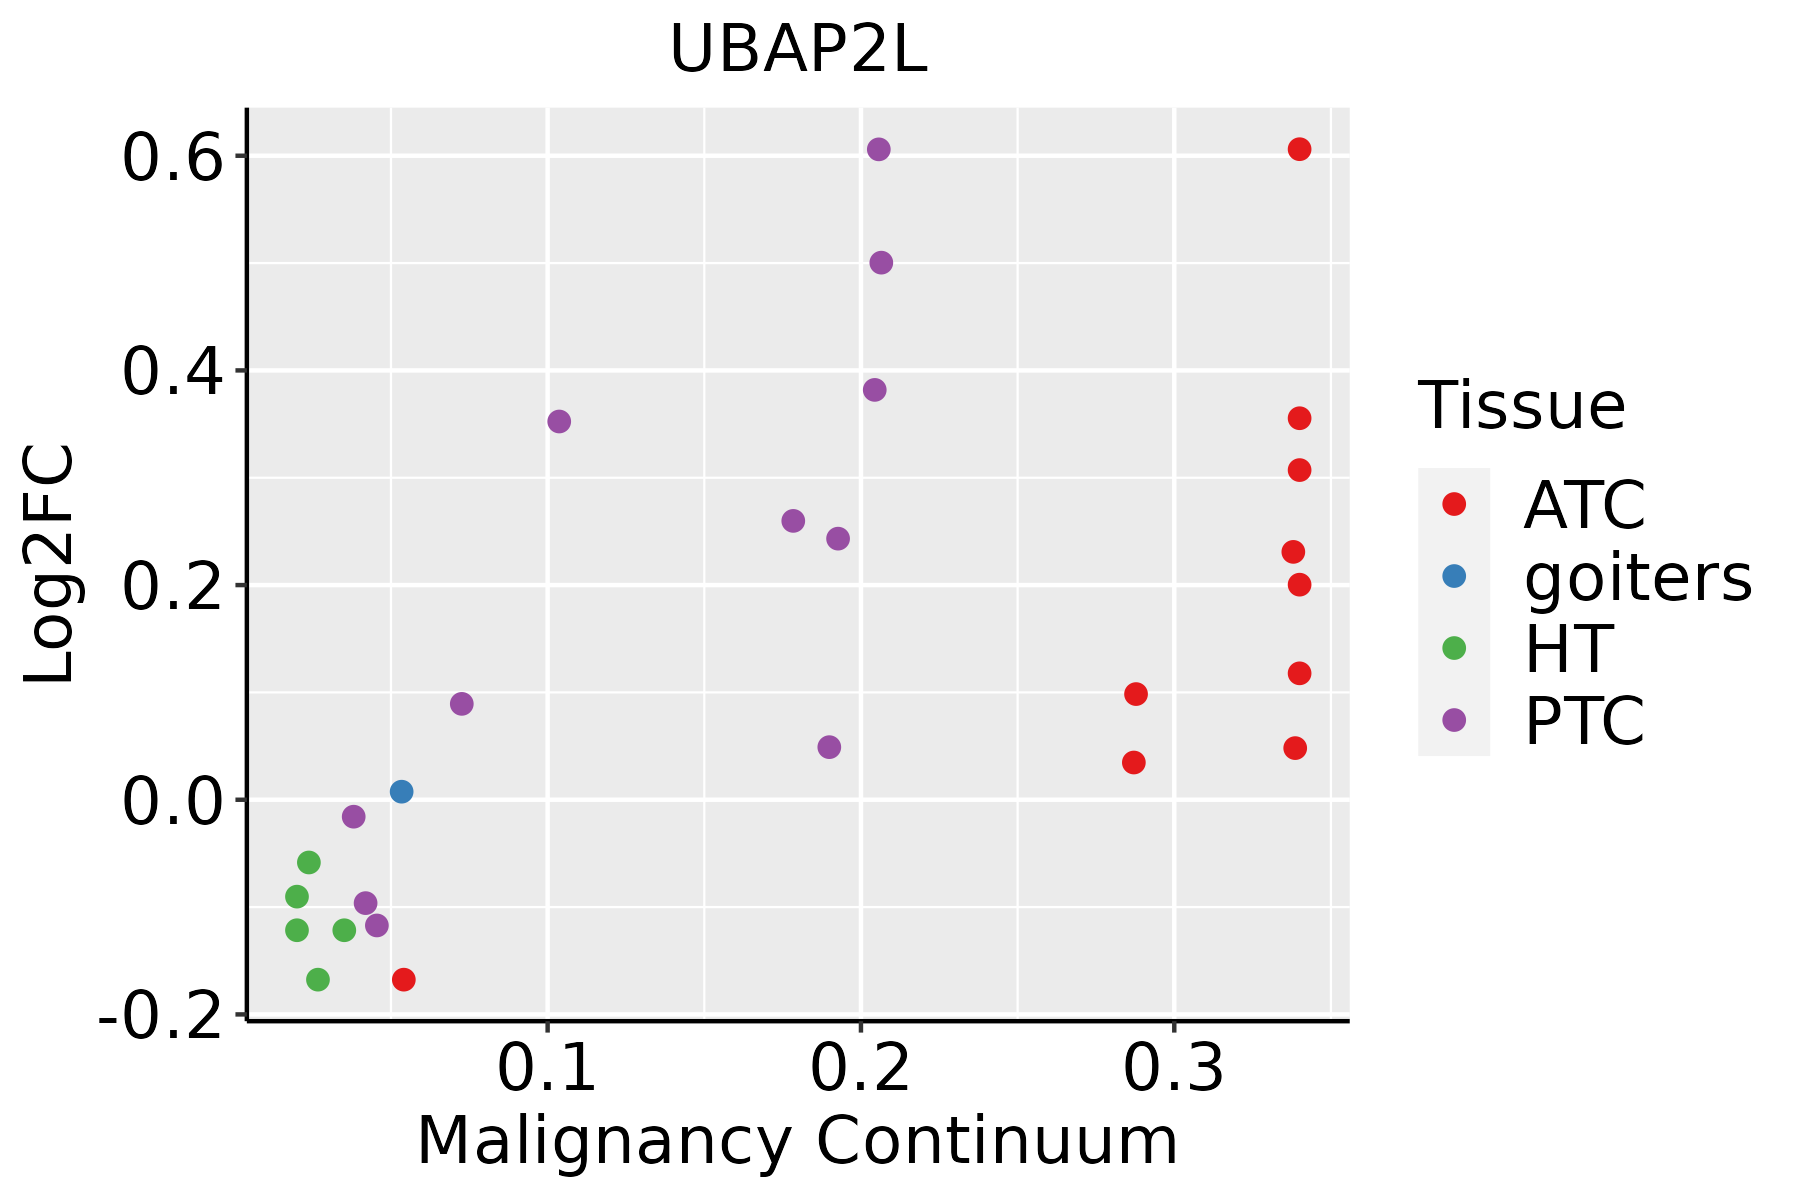 | ATC: Anaplastic thyroid cancer |
| HT: Hashimoto's thyroiditis | ||
| PTC: Papillary thyroid cancer |
| ∗log2FC in expression of this searched gene in stem-like cells from each diseased tissue sample relative to stem-like cells in normal samples in each tissue plotted against the malignancy continuum. Samples are colored based on if they are from different disease stage. |
Top |
Malignant transformation related pathway analysis |
| Find out the enriched GO biological processes and KEGG pathways involved in transition from healthy to precancer to cancer |
| Tissue | Disease Stage | Enriched GO biological Processes |
| Colorectum | AD |  |
| Colorectum | SER |  |
| Colorectum | MSS |  |
| Colorectum | MSI-H |  |
| Colorectum | FAP |  |
| ∗Top 15 enriched GO BP terms are showed in the bar plot of each disease state in each tissue. Each row represents a significant GO biological process which is colored according to the -log10(p.adjust). |
| Page: 1 2 3 4 5 6 7 8 9 |
| GO ID | Tissue | Disease Stage | Description | Gene Ratio | Bg Ratio | pvalue | p.adjust | Count |
| GO:0048872111 | Esophagus | ESCC | homeostasis of number of cells | 163/8552 | 272/18723 | 1.40e-06 | 1.69e-05 | 163 |
| GO:003406315 | Esophagus | ESCC | stress granule assembly | 23/8552 | 26/18723 | 6.82e-06 | 6.90e-05 | 23 |
| GO:00340633 | Liver | NAFLD | stress granule assembly | 9/1882 | 26/18723 | 6.56e-04 | 8.50e-03 | 9 |
| GO:00488727 | Liver | NAFLD | homeostasis of number of cells | 43/1882 | 272/18723 | 1.86e-03 | 1.91e-02 | 43 |
| GO:00340632 | Liver | HCC | stress granule assembly | 24/7958 | 26/18723 | 1.35e-07 | 2.57e-06 | 24 |
| GO:004887222 | Liver | HCC | homeostasis of number of cells | 147/7958 | 272/18723 | 7.48e-05 | 6.70e-04 | 147 |
| GO:004887220 | Oral cavity | OSCC | homeostasis of number of cells | 152/7305 | 272/18723 | 1.08e-08 | 2.23e-07 | 152 |
| GO:00340637 | Oral cavity | OSCC | stress granule assembly | 21/7305 | 26/18723 | 1.66e-05 | 1.64e-04 | 21 |
| GO:003406314 | Oral cavity | LP | stress granule assembly | 14/4623 | 26/18723 | 1.33e-03 | 1.07e-02 | 14 |
| GO:0048872110 | Oral cavity | LP | homeostasis of number of cells | 87/4623 | 272/18723 | 3.75e-03 | 2.47e-02 | 87 |
| GO:004887218 | Prostate | BPH | homeostasis of number of cells | 79/3107 | 272/18723 | 1.79e-07 | 3.99e-06 | 79 |
| GO:00340636 | Prostate | BPH | stress granule assembly | 15/3107 | 26/18723 | 2.37e-06 | 3.83e-05 | 15 |
| GO:004887219 | Prostate | Tumor | homeostasis of number of cells | 86/3246 | 272/18723 | 5.29e-09 | 2.11e-07 | 86 |
| GO:003406313 | Prostate | Tumor | stress granule assembly | 15/3246 | 26/18723 | 4.17e-06 | 6.64e-05 | 15 |
| GO:004887229 | Skin | cSCC | homeostasis of number of cells | 104/4864 | 272/18723 | 5.34e-06 | 7.71e-05 | 104 |
| GO:003406316 | Skin | cSCC | stress granule assembly | 17/4864 | 26/18723 | 2.77e-05 | 3.11e-04 | 17 |
| GO:003406317 | Thyroid | PTC | stress granule assembly | 21/5968 | 26/18723 | 3.95e-07 | 6.55e-06 | 21 |
| GO:0048872113 | Thyroid | PTC | homeostasis of number of cells | 125/5968 | 272/18723 | 7.25e-07 | 1.14e-05 | 125 |
| GO:00614841 | Thyroid | PTC | hematopoietic stem cell homeostasis | 11/5968 | 18/18723 | 1.00e-02 | 4.07e-02 | 11 |
| GO:0048872210 | Thyroid | ATC | homeostasis of number of cells | 135/6293 | 272/18723 | 2.92e-08 | 5.50e-07 | 135 |
| Page: 1 2 |
| Pathway ID | Tissue | Disease Stage | Description | Gene Ratio | Bg Ratio | pvalue | p.adjust | qvalue | Count |
| Page: 1 |
Top |
Cell-cell communication analysis |
| Identification of potential cell-cell interactions between two cell types and their ligand-receptor pairs for different disease states |
| Ligand | Receptor | LRpair | Pathway | Tissue | Disease Stage |
| Page: 1 |
Top |
Single-cell gene regulatory network inference analysis |
| Find out the significant the regulons (TFs) and the target genes of each regulon across cell types for different disease states |
| TF | Cell Type | Tissue | Disease Stage | Target Gene | RSS | Regulon Activity |
| ∗The dot plots of a searched regulon are shown for all cell subpopulations in each disease state of each tissue based on the regulon specific score inferred using pySCENIC and by calculating the average expression. |
| Page: 1 |
Top |
Somatic mutation of malignant transformation related genes |
| Annotation of somatic variants for genes involved in malignant transformation |
| Hugo Symbol | Variant Class | Variant Classification | dbSNP RS | HGVSc | HGVSp | HGVSp Short | SWISSPROT | BIOTYPE | SIFT | PolyPhen | Tumor Sample Barcode | Tissue | Histology | Sex | Age | Stage | Therapy Types | Drugs | Outcome |
| UBAP2L | SNV | Missense_Mutation | c.1820C>G | p.Ser607Cys | p.S607C | Q14157 | protein_coding | deleterious(0) | probably_damaging(0.971) | TCGA-AC-A23H-01 | Breast | breast invasive carcinoma | Female | >=65 | I/II | Unknown | Unknown | PD | |
| UBAP2L | SNV | Missense_Mutation | c.2037G>C | p.Leu679Phe | p.L679F | Q14157 | protein_coding | deleterious(0.02) | benign(0.084) | TCGA-AC-A23H-01 | Breast | breast invasive carcinoma | Female | >=65 | I/II | Unknown | Unknown | PD | |
| UBAP2L | SNV | Missense_Mutation | c.2999C>T | p.Ser1000Phe | p.S1000F | Q14157 | protein_coding | deleterious(0) | possibly_damaging(0.74) | TCGA-D8-A1J9-01 | Breast | breast invasive carcinoma | Female | <65 | I/II | Unknown | Unknown | SD | |
| UBAP2L | insertion | In_Frame_Ins | novel | c.2872_2873insCTT | p.Ser958delinsThrCys | p.S958delinsTC | Q14157 | protein_coding | TCGA-B6-A0IN-01 | Breast | breast invasive carcinoma | Female | <65 | I/II | Unknown | Unknown | PD | ||
| UBAP2L | insertion | Frame_Shift_Ins | novel | c.2873_2874insCAGATGCTTCAGACAAGATTTCCAT | p.Gly959ArgfsTer25 | p.G959Rfs*25 | Q14157 | protein_coding | TCGA-B6-A0IN-01 | Breast | breast invasive carcinoma | Female | <65 | I/II | Unknown | Unknown | PD | ||
| UBAP2L | SNV | Missense_Mutation | c.1053A>C | p.Glu351Asp | p.E351D | Q14157 | protein_coding | tolerated(0.48) | benign(0.003) | TCGA-FU-A3HZ-01 | Cervix | cervical & endocervical cancer | Female | <65 | I/II | Chemotherapy | cisplatin | CR | |
| UBAP2L | SNV | Missense_Mutation | c.256N>T | p.Leu86Phe | p.L86F | Q14157 | protein_coding | deleterious(0) | probably_damaging(0.986) | TCGA-IR-A3L7-01 | Cervix | cervical & endocervical cancer | Female | <65 | I/II | Chemotherapy | cisplatin | CR | |
| UBAP2L | SNV | Missense_Mutation | c.1823N>T | p.Ser608Leu | p.S608L | Q14157 | protein_coding | tolerated(0.11) | possibly_damaging(0.879) | TCGA-IR-A3LI-01 | Cervix | cervical & endocervical cancer | Female | <65 | I/II | Chemotherapy | cisplatin | CR | |
| UBAP2L | SNV | Missense_Mutation | c.3131N>T | p.Ser1044Phe | p.S1044F | Q14157 | protein_coding | deleterious(0) | probably_damaging(0.997) | TCGA-IR-A3LI-01 | Cervix | cervical & endocervical cancer | Female | <65 | I/II | Chemotherapy | cisplatin | CR | |
| UBAP2L | SNV | Missense_Mutation | c.1478N>T | p.Ser493Phe | p.S493F | Q14157 | protein_coding | deleterious(0) | probably_damaging(0.986) | TCGA-JW-A5VJ-01 | Cervix | cervical & endocervical cancer | Female | <65 | I/II | Unknown | Unknown | PD |
| Page: 1 2 3 4 5 6 7 8 9 |
Top |
Related drugs of malignant transformation related genes |
| Identification of chemicals and drugs interact with genes involved in malignant transfromation |
| (DGIdb 4.0) |
| Entrez ID | Symbol | Category | Interaction Types | Drug Claim Name | Drug Name | PMIDs |
| Page: 1 |

Copyright 2023-Present -The University of Texas Health Science Center at Houston |