
|
|||||
|
 | |
| |
| |
| |
| |
| |
|
Gene: TUBGCP2 |
Gene summary for TUBGCP2 |
| Gene information | Species | Human | Gene symbol | TUBGCP2 | Gene ID | 10844 |
| Gene name | tubulin gamma complex associated protein 2 | |
| Gene Alias | ALP4 | |
| Cytomap | 10q26.3 | |
| Gene Type | protein-coding | GO ID | GO:0000003 | UniProtAcc | Q9BSJ2 |
Top |
Malignant transformation analysis |
| Identification of the aberrant gene expression in precancerous and cancerous lesions by comparing the gene expression of stem-like cells in diseased tissues with normal stem cells |
| Entrez ID | Symbol | Replicates | Species | Organ | Tissue | Adj P-value | Log2FC | Malignancy |
| 10844 | TUBGCP2 | P26T-E | Human | Esophagus | ESCC | 4.69e-40 | 6.82e-01 | 0.1276 |
| 10844 | TUBGCP2 | P27T-E | Human | Esophagus | ESCC | 2.73e-55 | 9.04e-01 | 0.1055 |
| 10844 | TUBGCP2 | P28T-E | Human | Esophagus | ESCC | 1.16e-28 | 5.49e-01 | 0.1149 |
| 10844 | TUBGCP2 | P30T-E | Human | Esophagus | ESCC | 3.23e-19 | 8.23e-01 | 0.137 |
| 10844 | TUBGCP2 | P31T-E | Human | Esophagus | ESCC | 3.47e-26 | 4.52e-01 | 0.1251 |
| 10844 | TUBGCP2 | P32T-E | Human | Esophagus | ESCC | 1.28e-43 | 8.41e-01 | 0.1666 |
| 10844 | TUBGCP2 | P36T-E | Human | Esophagus | ESCC | 3.67e-23 | 6.21e-01 | 0.1187 |
| 10844 | TUBGCP2 | P37T-E | Human | Esophagus | ESCC | 2.08e-25 | 5.45e-01 | 0.1371 |
| 10844 | TUBGCP2 | P38T-E | Human | Esophagus | ESCC | 1.01e-07 | 3.34e-01 | 0.127 |
| 10844 | TUBGCP2 | P39T-E | Human | Esophagus | ESCC | 7.31e-16 | 3.37e-01 | 0.0894 |
| 10844 | TUBGCP2 | P40T-E | Human | Esophagus | ESCC | 1.82e-15 | 4.73e-01 | 0.109 |
| 10844 | TUBGCP2 | P42T-E | Human | Esophagus | ESCC | 9.33e-21 | 5.17e-01 | 0.1175 |
| 10844 | TUBGCP2 | P44T-E | Human | Esophagus | ESCC | 1.91e-09 | 3.50e-01 | 0.1096 |
| 10844 | TUBGCP2 | P47T-E | Human | Esophagus | ESCC | 1.51e-21 | 3.43e-01 | 0.1067 |
| 10844 | TUBGCP2 | P48T-E | Human | Esophagus | ESCC | 2.41e-20 | 3.86e-01 | 0.0959 |
| 10844 | TUBGCP2 | P49T-E | Human | Esophagus | ESCC | 1.43e-08 | 9.30e-01 | 0.1768 |
| 10844 | TUBGCP2 | P52T-E | Human | Esophagus | ESCC | 2.25e-33 | 6.38e-01 | 0.1555 |
| 10844 | TUBGCP2 | P54T-E | Human | Esophagus | ESCC | 5.49e-24 | 5.91e-01 | 0.0975 |
| 10844 | TUBGCP2 | P56T-E | Human | Esophagus | ESCC | 1.16e-08 | 1.29e+00 | 0.1613 |
| 10844 | TUBGCP2 | P57T-E | Human | Esophagus | ESCC | 2.75e-23 | 3.97e-01 | 0.0926 |
| Page: 1 2 3 4 5 6 7 |
| Tissue | Expression Dynamics | Abbreviation |
| Colorectum (GSE201348) | 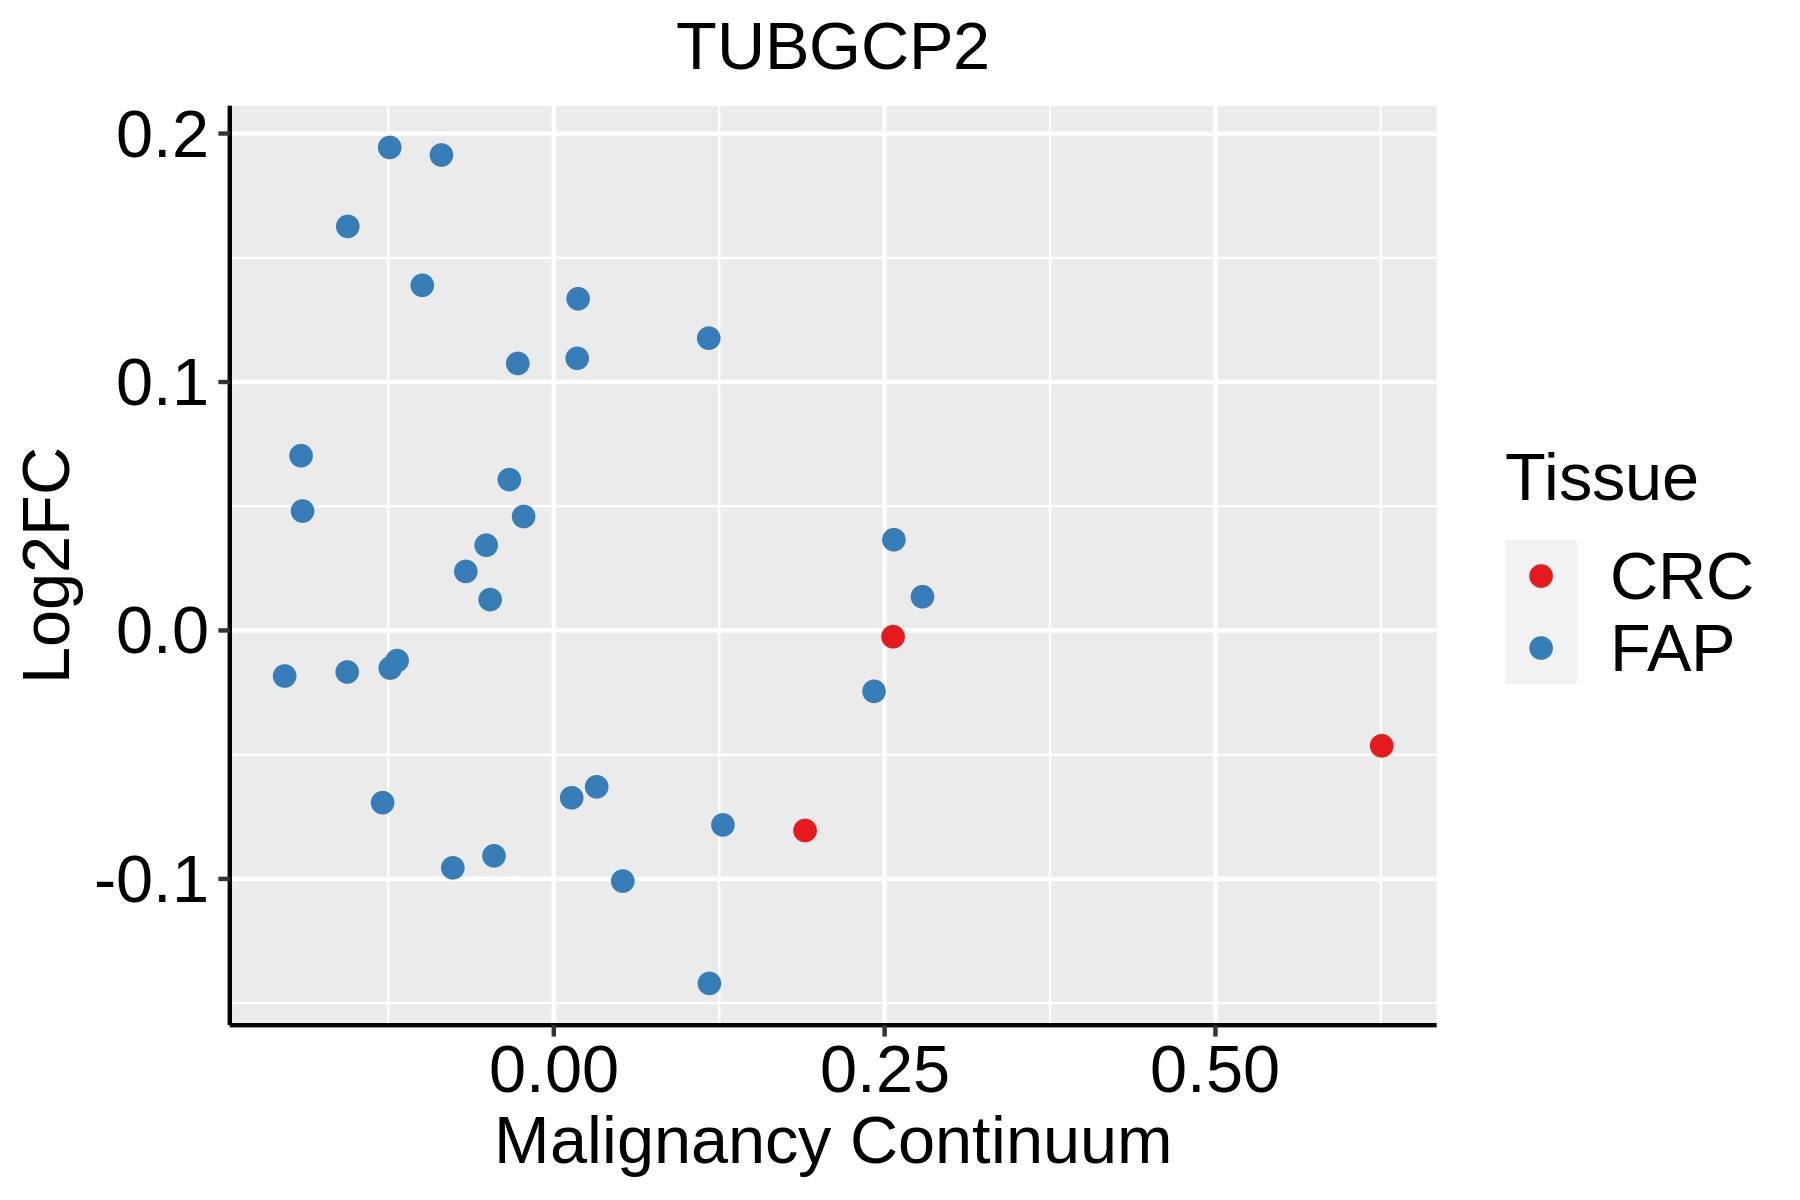 | FAP: Familial adenomatous polyposis |
| CRC: Colorectal cancer | ||
| Colorectum (HTA11) |  | AD: Adenomas |
| SER: Sessile serrated lesions | ||
| MSI-H: Microsatellite-high colorectal cancer | ||
| MSS: Microsatellite stable colorectal cancer | ||
| Esophagus | 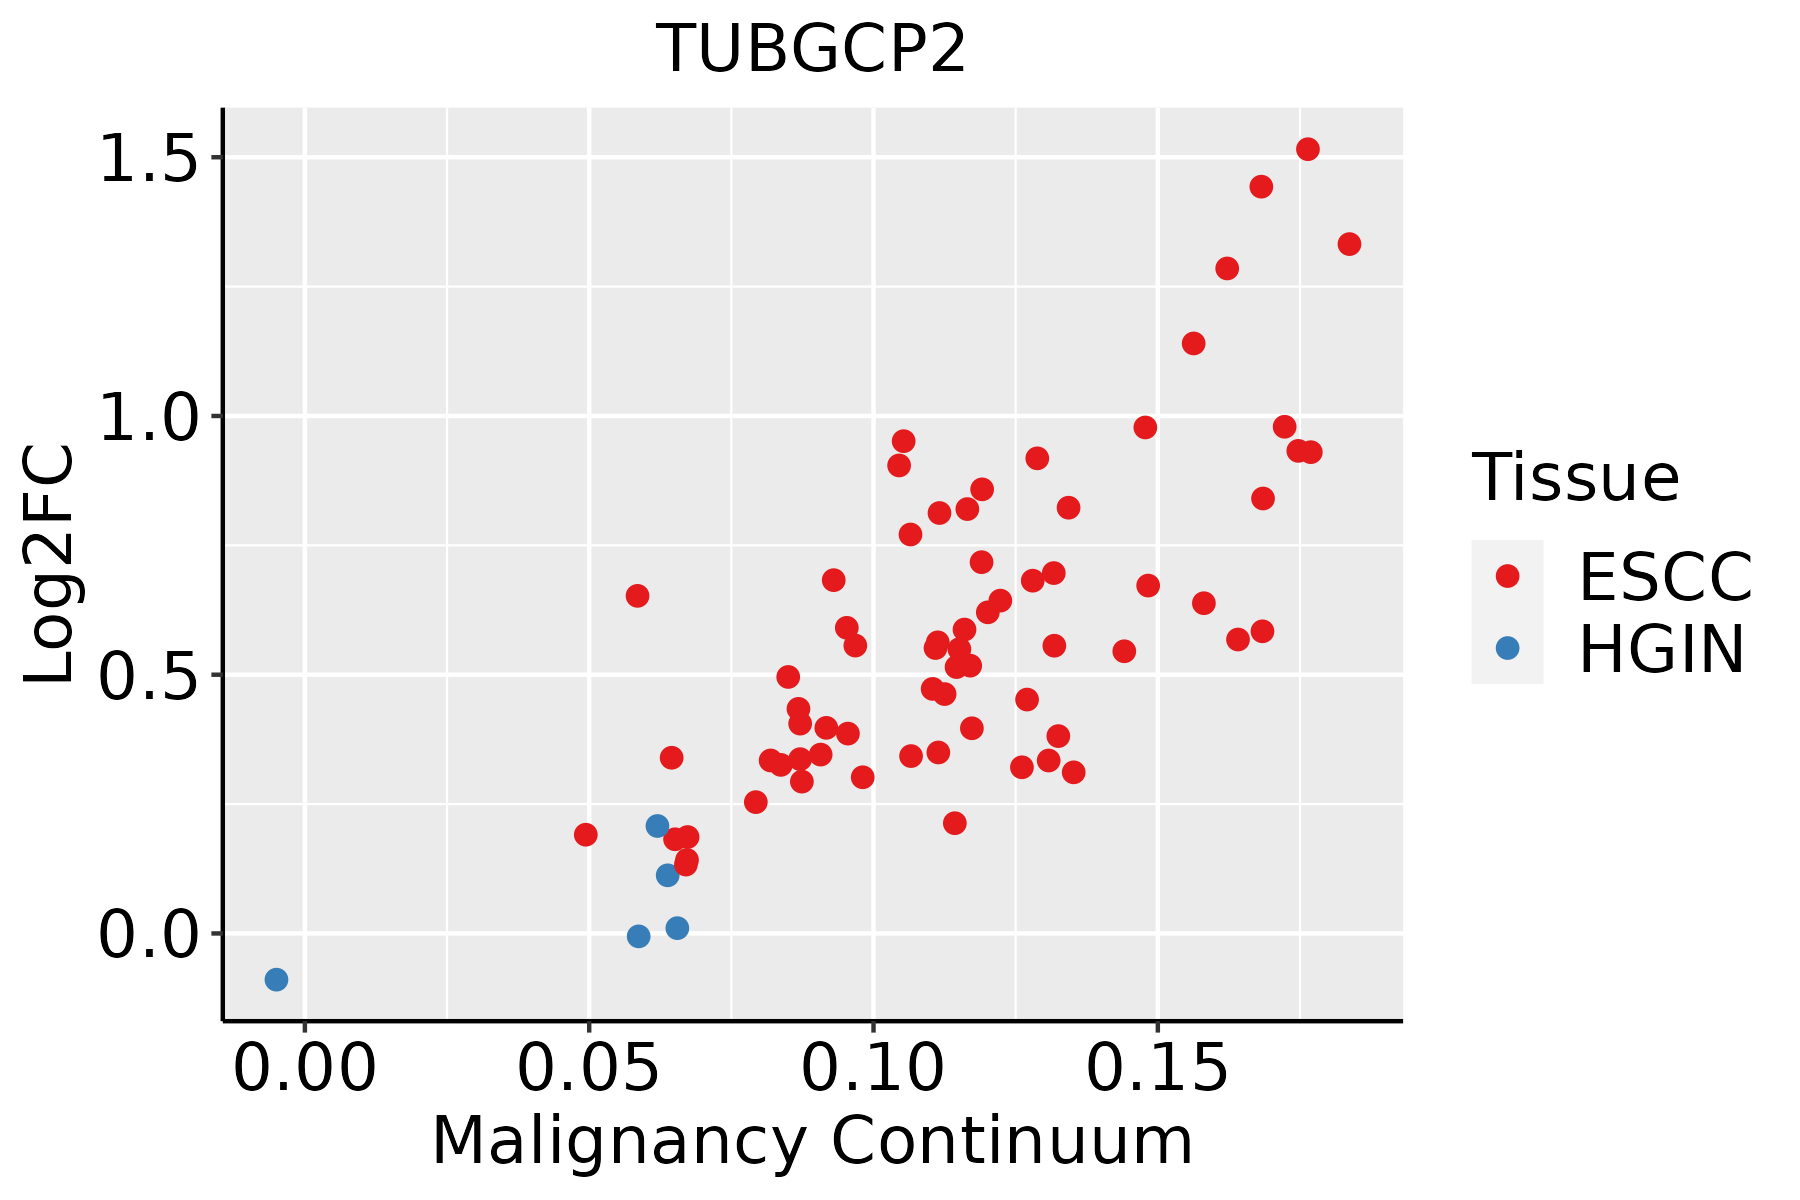 | ESCC: Esophageal squamous cell carcinoma |
| HGIN: High-grade intraepithelial neoplasias | ||
| LGIN: Low-grade intraepithelial neoplasias | ||
| Liver | 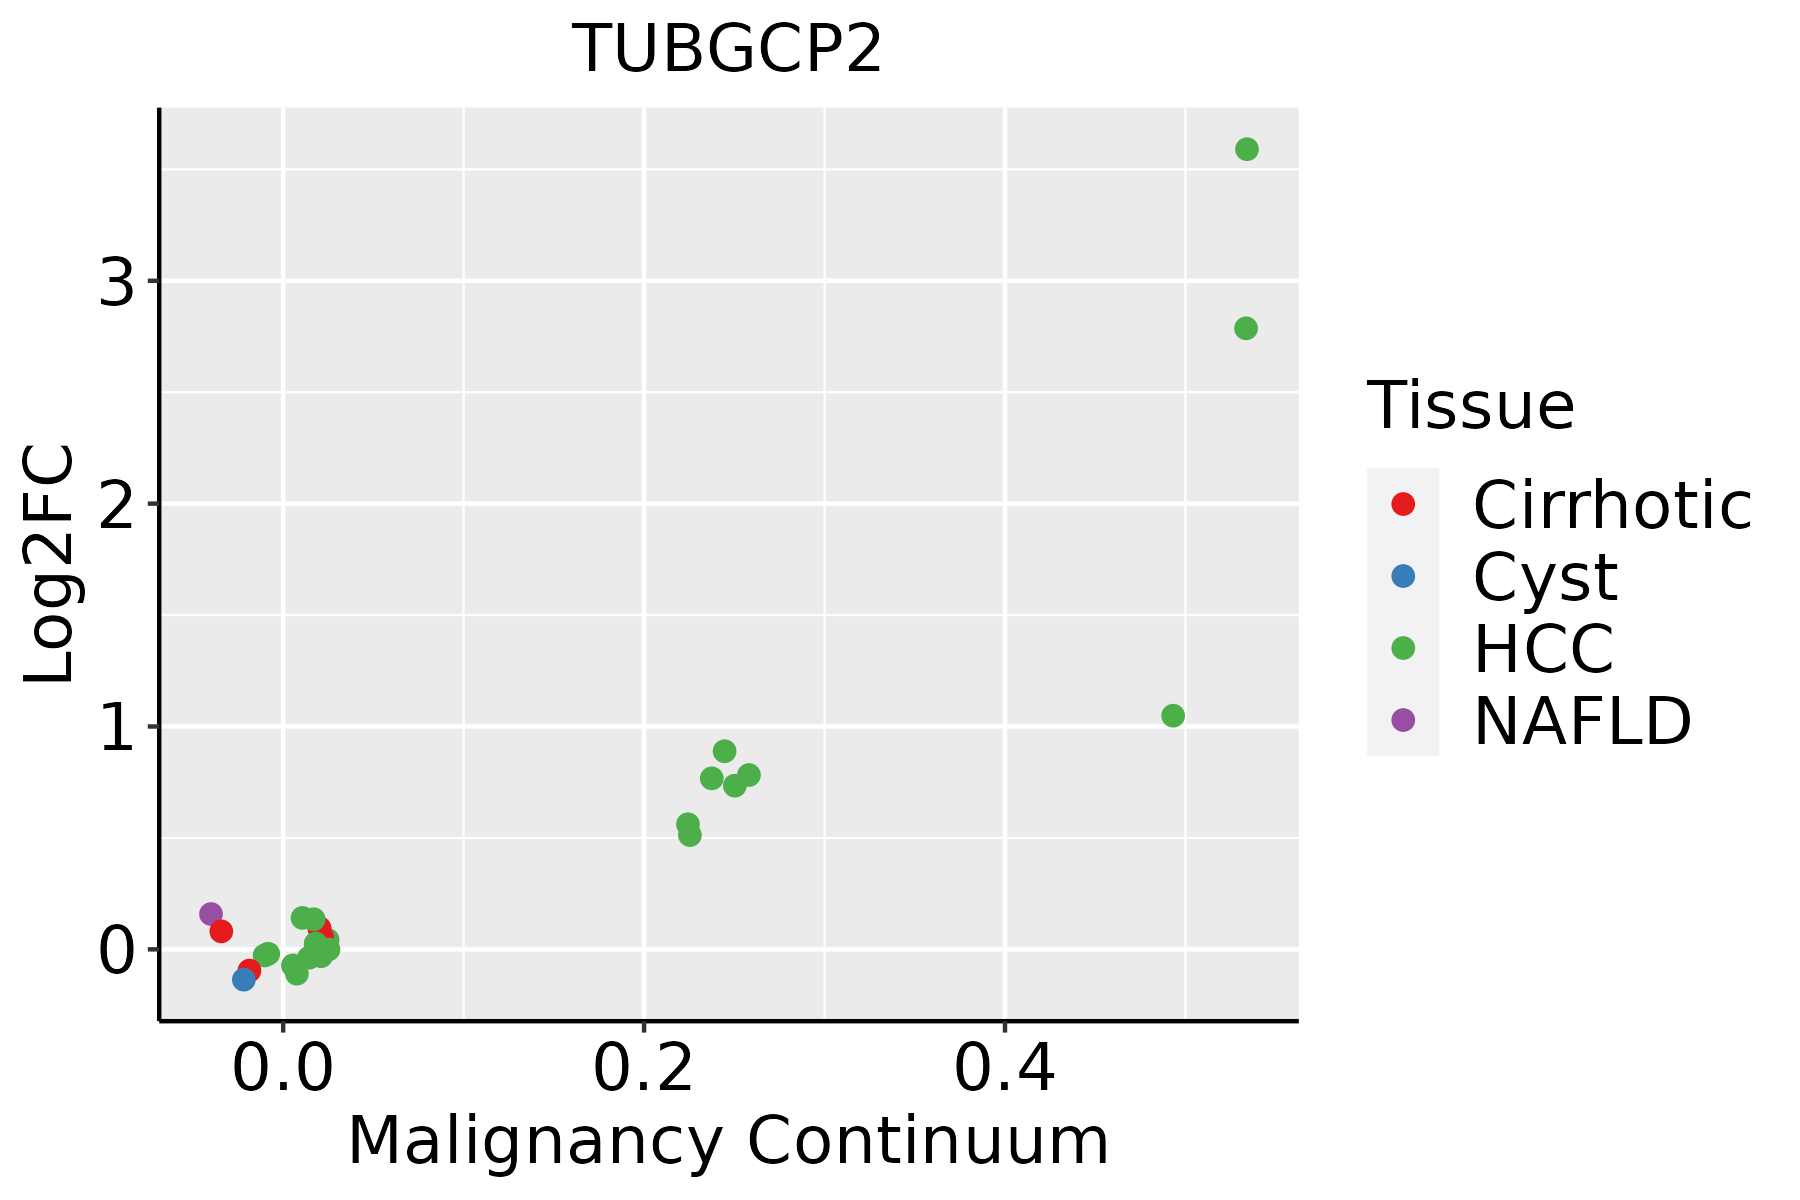 | HCC: Hepatocellular carcinoma |
| NAFLD: Non-alcoholic fatty liver disease | ||
| Oral Cavity | 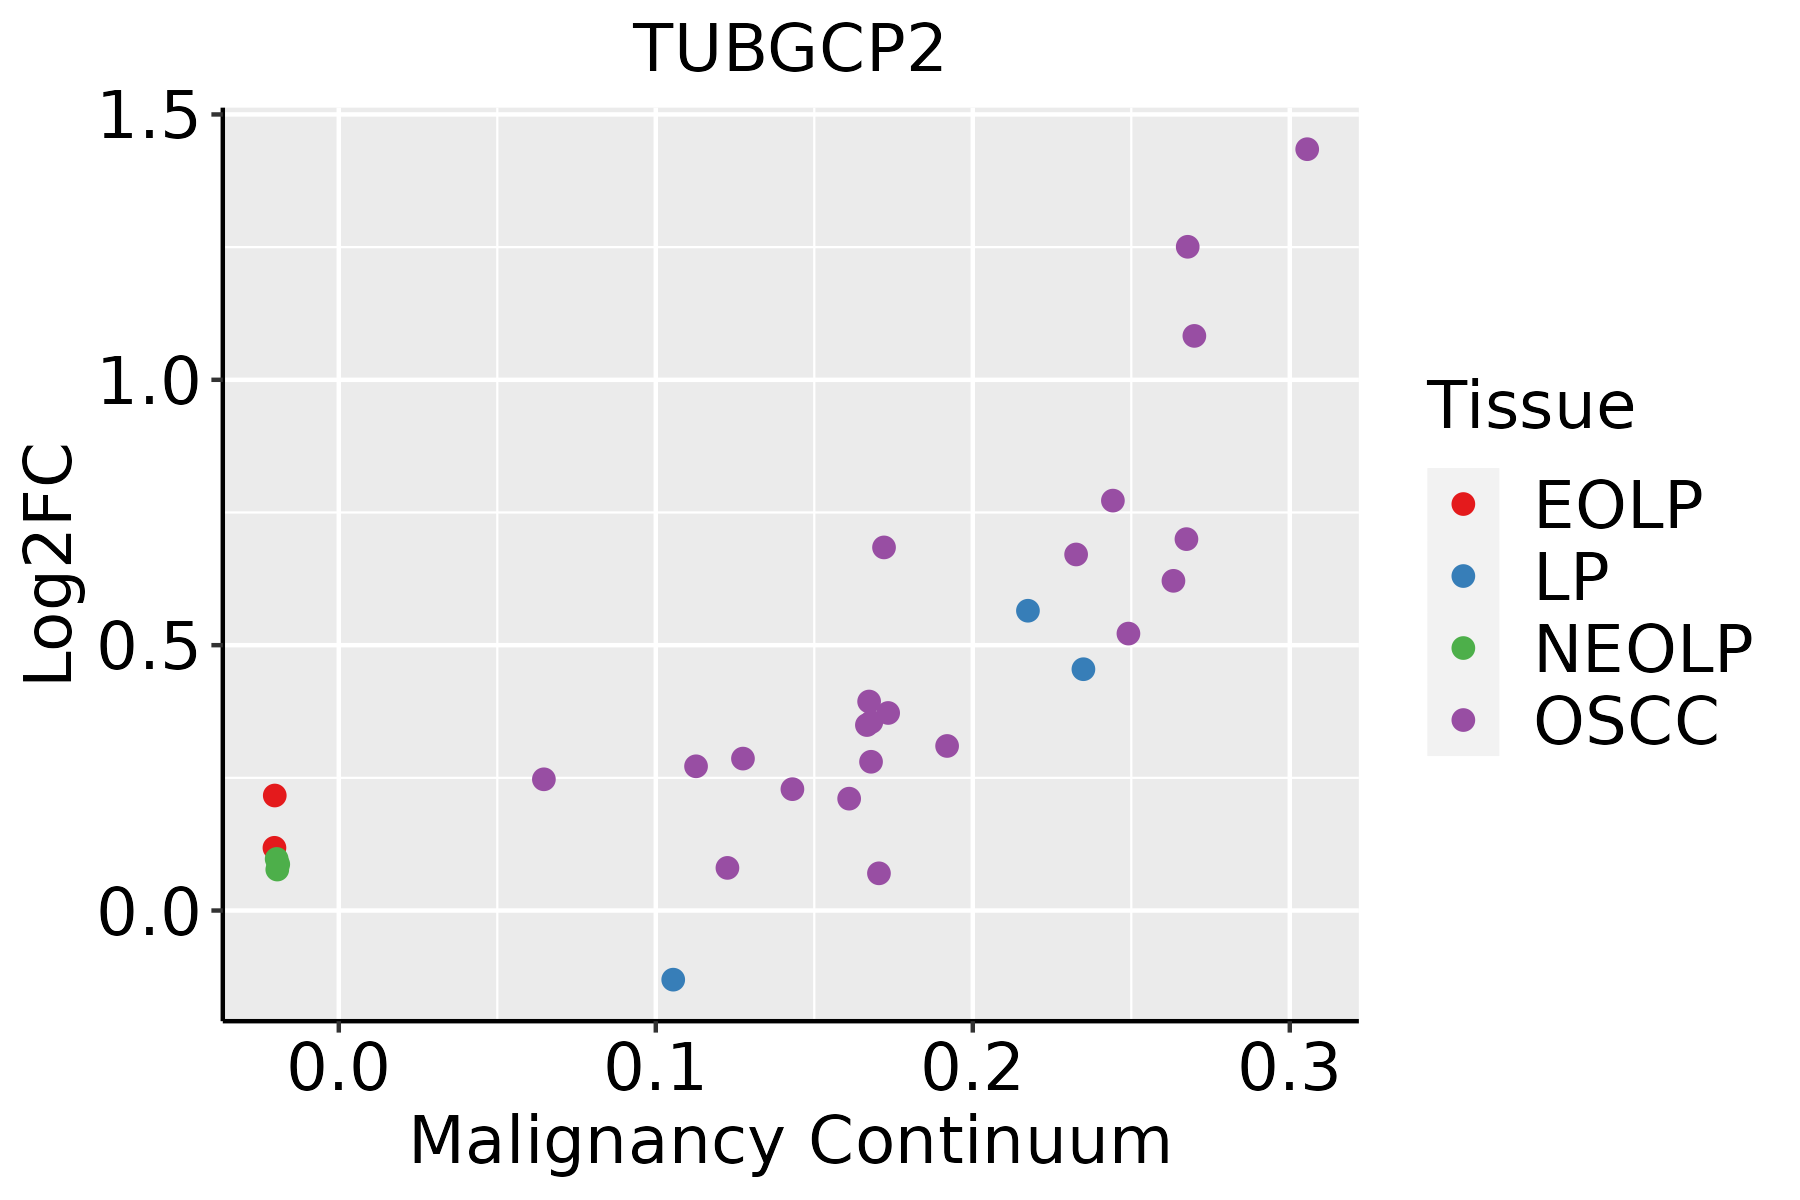 | EOLP: Erosive Oral lichen planus |
| LP: leukoplakia | ||
| NEOLP: Non-erosive oral lichen planus | ||
| OSCC: Oral squamous cell carcinoma | ||
| Skin | 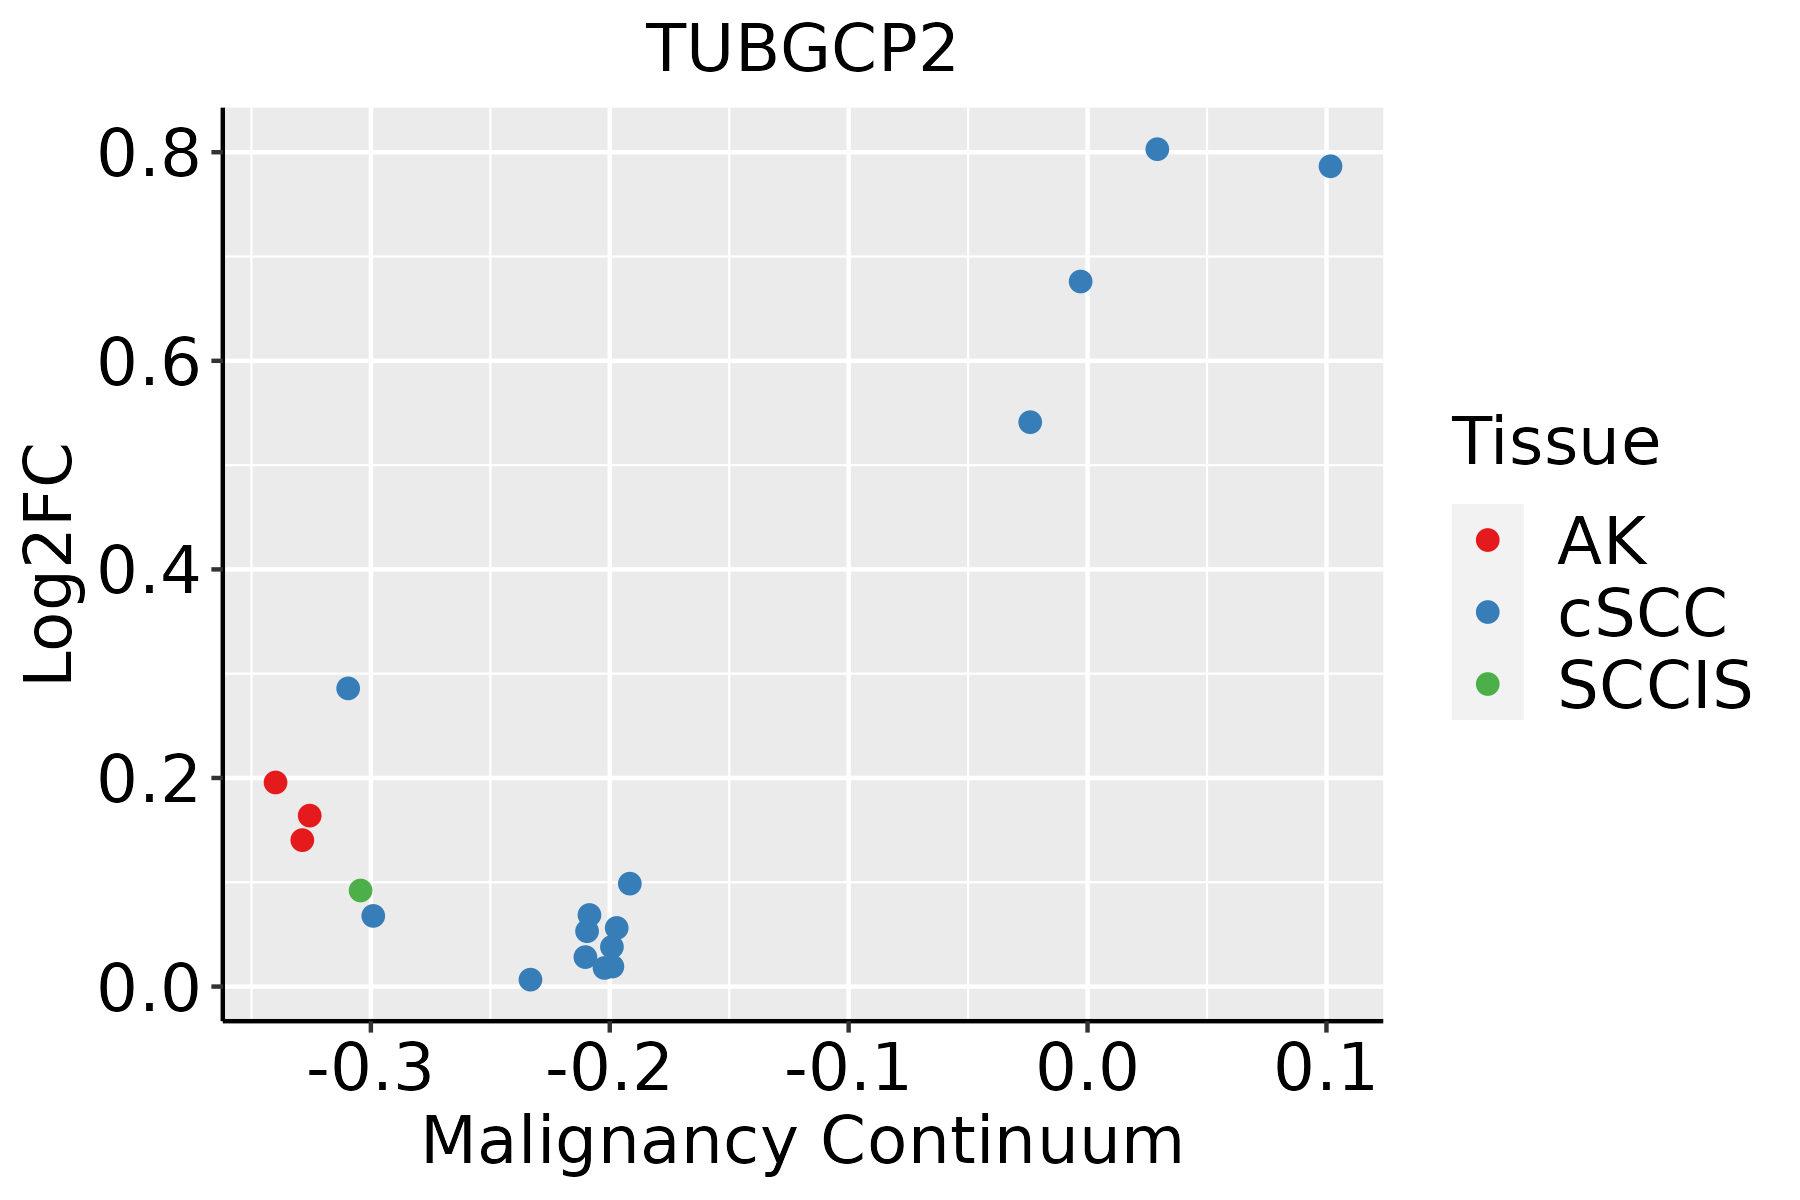 | AK: Actinic keratosis |
| cSCC: Cutaneous squamous cell carcinoma | ||
| SCCIS:squamous cell carcinoma in situ | ||
| Thyroid |  | ATC: Anaplastic thyroid cancer |
| HT: Hashimoto's thyroiditis | ||
| PTC: Papillary thyroid cancer |
| ∗log2FC in expression of this searched gene in stem-like cells from each diseased tissue sample relative to stem-like cells in normal samples in each tissue plotted against the malignancy continuum. Samples are colored based on if they are from different disease stage. |
Top |
Malignant transformation related pathway analysis |
| Find out the enriched GO biological processes and KEGG pathways involved in transition from healthy to precancer to cancer |
| Tissue | Disease Stage | Enriched GO biological Processes |
| Colorectum | AD |  |
| Colorectum | SER |  |
| Colorectum | MSS |  |
| Colorectum | MSI-H |  |
| Colorectum | FAP |  |
| ∗Top 15 enriched GO BP terms are showed in the bar plot of each disease state in each tissue. Each row represents a significant GO biological process which is colored according to the -log10(p.adjust). |
| Page: 1 2 3 4 5 6 7 8 9 |
| GO ID | Tissue | Disease Stage | Description | Gene Ratio | Bg Ratio | pvalue | p.adjust | Count |
| GO:0051258 | Colorectum | AD | protein polymerization | 112/3918 | 297/18723 | 1.85e-11 | 2.27e-09 | 112 |
| GO:0007051 | Colorectum | AD | spindle organization | 58/3918 | 184/18723 | 4.71e-04 | 5.20e-03 | 58 |
| GO:0051225 | Colorectum | AD | spindle assembly | 37/3918 | 117/18723 | 4.32e-03 | 2.96e-02 | 37 |
| GO:00512581 | Colorectum | SER | protein polymerization | 91/2897 | 297/18723 | 2.72e-11 | 5.06e-09 | 91 |
| GO:00512582 | Colorectum | MSS | protein polymerization | 97/3467 | 297/18723 | 2.98e-09 | 2.07e-07 | 97 |
| GO:00070511 | Colorectum | MSS | spindle organization | 53/3467 | 184/18723 | 4.23e-04 | 5.19e-03 | 53 |
| GO:00512251 | Colorectum | MSS | spindle assembly | 33/3467 | 117/18723 | 6.68e-03 | 4.38e-02 | 33 |
| GO:00512584 | Colorectum | FAP | protein polymerization | 73/2622 | 297/18723 | 7.11e-07 | 3.32e-05 | 73 |
| GO:0031122 | Colorectum | FAP | cytoplasmic microtubule organization | 17/2622 | 56/18723 | 1.24e-03 | 1.16e-02 | 17 |
| GO:00070512 | Colorectum | FAP | spindle organization | 41/2622 | 184/18723 | 1.50e-03 | 1.34e-02 | 41 |
| GO:000705114 | Esophagus | ESCC | spindle organization | 134/8552 | 184/18723 | 5.70e-14 | 2.87e-12 | 134 |
| GO:00512256 | Esophagus | ESCC | spindle assembly | 85/8552 | 117/18723 | 2.72e-09 | 5.98e-08 | 85 |
| GO:0051258111 | Esophagus | ESCC | protein polymerization | 183/8552 | 297/18723 | 1.94e-08 | 3.75e-07 | 183 |
| GO:00311094 | Esophagus | ESCC | microtubule polymerization or depolymerization | 77/8552 | 122/18723 | 7.60e-05 | 5.68e-04 | 77 |
| GO:00467856 | Esophagus | ESCC | microtubule polymerization | 55/8552 | 83/18723 | 1.21e-04 | 8.31e-04 | 55 |
| GO:00070205 | Esophagus | ESCC | microtubule nucleation | 27/8552 | 35/18723 | 1.48e-04 | 9.88e-04 | 27 |
| GO:00311227 | Esophagus | ESCC | cytoplasmic microtubule organization | 38/8552 | 56/18723 | 6.60e-04 | 3.50e-03 | 38 |
| GO:005125812 | Liver | Cirrhotic | protein polymerization | 116/4634 | 297/18723 | 2.87e-08 | 9.78e-07 | 116 |
| GO:00070514 | Liver | Cirrhotic | spindle organization | 62/4634 | 184/18723 | 3.88e-03 | 2.10e-02 | 62 |
| GO:00512252 | Liver | Cirrhotic | spindle assembly | 41/4634 | 117/18723 | 8.08e-03 | 3.79e-02 | 41 |
| Page: 1 2 3 4 |
| Pathway ID | Tissue | Disease Stage | Description | Gene Ratio | Bg Ratio | pvalue | p.adjust | qvalue | Count |
| Page: 1 |
Top |
Cell-cell communication analysis |
| Identification of potential cell-cell interactions between two cell types and their ligand-receptor pairs for different disease states |
| Ligand | Receptor | LRpair | Pathway | Tissue | Disease Stage |
| Page: 1 |
Top |
Single-cell gene regulatory network inference analysis |
| Find out the significant the regulons (TFs) and the target genes of each regulon across cell types for different disease states |
| TF | Cell Type | Tissue | Disease Stage | Target Gene | RSS | Regulon Activity |
| ∗The dot plots of a searched regulon are shown for all cell subpopulations in each disease state of each tissue based on the regulon specific score inferred using pySCENIC and by calculating the average expression. |
| Page: 1 |
Top |
Somatic mutation of malignant transformation related genes |
| Annotation of somatic variants for genes involved in malignant transformation |
| Hugo Symbol | Variant Class | Variant Classification | dbSNP RS | HGVSc | HGVSp | HGVSp Short | SWISSPROT | BIOTYPE | SIFT | PolyPhen | Tumor Sample Barcode | Tissue | Histology | Sex | Age | Stage | Therapy Types | Drugs | Outcome |
| TUBGCP2 | SNV | Missense_Mutation | c.223N>G | p.Thr75Ala | p.T75A | Q9BSJ2 | protein_coding | tolerated(0.3) | benign(0.001) | TCGA-A2-A04R-01 | Breast | breast invasive carcinoma | Female | <65 | I/II | Chemotherapy | taxol | SD | |
| TUBGCP2 | SNV | Missense_Mutation | novel | c.1927G>T | p.Ala643Ser | p.A643S | Q9BSJ2 | protein_coding | tolerated(0.32) | benign(0.06) | TCGA-A2-A25C-01 | Breast | breast invasive carcinoma | Female | <65 | I/II | Chemotherapy | taxotere | SD |
| TUBGCP2 | SNV | Missense_Mutation | rs765603563 | c.2138N>A | p.Arg713Gln | p.R713Q | Q9BSJ2 | protein_coding | deleterious(0) | probably_damaging(0.965) | TCGA-AN-A046-01 | Breast | breast invasive carcinoma | Female | >=65 | I/II | Unknown | Unknown | SD |
| TUBGCP2 | SNV | Missense_Mutation | c.263N>A | p.Leu88His | p.L88H | Q9BSJ2 | protein_coding | deleterious(0) | probably_damaging(0.991) | TCGA-BH-A0GY-01 | Breast | breast invasive carcinoma | Female | >=65 | I/II | Chemotherapy | cyotxan | SD | |
| TUBGCP2 | SNV | Missense_Mutation | c.1896C>A | p.Asp632Glu | p.D632E | Q9BSJ2 | protein_coding | tolerated(0.13) | benign(0.009) | TCGA-BH-A0RX-01 | Breast | breast invasive carcinoma | Female | <65 | I/II | Chemotherapy | fluorouracil | SD | |
| TUBGCP2 | SNV | Missense_Mutation | rs755715439 | c.2355G>A | p.Met785Ile | p.M785I | Q9BSJ2 | protein_coding | tolerated(0.12) | benign(0.009) | TCGA-D8-A1J8-01 | Breast | breast invasive carcinoma | Female | >=65 | I/II | Hormone Therapy | nolvadex | SD |
| TUBGCP2 | SNV | Missense_Mutation | c.1015N>C | p.Glu339Gln | p.E339Q | Q9BSJ2 | protein_coding | deleterious(0.05) | probably_damaging(0.976) | TCGA-EW-A1J5-01 | Breast | breast invasive carcinoma | Female | <65 | I/II | Chemotherapy | adriamycin | SD | |
| TUBGCP2 | SNV | Missense_Mutation | novel | c.329N>G | p.Ala110Gly | p.A110G | Q9BSJ2 | protein_coding | tolerated(0.31) | benign(0.009) | TCGA-S3-AA12-01 | Breast | breast invasive carcinoma | Female | >=65 | III/IV | Hormone Therapy | anastrozole | SD |
| TUBGCP2 | deletion | Frame_Shift_Del | novel | c.1101delC | p.Ser368ProfsTer17 | p.S368Pfs*17 | Q9BSJ2 | protein_coding | TCGA-D8-A27V-01 | Breast | breast invasive carcinoma | Female | <65 | I/II | Hormone Therapy | tamoxiphen | SD | ||
| TUBGCP2 | SNV | Missense_Mutation | rs780547006 | c.974G>A | p.Arg325His | p.R325H | Q9BSJ2 | protein_coding | tolerated(0.06) | benign(0.052) | TCGA-2W-A8YY-01 | Cervix | cervical & endocervical cancer | Female | <65 | I/II | Chemotherapy | cisplatin | CR |
| Page: 1 2 3 4 5 6 7 8 9 10 11 |
Top |
Related drugs of malignant transformation related genes |
| Identification of chemicals and drugs interact with genes involved in malignant transfromation |
| (DGIdb 4.0) |
| Entrez ID | Symbol | Category | Interaction Types | Drug Claim Name | Drug Name | PMIDs |
| Page: 1 |

Copyright 2023-Present -The University of Texas Health Science Center at Houston |