Schematic overview of the cellular and molecular mechanisms involved in the cancer progression, including the proposed cellular and molecular mechanisms in cancer cells trajectory. AT1: alveolar type 1 cells; AT2: alveolar type 2 cells; AAH: atypical adenomatous hyperplasia; AIS: adenocarcinoma in situ; MIA: minimally invasive adenocarcinoma; IA: invasive adenocarcinoma; EMT: epithelial-mesenchymal transition

Home

Download

Statistics

Help

Contact

Center for Computational Systems Medicine
leaf

Gene summary

leaf

Malignant transformation analysis

leaf

Malignant transformation related pathway analysis

leaf

Cell-cell communication analysis

leaf

Single-cell gene regulatory network inference analysis

leaf

Somatic mutation of malignant transformation related genes

leaf

Related drugs of malignant transformation related genes

Gene: TRIM31

Gene summary for TRIM31

check button Gene summary.

Gene informationSpeciesHuman
Gene symbol

TRIM31

Gene ID

11074

Gene nametripartite motif containing 31
Gene AliasC6orf13
Cytomap6p22.1
Gene Typeprotein-coding
GO ID

GO:0002376

UniProtAcc

Q2L6J1


Top

Malignant transformation analysis

check button Identification of the aberrant gene expression in precancerous and cancerous lesions by comparing the gene expression of stem-like cells in diseased tissues with normal stem cells
check button Malignant transformation involving gene list.
Entrez IDSymbolReplicatesSpeciesOrganTissueAdj P-valueLog2FCMalignancy
11074TRIM31S027HumanLiverHCC3.40e-035.48e-010.2446
11074TRIM31S028HumanLiverHCC3.28e-093.82e-010.2503
11074TRIM31S029HumanLiverHCC1.87e-161.25e+000.2581
11074TRIM31Pat01-BHumanStomachGC7.22e-204.57e-010.5754
11074TRIM31Pat02-BHumanStomachGC3.69e-151.42e-010.0368
11074TRIM31Pat03-BHumanStomachGC6.83e-112.06e-010.3693
11074TRIM31Pat04-BHumanStomachGC6.25e-092.11e-01-0.1483
11074TRIM31Pat06-BHumanStomachGC4.82e-283.76e-01-0.1961
11074TRIM31Pat09-BHumanStomachGC4.68e-083.52e-01-0.0359
11074TRIM31Pat10-BHumanStomachGC3.82e-076.12e-010.084
11074TRIM31Pat11-BHumanStomachGC7.69e-031.53e-01-0.182
11074TRIM31Pat15-BHumanStomachGC2.07e-052.68e-01-0.0778
11074TRIM31Pat16-BHumanStomachGC1.97e-256.57e-010.1918
11074TRIM31Pat17-BHumanStomachGC1.10e-257.43e-010.3109
11074TRIM31Pat18-BHumanStomachGC1.15e-052.38e-01-0.0432
11074TRIM31Pat19-BHumanStomachGC7.09e-093.01e-010.0826
11074TRIM31Pat22-BHumanStomachGC4.26e-213.03e-01-0.1042
11074TRIM31Pat24-BHumanStomachGC9.53e-072.70e-01-0.1184
11074TRIM31Pat25-AHumanStomachCAG with IM1.50e-044.17e-02-0.1648
11074TRIM31Pat26-AHumanStomachCSG1.34e-162.51e-01-0.2402
Page: 1 2 3 4 

check button Transcriptomic changes along malignancy continuum.
TissueExpression DynamicsAbbreviation
Colorectum (GSE201348)The image shows the transcriptomic changes along malignancy continuum.log2FC in expression of this searched gene in stem-like cells from each diseased tissue sample relative to stem-like cells in normal samples in each tissue plotted against the malignancy continuum. Samples are colored based on if they are from different disease stage.FAP: Familial adenomatous polyposis
CRC: Colorectal cancer
Colorectum (HTA11)The image shows the transcriptomic changes along malignancy continuum.log2FC in expression of this searched gene in stem-like cells from each diseased tissue sample relative to stem-like cells in normal samples in each tissue plotted against the malignancy continuum. Samples are colored based on if they are from different disease stage.AD: Adenomas
SER: Sessile serrated lesions
MSI-H: Microsatellite-high colorectal cancer
MSS: Microsatellite stable colorectal cancer
EsophagusThe image shows the transcriptomic changes along malignancy continuum.log2FC in expression of this searched gene in stem-like cells from each diseased tissue sample relative to stem-like cells in normal samples in each tissue plotted against the malignancy continuum. Samples are colored based on if they are from different disease stage.ESCC: Esophageal squamous cell carcinoma
HGIN: High-grade intraepithelial neoplasias
LGIN: Low-grade intraepithelial neoplasias
GCThe image shows the transcriptomic changes along malignancy continuum.log2FC in expression of this searched gene in stem-like cells from each diseased tissue sample relative to stem-like cells in normal samples in each tissue plotted against the malignancy continuum. Samples are colored based on if they are from different disease stage.
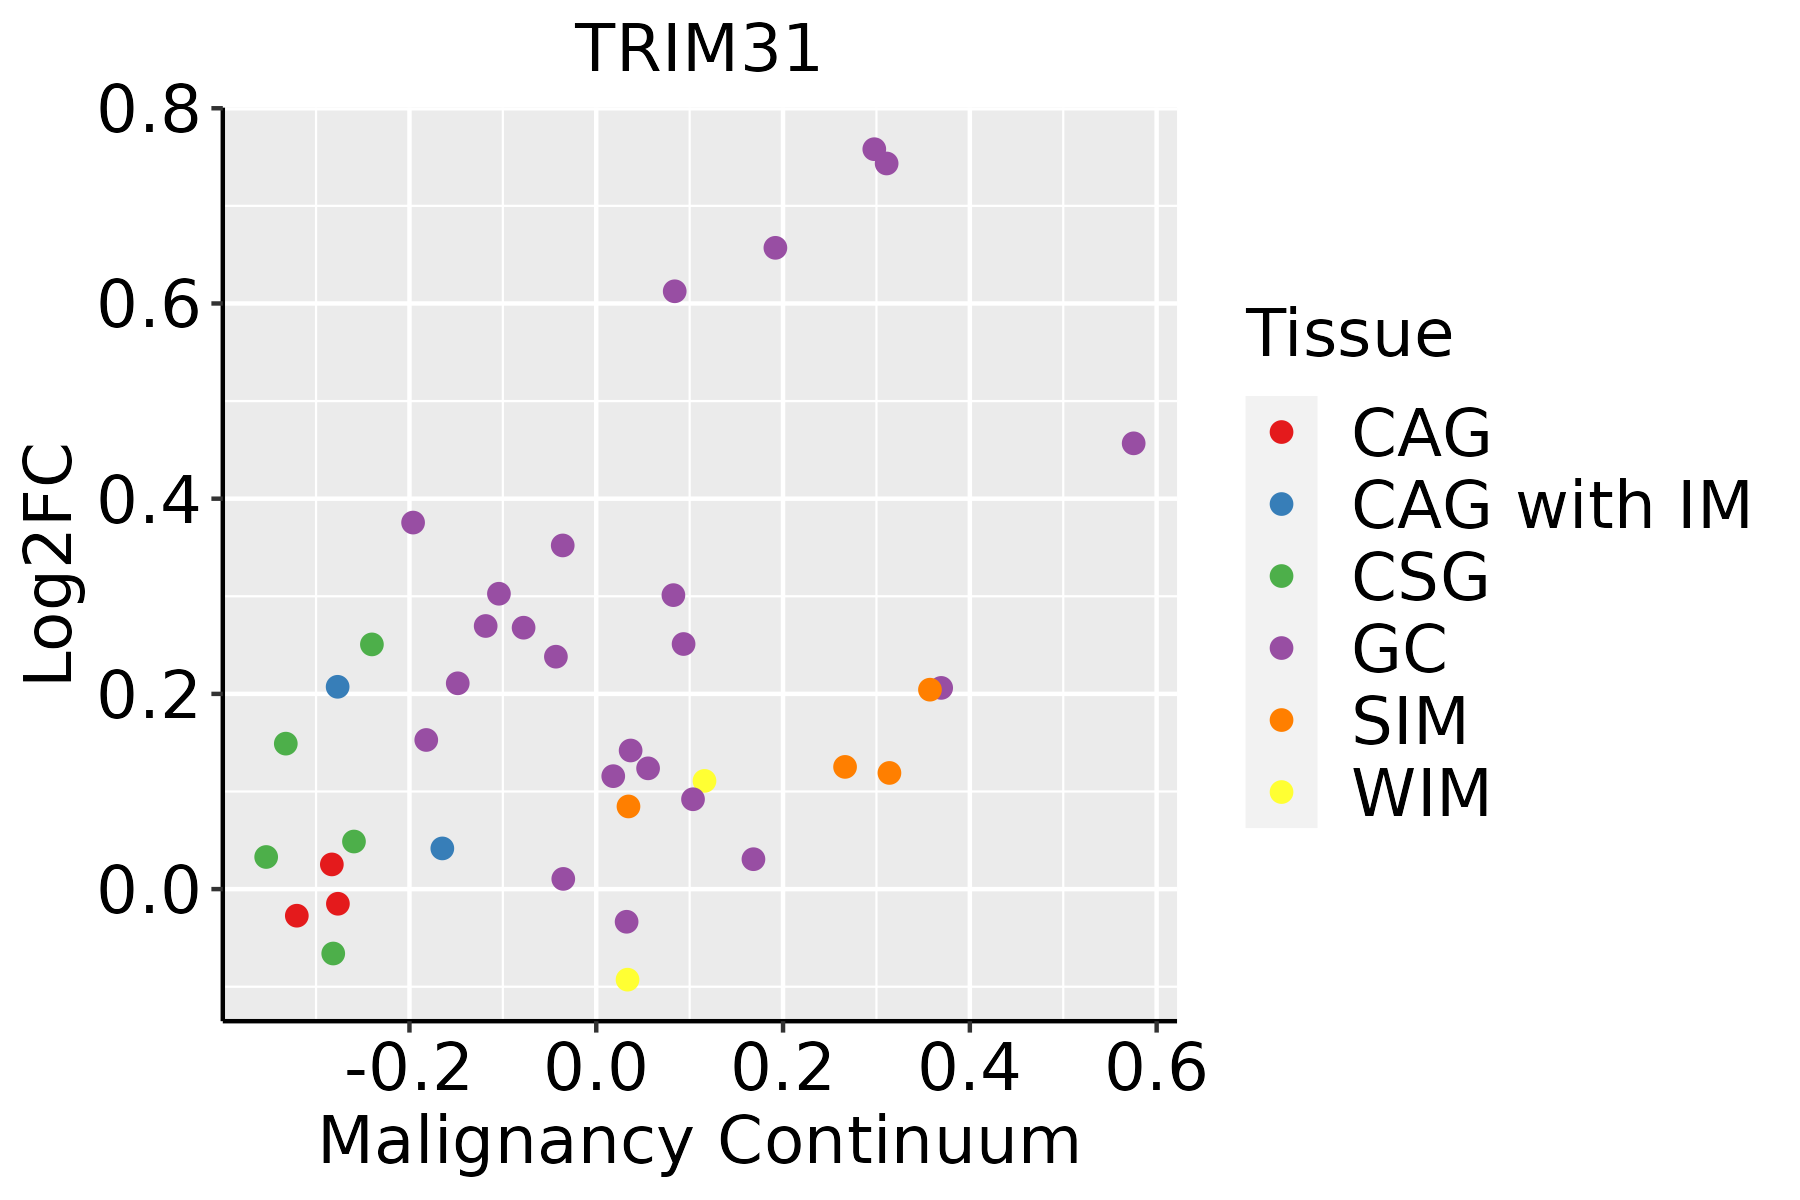
CAG: Chronic atrophic gastritis
CAG with IM: Chronic atrophic gastritis with intestinal metaplasia
CSG: Chronic superficial gastritis
GC: Gastric cancer
SIM: Severe intestinal metaplasia
WIM: Wild intestinal metaplasia
LiverThe image shows the transcriptomic changes along malignancy continuum.log2FC in expression of this searched gene in stem-like cells from each diseased tissue sample relative to stem-like cells in normal samples in each tissue plotted against the malignancy continuum. Samples are colored based on if they are from different disease stage.
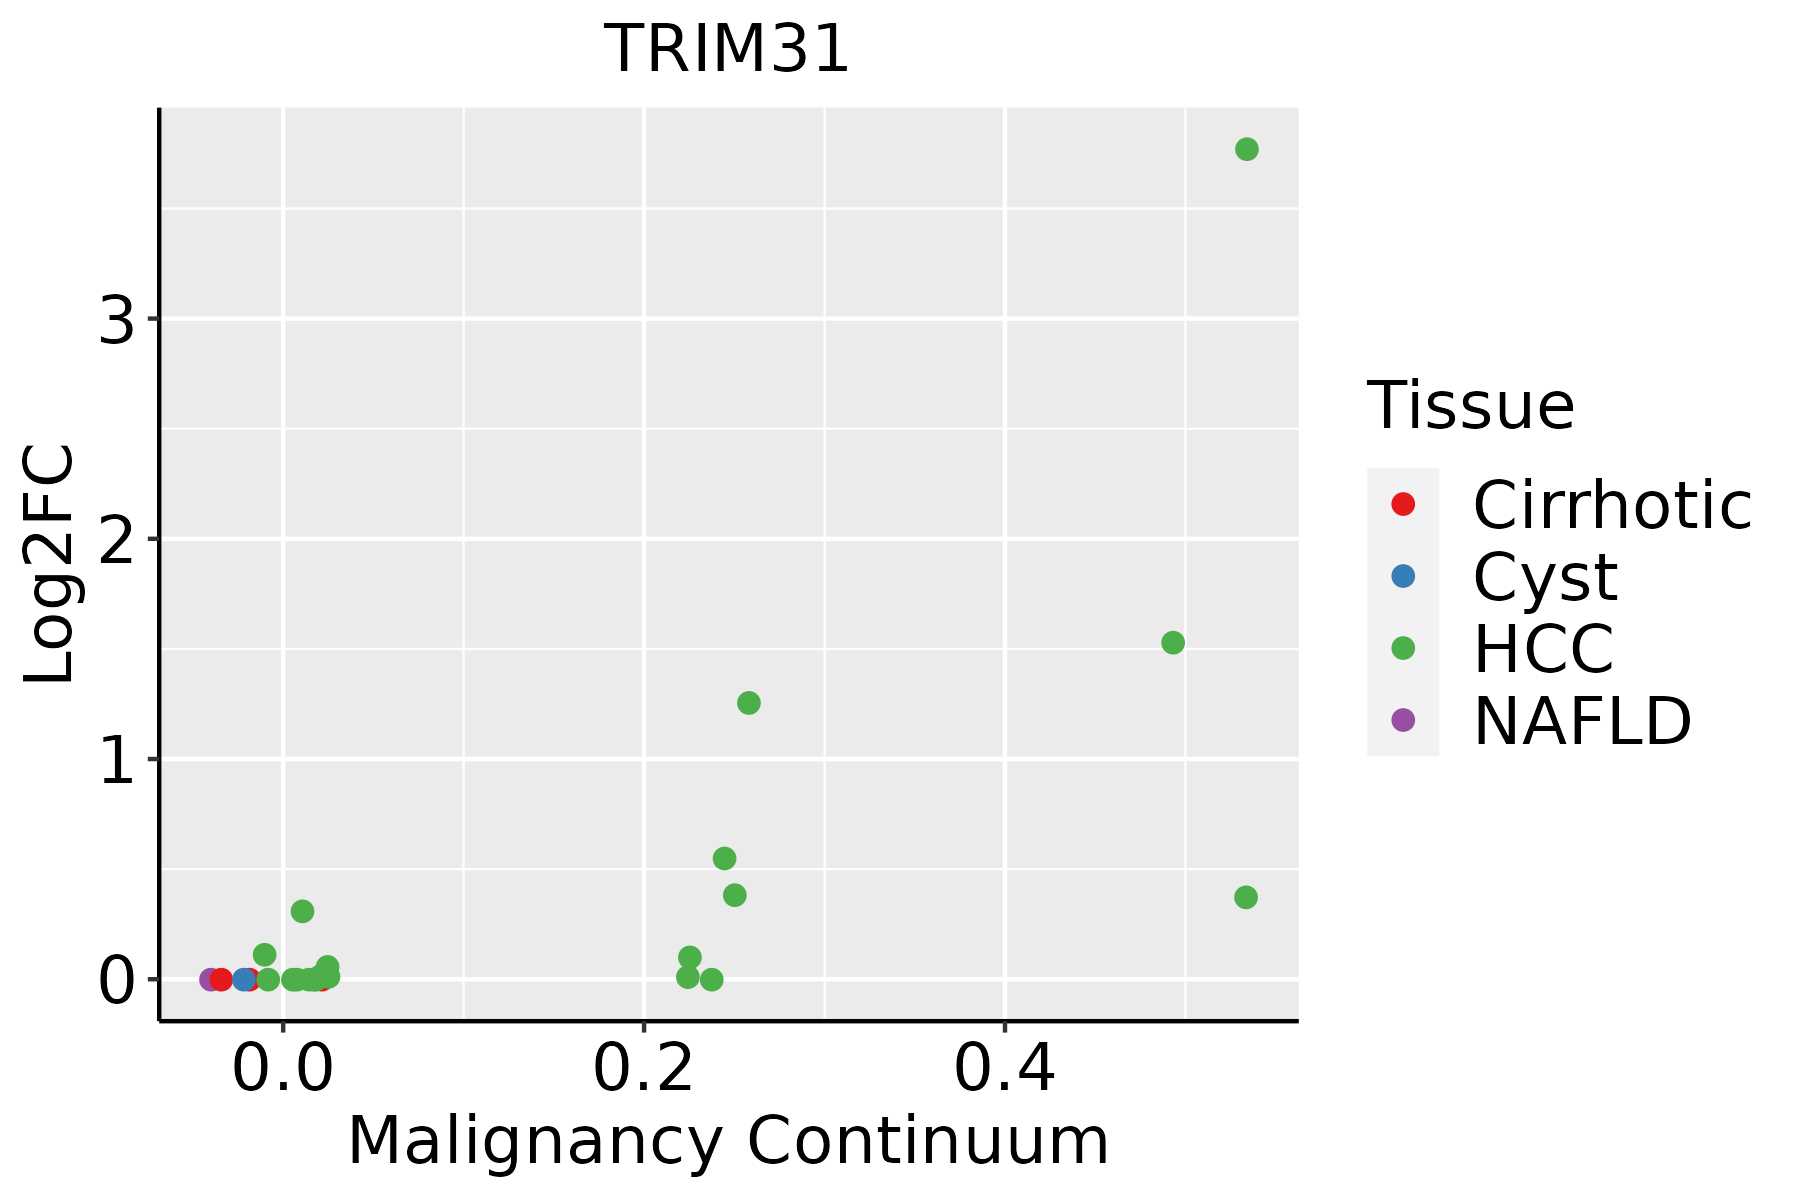
HCC: Hepatocellular carcinoma
NAFLD: Non-alcoholic fatty liver disease
∗log2FC in expression of this searched gene in stem-like cells from each diseased tissue sample relative to stem-like cells in normal samples in each tissue plotted against the malignancy continuum. Samples are colored based on if they are from different disease stage.

Top

Malignant transformation related pathway analysis

check buttonFind out the enriched GO biological processes and KEGG pathways involved in transition from healthy to precancer to cancer
check button Figure of enriched GO biological processes.
TissueDisease StageEnriched GO biological Processes
ColorectumADGO analysis - Figure of enriched GO biological processes: Top 15 enriched GO BP terms are showed in the bar plot of each disease state in each tissue. Each row represents a significant GO biological process which is colored according to the -log10(p.adjust).
ColorectumSERGO analysis - Figure of enriched GO biological processes: Top 15 enriched GO BP terms are showed in the bar plot of each disease state in each tissue. Each row represents a significant GO biological process which is colored according to the -log10(p.adjust).
ColorectumMSSGO analysis - Figure of enriched GO biological processes: Top 15 enriched GO BP terms are showed in the bar plot of each disease state in each tissue. Each row represents a significant GO biological process which is colored according to the -log10(p.adjust).
ColorectumMSI-HGO analysis - Figure of enriched GO biological processes: Top 15 enriched GO BP terms are showed in the bar plot of each disease state in each tissue. Each row represents a significant GO biological process which is colored according to the -log10(p.adjust).
ColorectumFAPGO analysis - Figure of enriched GO biological processes: Top 15 enriched GO BP terms are showed in the bar plot of each disease state in each tissue. Each row represents a significant GO biological process which is colored according to the -log10(p.adjust).
∗Top 15 enriched GO BP terms are showed in the bar plot of each disease state in each tissue. Each row represents a significant GO biological process which is colored according to the -log10(p.adjust).
Page: 1 2 3 4 5 6 7 8 9 

check button Enriched GO biological processes.
GO IDTissueDisease StageDescriptionGene RatioBg Ratiopvaluep.adjustCount
GO:0016032ColorectumADviral process168/3918415/187234.67e-203.66e-17168
GO:0019058ColorectumADviral life cycle119/3918317/187236.18e-128.23e-10119
GO:0044403ColorectumADbiological process involved in symbiotic interaction99/3918290/187231.02e-074.93e-0699
GO:0019080ColorectumADviral gene expression42/391894/187231.90e-078.02e-0642
GO:0051701ColorectumADbiological process involved in interaction with host73/3918203/187235.08e-071.88e-0573
GO:0052126ColorectumADmovement in host environment63/3918175/187232.85e-068.11e-0563
GO:0050792ColorectumADregulation of viral process59/3918164/187235.95e-061.52e-0459
GO:0046718ColorectumADviral entry into host cell51/3918144/187233.99e-057.16e-0451
GO:1903900ColorectumADregulation of viral life cycle51/3918148/187239.01e-051.38e-0351
GO:0044409ColorectumADentry into host51/3918151/187231.60e-042.21e-0351
GO:0019076ColorectumADviral release from host cell15/391834/187231.96e-031.58e-0215
GO:0035890ColorectumADexit from host15/391834/187231.96e-031.58e-0215
GO:0035891ColorectumADexit from host cell15/391834/187231.96e-031.58e-0215
GO:0051091ColorectumADpositive regulation of DNA-binding transcription factor activity73/3918260/187233.52e-032.54e-0273
GO:00160321ColorectumSERviral process118/2897415/187238.36e-121.65e-09118
GO:00190581ColorectumSERviral life cycle87/2897317/187232.82e-081.94e-0687
GO:00517011ColorectumSERbiological process involved in interaction with host55/2897203/187231.42e-054.38e-0455
GO:00444031ColorectumSERbiological process involved in symbiotic interaction72/2897290/187232.08e-056.02e-0472
GO:00521261ColorectumSERmovement in host environment47/2897175/187237.30e-051.64e-0347
GO:00190801ColorectumSERviral gene expression29/289794/187231.32e-042.66e-0329
Page: 1 2 3 4 5 6 7 8 

check button Enriched KEGG pathways.
Pathway IDTissueDisease StageDescriptionGene RatioBg Ratiopvaluep.adjustqvalueCount
Page: 1 

Top

Cell-cell communication analysis

check buttonIdentification of potential cell-cell interactions between two cell types and their ligand-receptor pairs for different disease states
LigandReceptorLRpairPathwayTissueDisease Stage
Page: 1 

Top

Single-cell gene regulatory network inference analysis

check buttonFind out the significant the regulons (TFs) and the target genes of each regulon across cell types for different disease states
TFCell TypeTissueDisease StageTarget GeneRSSRegulon Activity
∗The dot plots of a searched regulon are shown for all cell subpopulations in each disease state of each tissue based on the regulon specific score inferred using pySCENIC and by calculating the average expression.
Page: 1 

Top

Somatic mutation of malignant transformation related genes

check buttonAnnotation of somatic variants for genes involved in malignant transformation
Hugo SymbolVariant ClassVariant ClassificationdbSNP RSHGVScHGVSpHGVSp ShortSWISSPROTBIOTYPESIFTPolyPhenTumor Sample BarcodeTissueHistologySexAgeStageTherapy TypesDrugsOutcome
TRIM31insertionFrame_Shift_Insnovelc.98_99insAGCTCTACAAGCCTCTGAGGTGCAGTCCAAAAGGAAAGAGGCTACATGCCp.His33GlnfsTer45p.H33Qfs*45Q9BZY9protein_codingTCGA-AO-A0JB-01Breastbreast invasive carcinomaFemale<65III/IVChemotherapycyclophosphamideSD
TRIM31SNVMissense_Mutationc.126G>Cp.Gln42Hisp.Q42HQ9BZY9protein_codingdeleterious(0.01)probably_damaging(0.95)TCGA-Q1-A73O-01Cervixcervical & endocervical cancerFemale<65I/IIChemotherapycisplatinCR
TRIM31SNVMissense_Mutationnovelc.824N>Gp.Lys275Argp.K275RQ9BZY9protein_codingdeleterious(0.02)benign(0.122)TCGA-AA-3811-01Colorectumcolon adenocarcinomaFemale>=65III/IVUnknownUnknownPD
TRIM31SNVMissense_Mutationc.254N>Cp.Glu85Alap.E85AQ9BZY9protein_codingdeleterious(0.01)benign(0.024)TCGA-AA-3952-01Colorectumcolon adenocarcinomaMale>=65III/IVUnknownUnknownPD
TRIM31SNVMissense_Mutationc.1163C>Tp.Ala388Valp.A388VQ9BZY9protein_codingdeleterious_low_confidence(0.02)benign(0.038)TCGA-AZ-6601-01Colorectumcolon adenocarcinomaMale>=65I/IIUnknownUnknownPD
TRIM31SNVMissense_Mutationc.134N>Gp.Glu45Glyp.E45GQ9BZY9protein_codingtolerated(0.08)benign(0.18)TCGA-WS-AB45-01Colorectumcolon adenocarcinomaFemale<65I/IIUnknownUnknownSD
TRIM31SNVMissense_Mutationnovelc.722N>Ap.Met241Lysp.M241KQ9BZY9protein_codingdeleterious(0.01)benign(0.017)TCGA-AG-A032-01Colorectumrectum adenocarcinomaMale>=65III/IVTargeted Molecular therapybevacizumabPD
TRIM31SNVMissense_Mutationrs201488158c.61N>Ap.Asp21Asnp.D21NQ9BZY9protein_codingdeleterious(0)possibly_damaging(0.574)TCGA-A5-A0G2-01Endometriumuterine corpus endometrioid carcinomaFemale<65III/IVUnknownUnknownSD
TRIM31SNVMissense_Mutationnovelc.1270T>Cp.Ser424Prop.S424PQ9BZY9protein_codingdeleterious_low_confidence(0)benign(0.003)TCGA-AJ-A3EK-01Endometriumuterine corpus endometrioid carcinomaFemale<65I/IIChemotherapycarboplatinCR
TRIM31SNVMissense_Mutationc.539N>Tp.Arg180Metp.R180MQ9BZY9protein_codingtolerated(0.09)benign(0.269)TCGA-AP-A051-01Endometriumuterine corpus endometrioid carcinomaFemale>=65I/IIUnknownUnknownSD
Page: 1 2 3 4 5 

Top

Related drugs of malignant transformation related genes

check buttonIdentification of chemicals and drugs interact with genes involved in malignant transfromation
(DGIdb 4.0)
Entrez IDSymbolCategoryInteraction TypesDrug Claim NameDrug NamePMIDs
Page: 1