
|
|||||
|
 | |
| |
| |
| |
| |
| |
|
Gene: TNPO2 |
Gene summary for TNPO2 |
| Gene information | Species | Human | Gene symbol | TNPO2 | Gene ID | 30000 |
| Gene name | transportin 2 | |
| Gene Alias | IPO3 | |
| Cytomap | 19p13.13 | |
| Gene Type | protein-coding | GO ID | GO:0006606 | UniProtAcc | A0A024R7F7 |
Top |
Malignant transformation analysis |
| Identification of the aberrant gene expression in precancerous and cancerous lesions by comparing the gene expression of stem-like cells in diseased tissues with normal stem cells |
| Entrez ID | Symbol | Replicates | Species | Organ | Tissue | Adj P-value | Log2FC | Malignancy |
| 30000 | TNPO2 | ATC11 | Human | Thyroid | ATC | 1.58e-04 | 3.56e-01 | 0.3386 |
| 30000 | TNPO2 | ATC12 | Human | Thyroid | ATC | 6.37e-13 | 2.23e-01 | 0.34 |
| 30000 | TNPO2 | ATC13 | Human | Thyroid | ATC | 5.04e-26 | 3.83e-01 | 0.34 |
| 30000 | TNPO2 | ATC1 | Human | Thyroid | ATC | 1.01e-03 | 1.73e-01 | 0.2878 |
| 30000 | TNPO2 | ATC2 | Human | Thyroid | ATC | 6.00e-08 | 8.57e-01 | 0.34 |
| 30000 | TNPO2 | ATC3 | Human | Thyroid | ATC | 1.57e-12 | 4.93e-01 | 0.338 |
| 30000 | TNPO2 | ATC4 | Human | Thyroid | ATC | 3.74e-12 | 2.56e-01 | 0.34 |
| 30000 | TNPO2 | ATC5 | Human | Thyroid | ATC | 1.59e-23 | 4.28e-01 | 0.34 |
| Page: 1 2 3 |
| Tissue | Expression Dynamics | Abbreviation |
| Colorectum (GSE201348) |  | FAP: Familial adenomatous polyposis |
| CRC: Colorectal cancer | ||
| Colorectum (HTA11) |  | AD: Adenomas |
| SER: Sessile serrated lesions | ||
| MSI-H: Microsatellite-high colorectal cancer | ||
| MSS: Microsatellite stable colorectal cancer | ||
| Oral Cavity |  | EOLP: Erosive Oral lichen planus |
| LP: leukoplakia | ||
| NEOLP: Non-erosive oral lichen planus | ||
| OSCC: Oral squamous cell carcinoma | ||
| Thyroid | 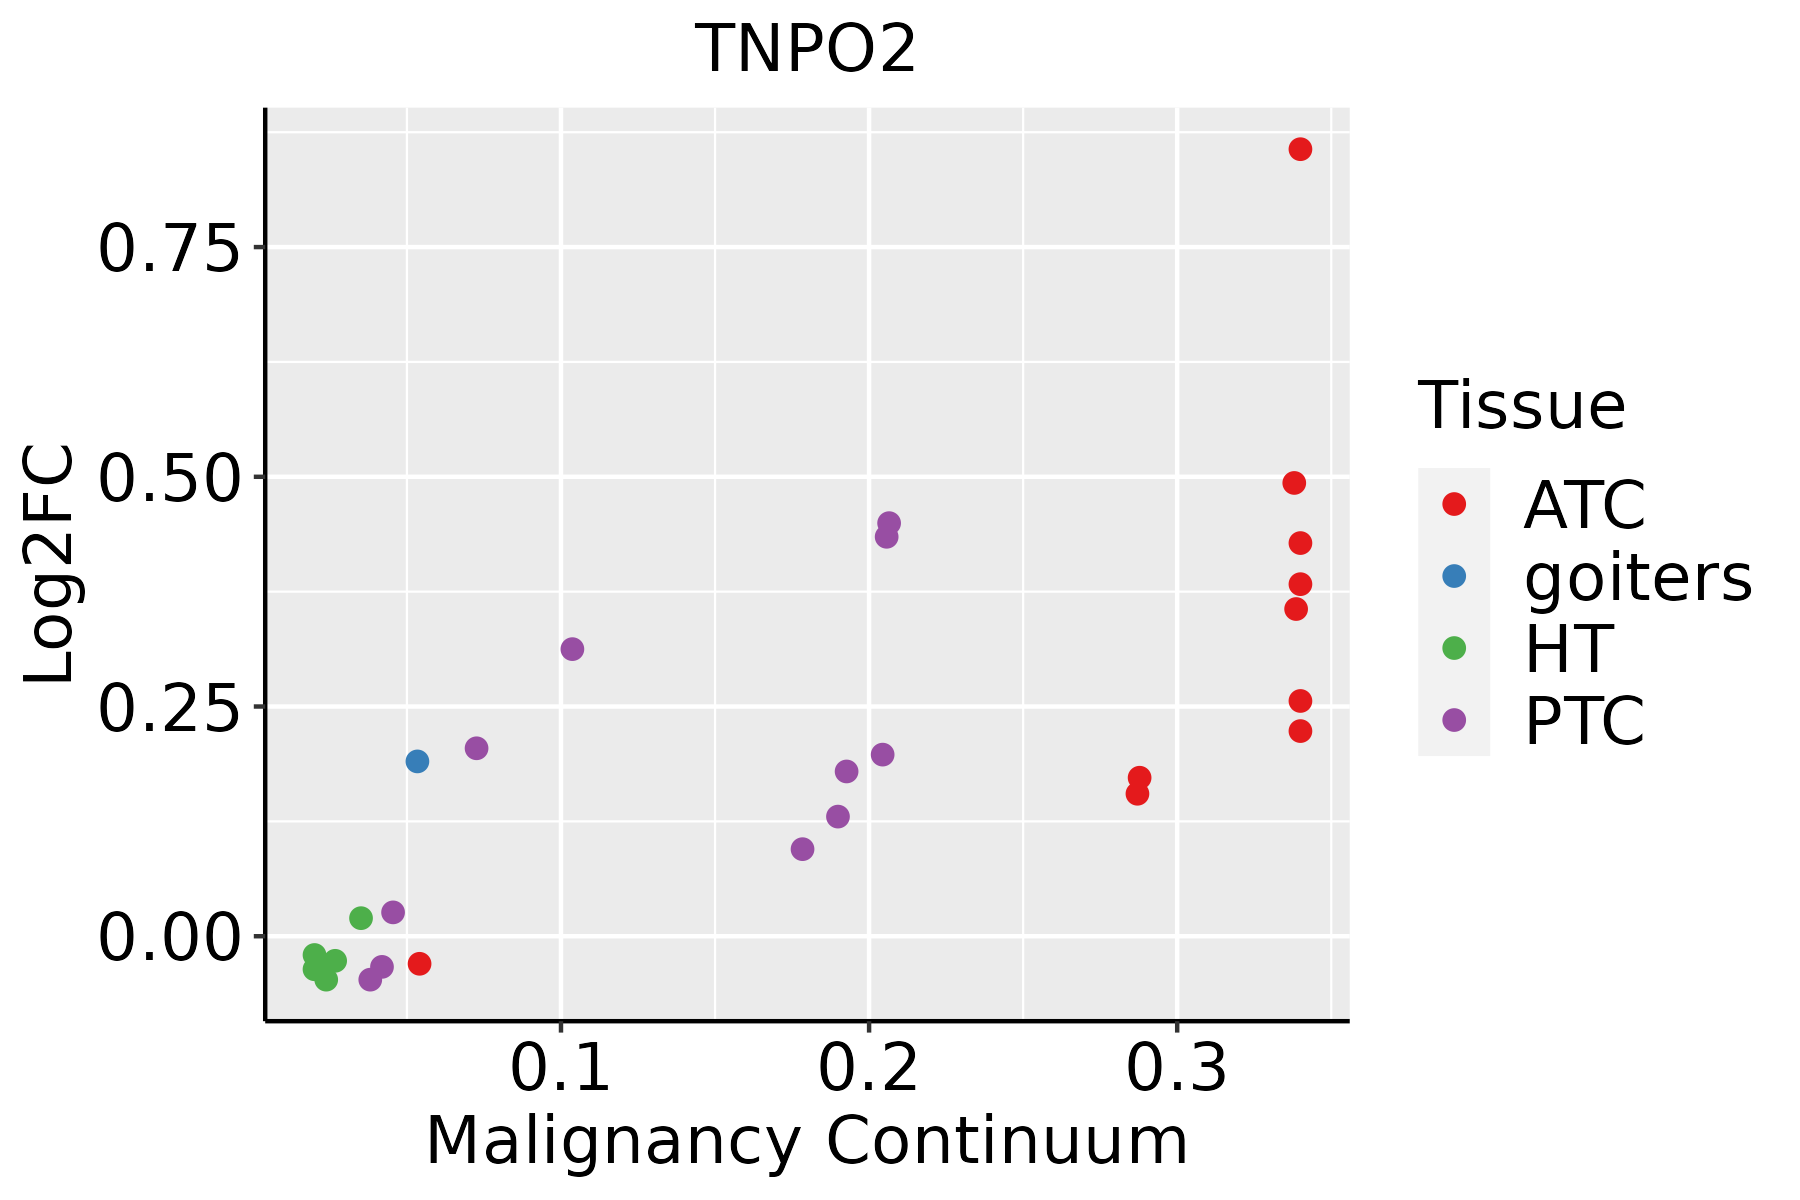 | ATC: Anaplastic thyroid cancer |
| HT: Hashimoto's thyroiditis | ||
| PTC: Papillary thyroid cancer |
| ∗log2FC in expression of this searched gene in stem-like cells from each diseased tissue sample relative to stem-like cells in normal samples in each tissue plotted against the malignancy continuum. Samples are colored based on if they are from different disease stage. |
Top |
Malignant transformation related pathway analysis |
| Find out the enriched GO biological processes and KEGG pathways involved in transition from healthy to precancer to cancer |
| Tissue | Disease Stage | Enriched GO biological Processes |
| Colorectum | AD |  |
| Colorectum | SER |  |
| Colorectum | MSS |  |
| Colorectum | MSI-H |  |
| Colorectum | FAP |  |
| ∗Top 15 enriched GO BP terms are showed in the bar plot of each disease state in each tissue. Each row represents a significant GO biological process which is colored according to the -log10(p.adjust). |
| Page: 1 2 3 4 5 6 7 8 9 |
| GO ID | Tissue | Disease Stage | Description | Gene Ratio | Bg Ratio | pvalue | p.adjust | Count |
| GO:0072594 | Colorectum | AD | establishment of protein localization to organelle | 148/3918 | 422/18723 | 7.95e-12 | 1.04e-09 | 148 |
| GO:0006913 | Colorectum | AD | nucleocytoplasmic transport | 102/3918 | 301/18723 | 1.00e-07 | 4.85e-06 | 102 |
| GO:0051169 | Colorectum | AD | nuclear transport | 102/3918 | 301/18723 | 1.00e-07 | 4.85e-06 | 102 |
| GO:0034504 | Colorectum | AD | protein localization to nucleus | 94/3918 | 290/18723 | 2.83e-06 | 8.09e-05 | 94 |
| GO:0017038 | Colorectum | AD | protein import | 67/3918 | 206/18723 | 6.34e-05 | 1.05e-03 | 67 |
| GO:0051170 | Colorectum | AD | import into nucleus | 53/3918 | 159/18723 | 1.76e-04 | 2.38e-03 | 53 |
| GO:0006606 | Colorectum | AD | protein import into nucleus | 51/3918 | 155/18723 | 3.29e-04 | 3.86e-03 | 51 |
| GO:00725942 | Colorectum | MSS | establishment of protein localization to organelle | 139/3467 | 422/18723 | 5.75e-13 | 1.12e-10 | 139 |
| GO:00069132 | Colorectum | MSS | nucleocytoplasmic transport | 99/3467 | 301/18723 | 1.35e-09 | 1.03e-07 | 99 |
| GO:00511692 | Colorectum | MSS | nuclear transport | 99/3467 | 301/18723 | 1.35e-09 | 1.03e-07 | 99 |
| GO:00345042 | Colorectum | MSS | protein localization to nucleus | 92/3467 | 290/18723 | 3.66e-08 | 1.98e-06 | 92 |
| GO:00170382 | Colorectum | MSS | protein import | 65/3467 | 206/18723 | 4.28e-06 | 1.22e-04 | 65 |
| GO:00511702 | Colorectum | MSS | import into nucleus | 52/3467 | 159/18723 | 1.23e-05 | 2.87e-04 | 52 |
| GO:00066062 | Colorectum | MSS | protein import into nucleus | 50/3467 | 155/18723 | 2.72e-05 | 5.58e-04 | 50 |
| GO:00069134 | Colorectum | FAP | nucleocytoplasmic transport | 77/2622 | 301/18723 | 6.15e-08 | 4.54e-06 | 77 |
| GO:00511694 | Colorectum | FAP | nuclear transport | 77/2622 | 301/18723 | 6.15e-08 | 4.54e-06 | 77 |
| GO:00725944 | Colorectum | FAP | establishment of protein localization to organelle | 96/2622 | 422/18723 | 6.63e-07 | 3.20e-05 | 96 |
| GO:00345044 | Colorectum | FAP | protein localization to nucleus | 66/2622 | 290/18723 | 3.47e-05 | 7.64e-04 | 66 |
| GO:00511704 | Colorectum | FAP | import into nucleus | 39/2622 | 159/18723 | 2.68e-04 | 3.64e-03 | 39 |
| GO:00066064 | Colorectum | FAP | protein import into nucleus | 38/2622 | 155/18723 | 3.23e-04 | 4.15e-03 | 38 |
| Page: 1 2 3 |
| Pathway ID | Tissue | Disease Stage | Description | Gene Ratio | Bg Ratio | pvalue | p.adjust | qvalue | Count |
| hsa030136 | Oral cavity | OSCC | Nucleocytoplasmic transport | 82/3704 | 108/8465 | 7.93e-12 | 1.33e-10 | 6.77e-11 | 82 |
| hsa0301311 | Oral cavity | OSCC | Nucleocytoplasmic transport | 82/3704 | 108/8465 | 7.93e-12 | 1.33e-10 | 6.77e-11 | 82 |
| Page: 1 |
Top |
Cell-cell communication analysis |
| Identification of potential cell-cell interactions between two cell types and their ligand-receptor pairs for different disease states |
| Ligand | Receptor | LRpair | Pathway | Tissue | Disease Stage |
| Page: 1 |
Top |
Single-cell gene regulatory network inference analysis |
| Find out the significant the regulons (TFs) and the target genes of each regulon across cell types for different disease states |
| TF | Cell Type | Tissue | Disease Stage | Target Gene | RSS | Regulon Activity |
| ∗The dot plots of a searched regulon are shown for all cell subpopulations in each disease state of each tissue based on the regulon specific score inferred using pySCENIC and by calculating the average expression. |
| Page: 1 |
Top |
Somatic mutation of malignant transformation related genes |
| Annotation of somatic variants for genes involved in malignant transformation |
| Hugo Symbol | Variant Class | Variant Classification | dbSNP RS | HGVSc | HGVSp | HGVSp Short | SWISSPROT | BIOTYPE | SIFT | PolyPhen | Tumor Sample Barcode | Tissue | Histology | Sex | Age | Stage | Therapy Types | Drugs | Outcome |
| TNPO2 | SNV | Missense_Mutation | novel | c.2071N>A | p.Leu691Ile | p.L691I | O14787 | protein_coding | deleterious(0.01) | probably_damaging(0.949) | TCGA-AN-A0AK-01 | Breast | breast invasive carcinoma | Female | >=65 | I/II | Unknown | Unknown | SD |
| TNPO2 | deletion | Frame_Shift_Del | novel | c.69_78delNNNNNNNNNN | p.Asn24LeufsTer22 | p.N24Lfs*22 | O14787 | protein_coding | TCGA-MS-A51U-01 | Breast | breast invasive carcinoma | Female | <65 | I/II | Chemotherapy | adriamycin | SD | ||
| TNPO2 | SNV | Missense_Mutation | c.1948N>A | p.Glu650Lys | p.E650K | O14787 | protein_coding | deleterious(0.04) | probably_damaging(0.985) | TCGA-MU-A51Y-01 | Cervix | cervical & endocervical cancer | Female | <65 | I/II | Unknown | Unknown | SD | |
| TNPO2 | SNV | Missense_Mutation | c.1130N>T | p.Ala377Val | p.A377V | O14787 | protein_coding | deleterious(0.03) | possibly_damaging(0.5) | TCGA-AA-3495-01 | Colorectum | colon adenocarcinoma | Male | >=65 | I/II | Unknown | Unknown | SD | |
| TNPO2 | SNV | Missense_Mutation | c.1006N>T | p.Arg336Cys | p.R336C | O14787 | protein_coding | deleterious(0) | probably_damaging(0.938) | TCGA-AA-3680-01 | Colorectum | colon adenocarcinoma | Female | >=65 | III/IV | Chemotherapy | folinic | PD | |
| TNPO2 | SNV | Missense_Mutation | c.1433N>C | p.Leu478Pro | p.L478P | O14787 | protein_coding | deleterious(0) | probably_damaging(0.998) | TCGA-AA-3815-01 | Colorectum | colon adenocarcinoma | Female | >=65 | I/II | Unknown | Unknown | SD | |
| TNPO2 | SNV | Missense_Mutation | novel | c.519N>A | p.Met173Ile | p.M173I | O14787 | protein_coding | tolerated(0.06) | benign(0) | TCGA-AA-3877-01 | Colorectum | colon adenocarcinoma | Female | >=65 | I/II | Unknown | Unknown | SD |
| TNPO2 | SNV | Missense_Mutation | novel | c.188G>A | p.Arg63His | p.R63H | O14787 | protein_coding | deleterious(0) | probably_damaging(1) | TCGA-AA-3984-01 | Colorectum | colon adenocarcinoma | Female | <65 | I/II | Unknown | Unknown | SD |
| TNPO2 | SNV | Missense_Mutation | novel | c.548A>C | p.His183Pro | p.H183P | O14787 | protein_coding | deleterious(0) | benign(0.006) | TCGA-AA-A024-01 | Colorectum | colon adenocarcinoma | Male | >=65 | I/II | Unknown | Unknown | SD |
| TNPO2 | SNV | Missense_Mutation | c.926C>T | p.Ser309Leu | p.S309L | O14787 | protein_coding | deleterious(0) | benign(0.096) | TCGA-AD-5900-01 | Colorectum | colon adenocarcinoma | Male | >=65 | I/II | Unknown | Unknown | SD |
| Page: 1 2 3 4 5 6 7 8 9 |
Top |
Related drugs of malignant transformation related genes |
| Identification of chemicals and drugs interact with genes involved in malignant transfromation |
| (DGIdb 4.0) |
| Entrez ID | Symbol | Category | Interaction Types | Drug Claim Name | Drug Name | PMIDs |
| Page: 1 |

Copyright 2023-Present -The University of Texas Health Science Center at Houston |