Schematic overview of the cellular and molecular mechanisms involved in the cancer progression, including the proposed cellular and molecular mechanisms in cancer cells trajectory. AT1: alveolar type 1 cells; AT2: alveolar type 2 cells; AAH: atypical adenomatous hyperplasia; AIS: adenocarcinoma in situ; MIA: minimally invasive adenocarcinoma; IA: invasive adenocarcinoma; EMT: epithelial-mesenchymal transition

Home

Download

Statistics

Help

Contact

Center for Computational Systems Medicine
leaf

Gene summary

leaf

Malignant transformation analysis

leaf

Malignant transformation related pathway analysis

leaf

Cell-cell communication analysis

leaf

Single-cell gene regulatory network inference analysis

leaf

Somatic mutation of malignant transformation related genes

leaf

Related drugs of malignant transformation related genes

Gene: TMEM123

Gene summary for TMEM123

check button Gene summary.

Gene informationSpeciesHuman
Gene symbol

TMEM123

Gene ID

114908

Gene nametransmembrane protein 123
Gene AliasKCT3
Cytomap11q22.2
Gene Typeprotein-coding
GO ID

GO:0008150

UniProtAcc

Q8N131


Top

Malignant transformation analysis

check button Identification of the aberrant gene expression in precancerous and cancerous lesions by comparing the gene expression of stem-like cells in diseased tissues with normal stem cells
check button Malignant transformation involving gene list.
Entrez IDSymbolReplicatesSpeciesOrganTissueAdj P-valueLog2FCMalignancy
114908TMEM123GSM5276935HumanEndometriumEEC2.79e-083.86e-01-0.123
114908TMEM123GSM6177620_NYU_UCEC1_lib1_lib1HumanEndometriumEEC8.17e-291.25e-01-0.1869
114908TMEM123GSM6177620_NYU_UCEC1_lib2_lib2HumanEndometriumEEC1.53e-277.14e-02-0.1875
114908TMEM123GSM6177620_NYU_UCEC1_lib3_lib3HumanEndometriumEEC1.93e-288.83e-02-0.1883
114908TMEM123GSM6177621_NYU_UCEC2_lib1_lib1HumanEndometriumEEC7.64e-173.17e-02-0.1934
114908TMEM123GSM6177622_NYU_UCEC3_lib1_lib1HumanEndometriumEEC3.99e-31-1.82e-01-0.1917
114908TMEM123GSM6177622_NYU_UCEC3_lib2_lib2HumanEndometriumEEC1.66e-30-1.48e-01-0.1916
114908TMEM123GSM6177623_NYU_UCEC3_VisHumanEndometriumEEC1.52e-021.02e-01-0.1269
114908TMEM123LZE4THumanEsophagusESCC3.81e-043.71e-010.0811
114908TMEM123LZE7THumanEsophagusESCC1.09e-045.73e-020.0667
114908TMEM123LZE8THumanEsophagusESCC1.03e-044.21e-020.067
114908TMEM123LZE20THumanEsophagusESCC1.78e-023.93e-010.0662
114908TMEM123LZE22THumanEsophagusESCC4.37e-121.75e+000.068
114908TMEM123LZE24THumanEsophagusESCC1.55e-159.11e-010.0596
114908TMEM123P2T-EHumanEsophagusESCC5.04e-317.30e-010.1177
114908TMEM123P4T-EHumanEsophagusESCC3.83e-572.06e+000.1323
114908TMEM123P5T-EHumanEsophagusESCC1.23e-421.20e+000.1327
114908TMEM123P8T-EHumanEsophagusESCC1.07e-762.30e+000.0889
114908TMEM123P9T-EHumanEsophagusESCC1.38e-105.61e-010.1131
114908TMEM123P10T-EHumanEsophagusESCC4.78e-378.07e-010.116
Page: 1 2 3 4 5 6 7 8 9 10 11 

check button Transcriptomic changes along malignancy continuum.
TissueExpression DynamicsAbbreviation
BreastThe image shows the transcriptomic changes along malignancy continuum.log2FC in expression of this searched gene in stem-like cells from each diseased tissue sample relative to stem-like cells in normal samples in each tissue plotted against the malignancy continuum. Samples are colored based on if they are from different disease stage.
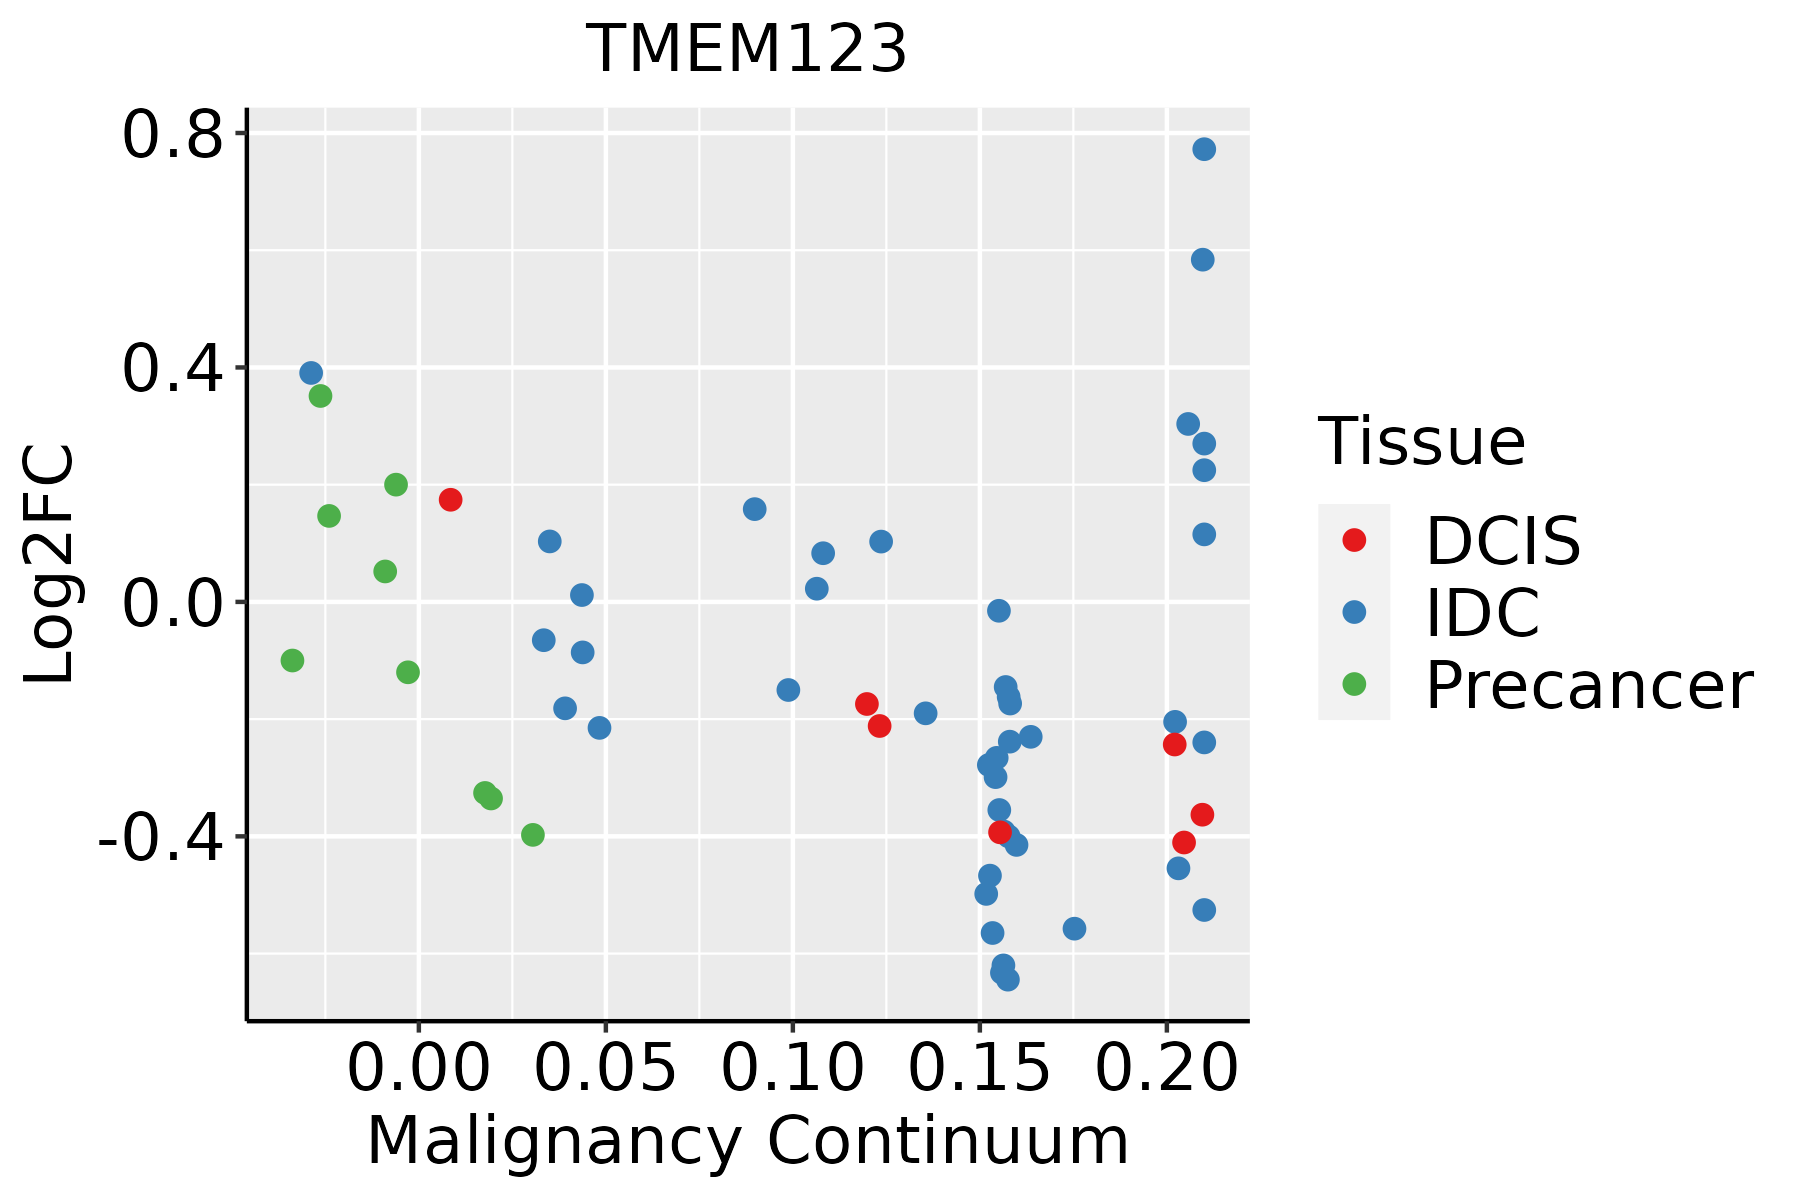
IDC: Invasive ductal carcinoma
DCIS: Ductal carcinoma in situ
Precancer(BRCA1-mut): Precancerous lesion from BRCA1 mutation carriers
EndometriumThe image shows the transcriptomic changes along malignancy continuum.log2FC in expression of this searched gene in stem-like cells from each diseased tissue sample relative to stem-like cells in normal samples in each tissue plotted against the malignancy continuum. Samples are colored based on if they are from different disease stage.AEH: Atypical endometrial hyperplasia
EEC: Endometrioid Cancer
EsophagusThe image shows the transcriptomic changes along malignancy continuum.log2FC in expression of this searched gene in stem-like cells from each diseased tissue sample relative to stem-like cells in normal samples in each tissue plotted against the malignancy continuum. Samples are colored based on if they are from different disease stage.
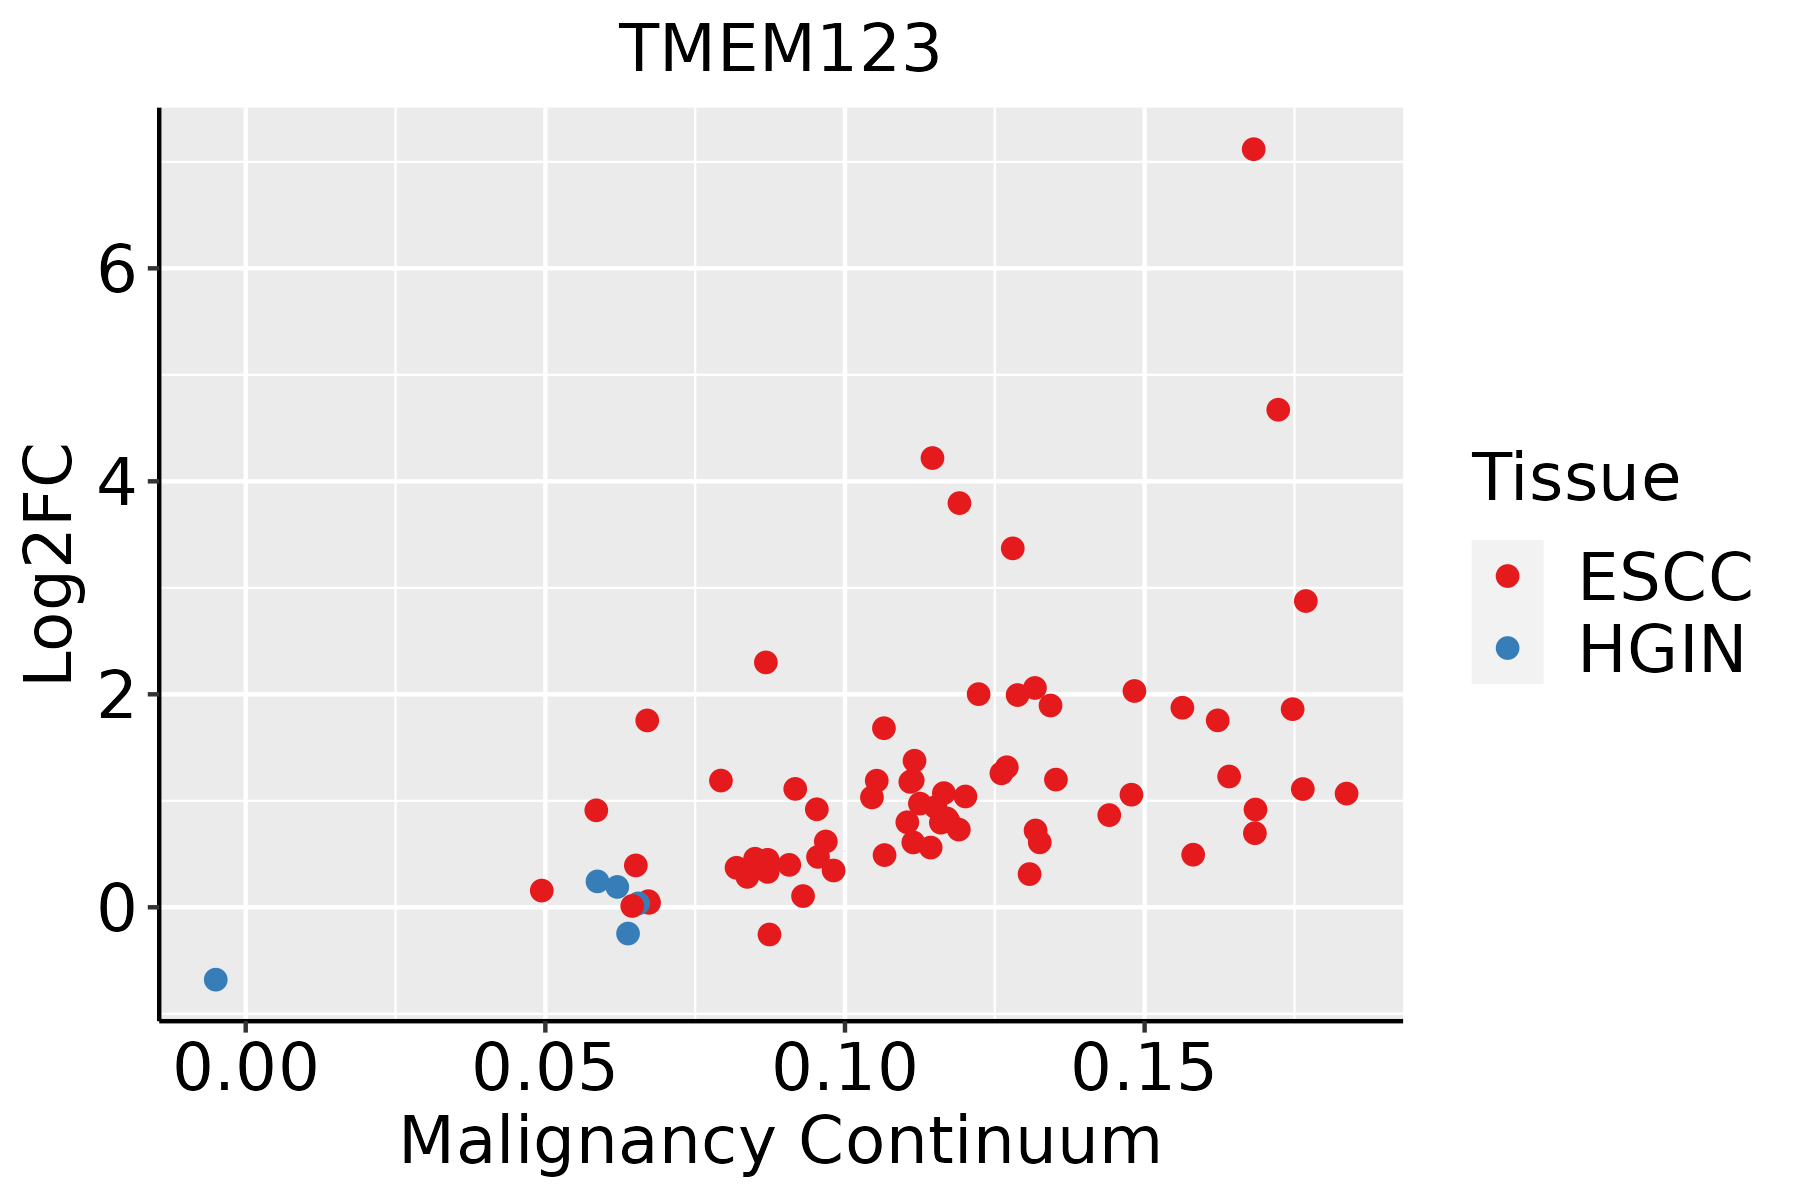
ESCC: Esophageal squamous cell carcinoma
HGIN: High-grade intraepithelial neoplasias
LGIN: Low-grade intraepithelial neoplasias
LiverThe image shows the transcriptomic changes along malignancy continuum.log2FC in expression of this searched gene in stem-like cells from each diseased tissue sample relative to stem-like cells in normal samples in each tissue plotted against the malignancy continuum. Samples are colored based on if they are from different disease stage.HCC: Hepatocellular carcinoma
NAFLD: Non-alcoholic fatty liver disease
Oral CavityThe image shows the transcriptomic changes along malignancy continuum.log2FC in expression of this searched gene in stem-like cells from each diseased tissue sample relative to stem-like cells in normal samples in each tissue plotted against the malignancy continuum. Samples are colored based on if they are from different disease stage.
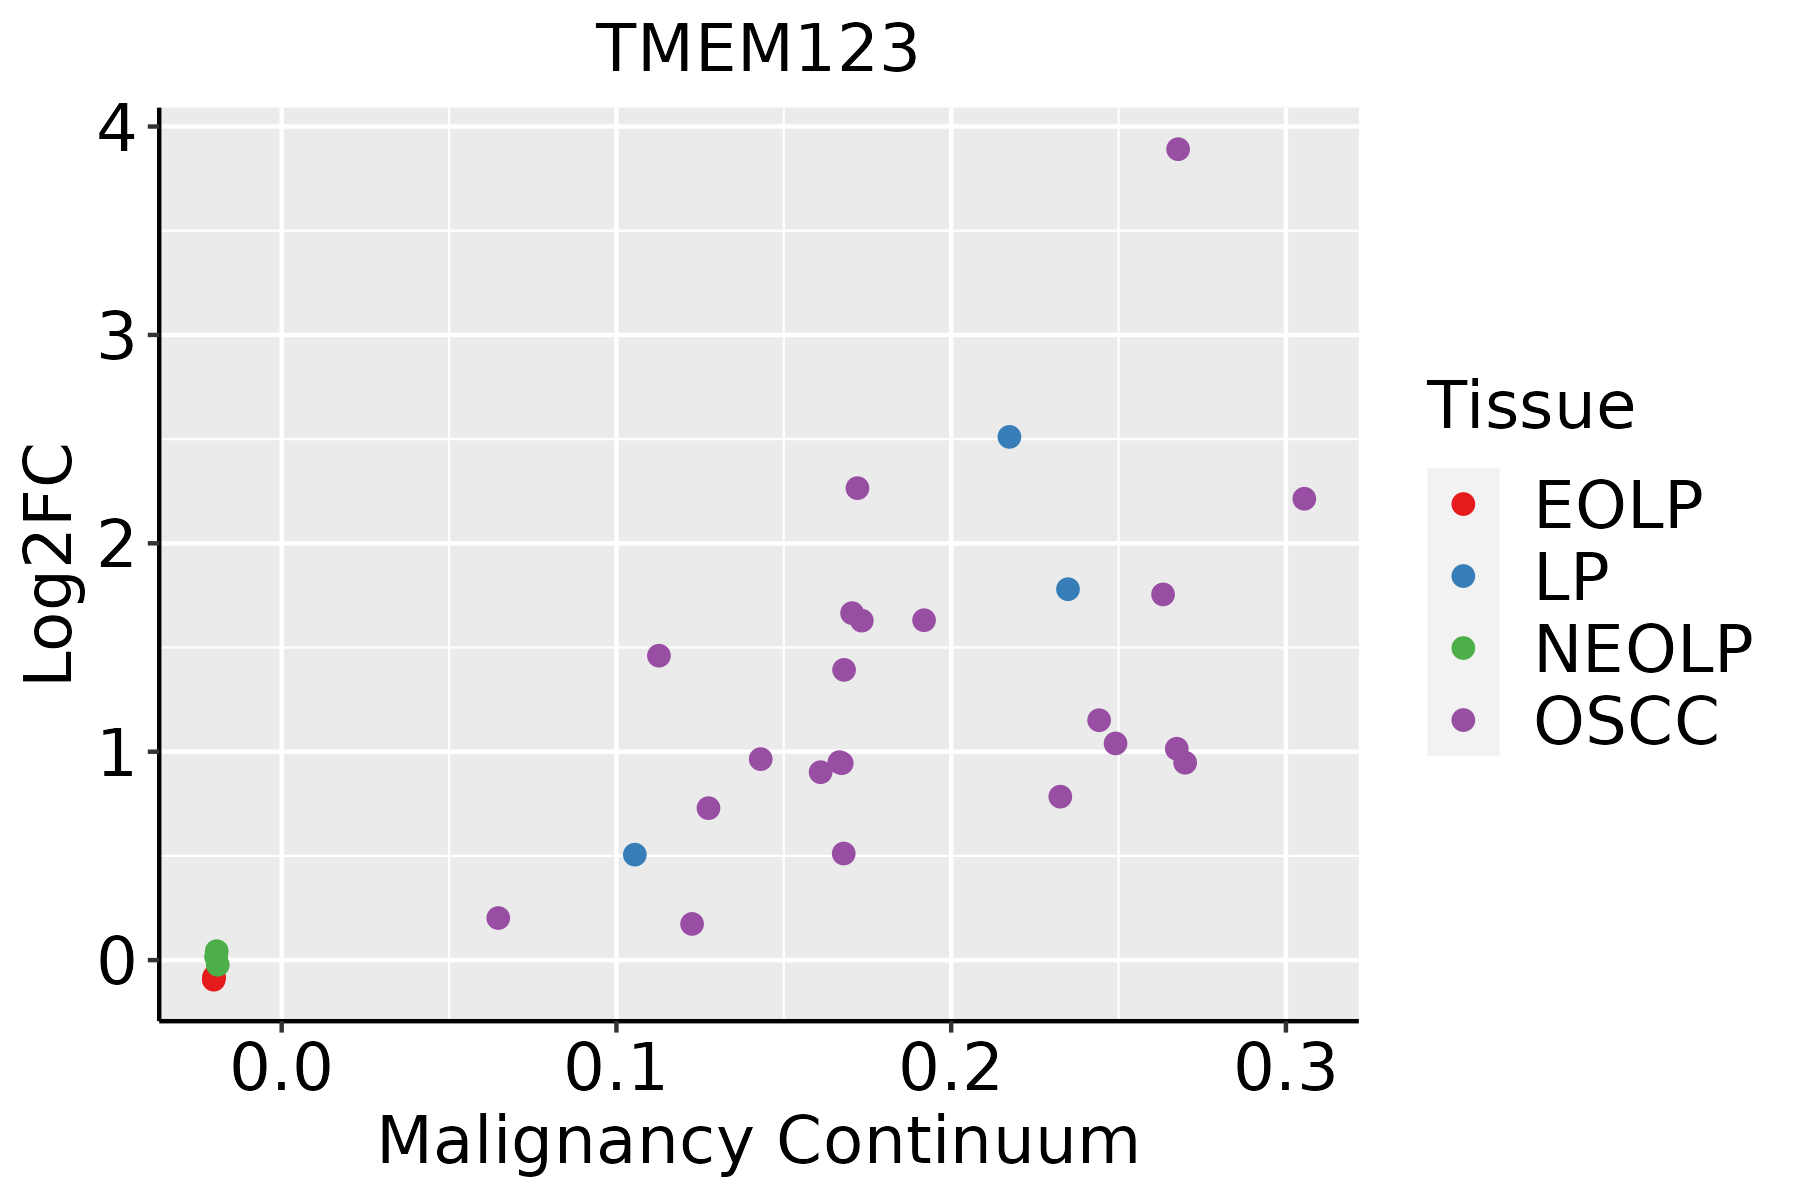
EOLP: Erosive Oral lichen planus
LP: leukoplakia
NEOLP: Non-erosive oral lichen planus
OSCC: Oral squamous cell carcinoma
ProstateThe image shows the transcriptomic changes along malignancy continuum.log2FC in expression of this searched gene in stem-like cells from each diseased tissue sample relative to stem-like cells in normal samples in each tissue plotted against the malignancy continuum. Samples are colored based on if they are from different disease stage.
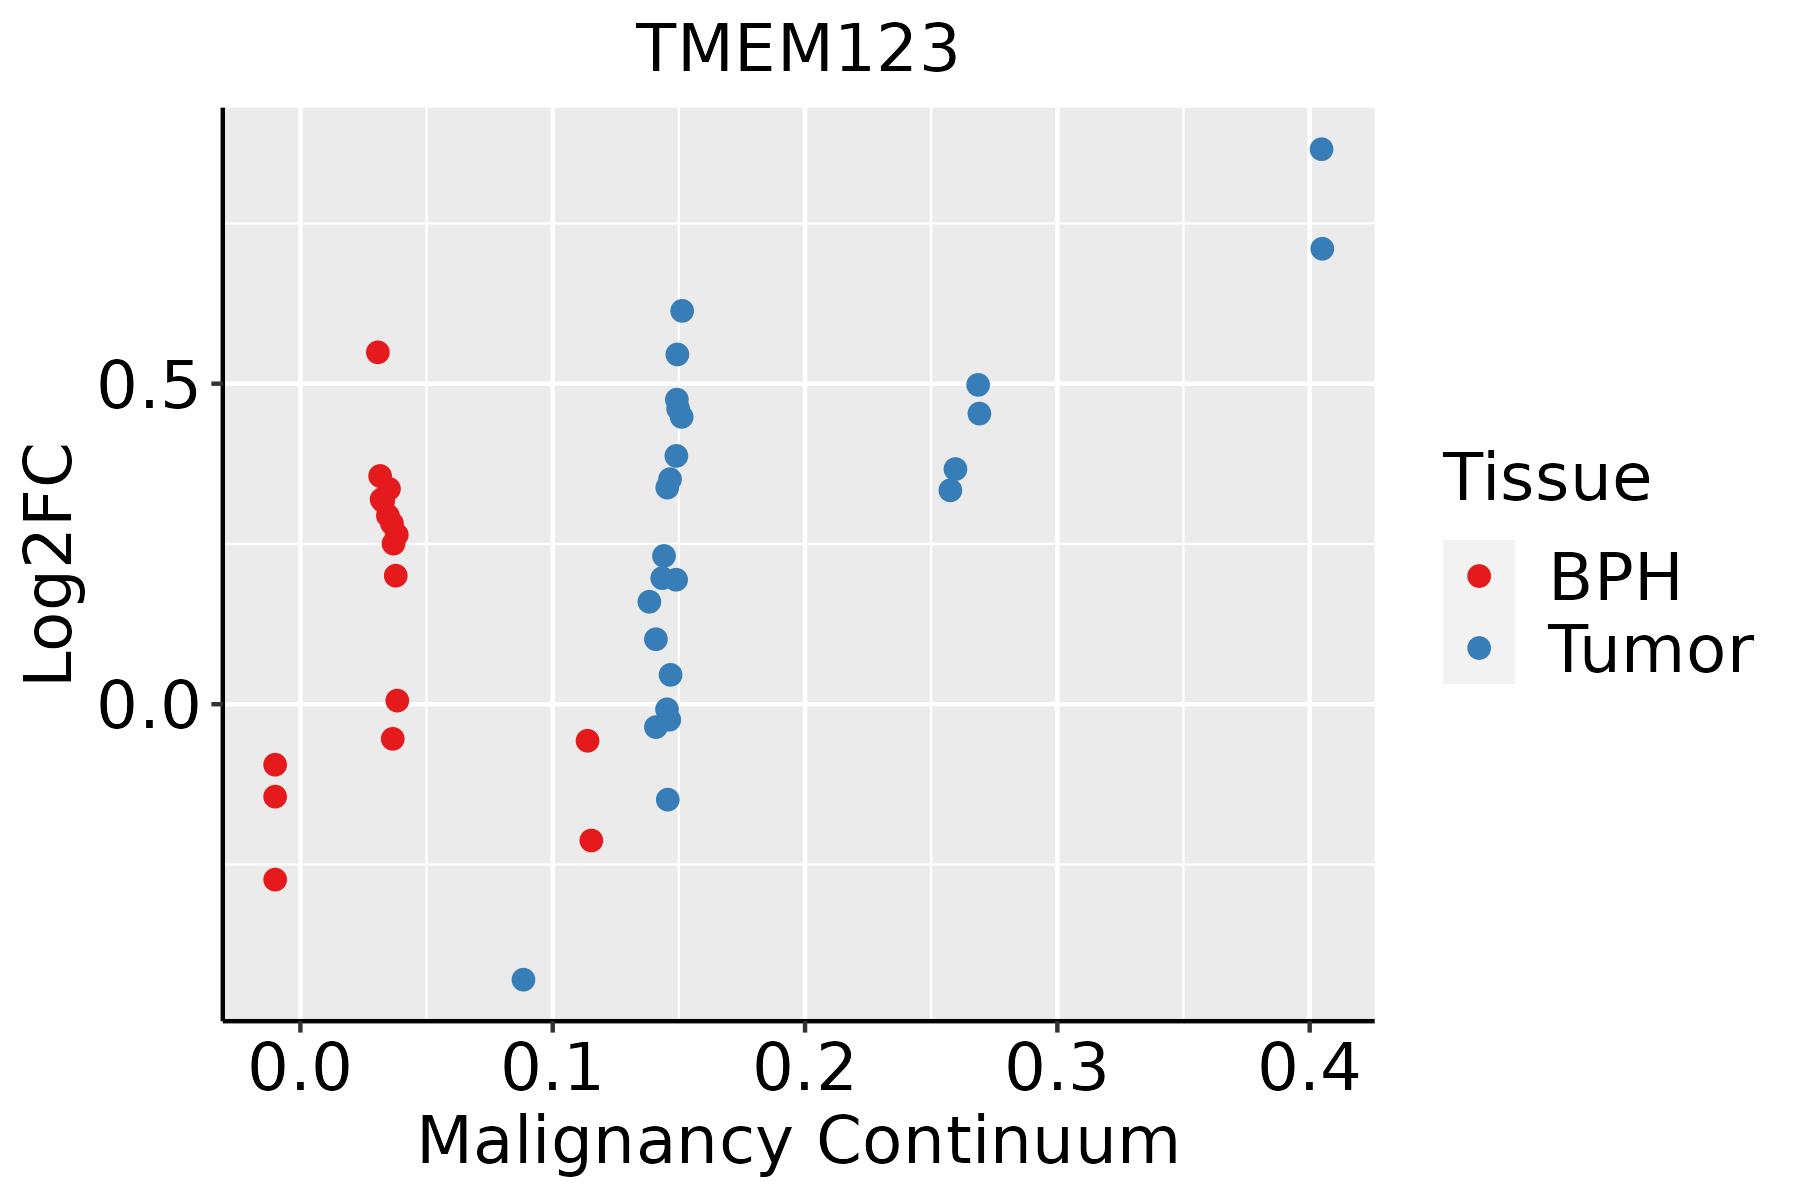
BPH: Benign Prostatic Hyperplasia
SkinThe image shows the transcriptomic changes along malignancy continuum.log2FC in expression of this searched gene in stem-like cells from each diseased tissue sample relative to stem-like cells in normal samples in each tissue plotted against the malignancy continuum. Samples are colored based on if they are from different disease stage.
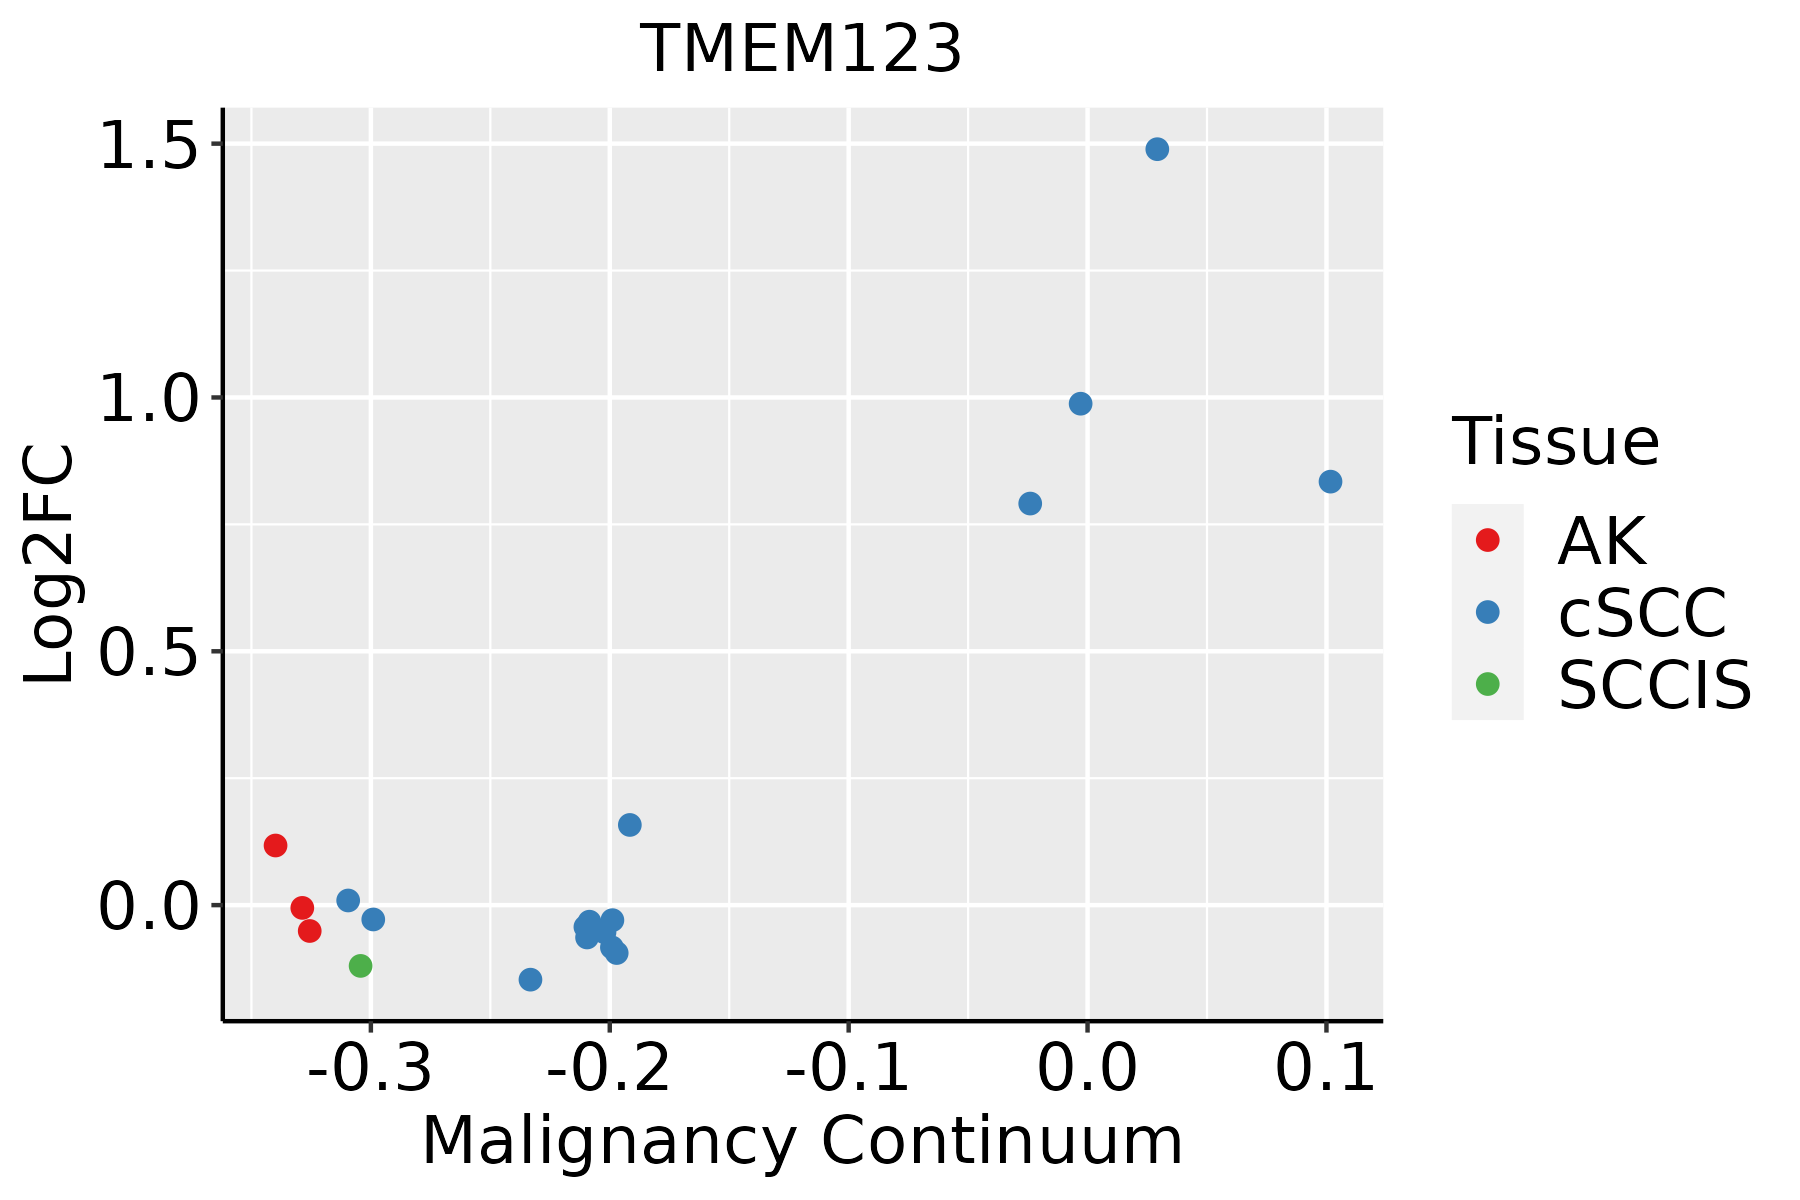
AK: Actinic keratosis
cSCC: Cutaneous squamous cell carcinoma
SCCIS:squamous cell carcinoma in situ
ThyroidThe image shows the transcriptomic changes along malignancy continuum.log2FC in expression of this searched gene in stem-like cells from each diseased tissue sample relative to stem-like cells in normal samples in each tissue plotted against the malignancy continuum. Samples are colored based on if they are from different disease stage.
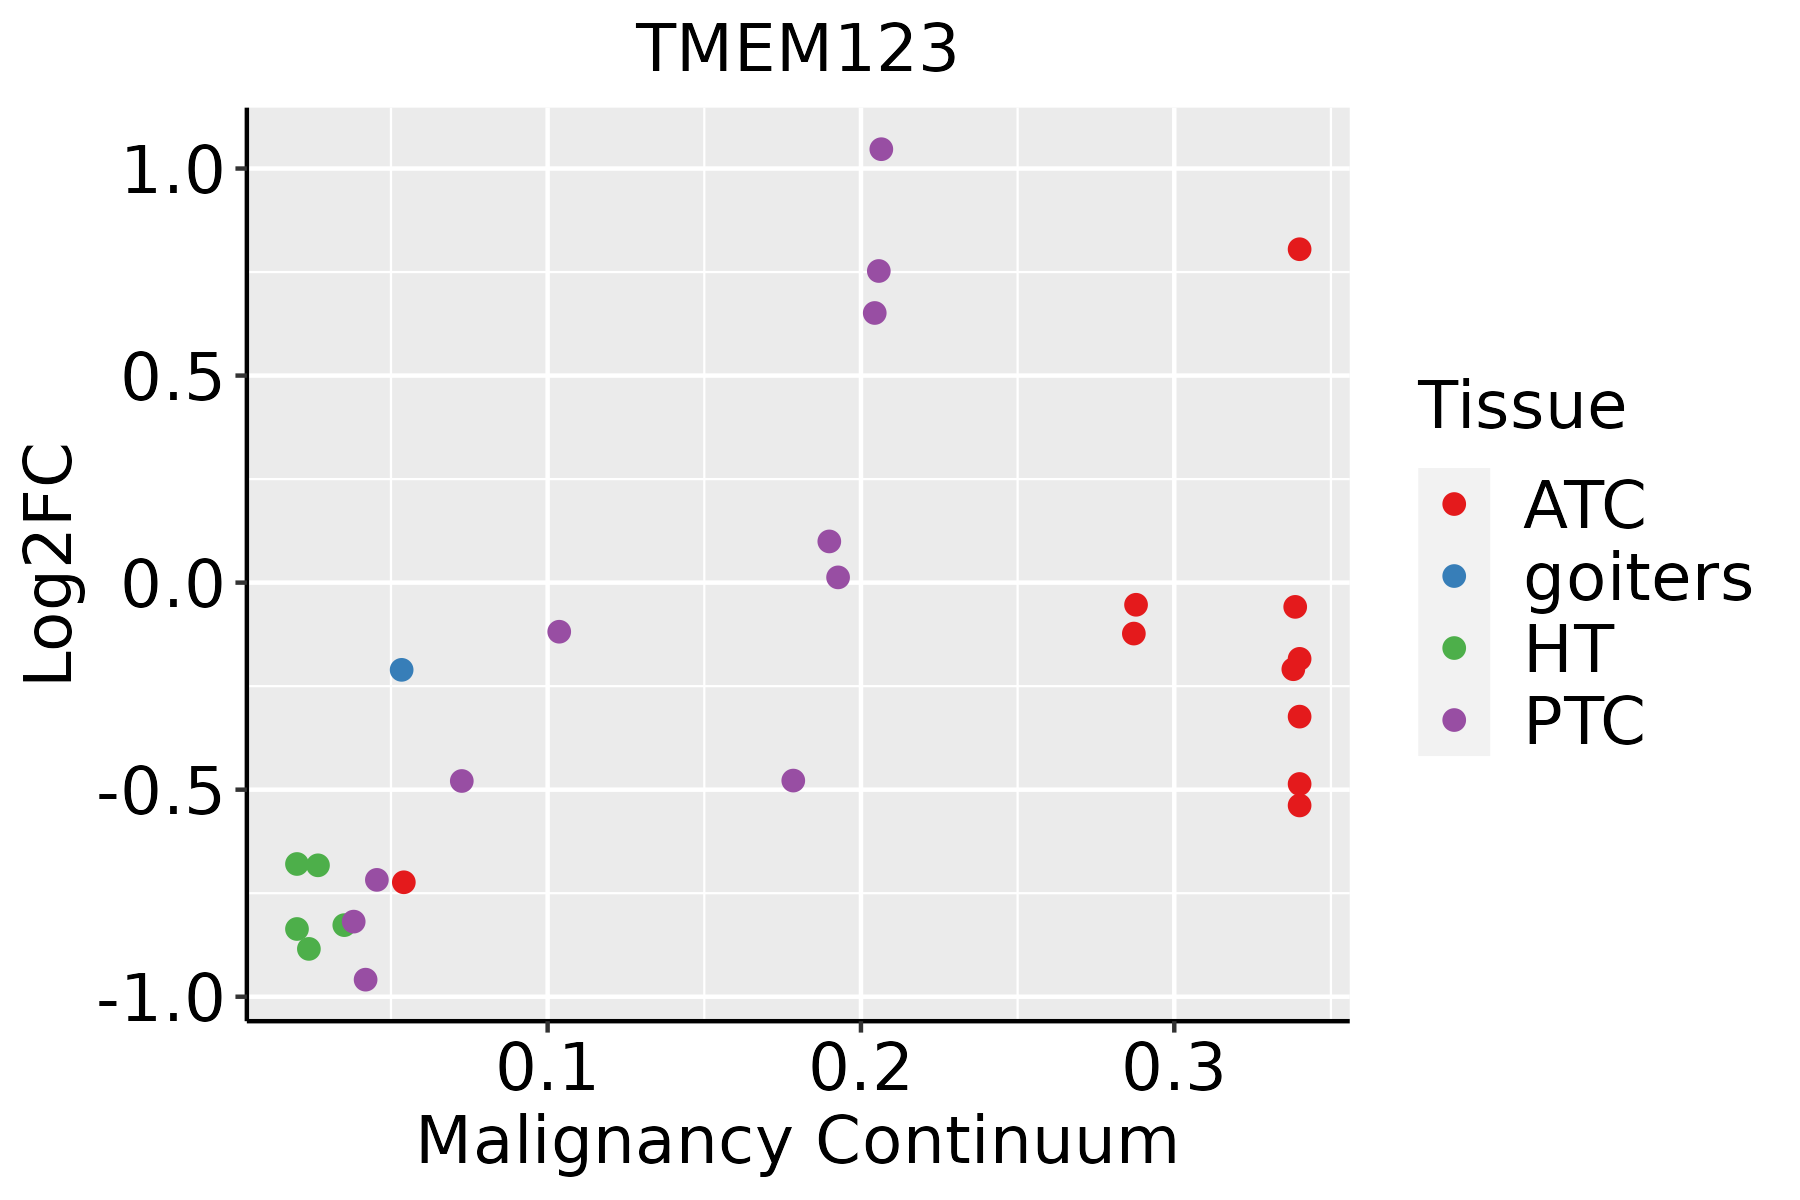
ATC: Anaplastic thyroid cancer
HT: Hashimoto's thyroiditis
PTC: Papillary thyroid cancer
∗log2FC in expression of this searched gene in stem-like cells from each diseased tissue sample relative to stem-like cells in normal samples in each tissue plotted against the malignancy continuum. Samples are colored based on if they are from different disease stage.

Top

Malignant transformation related pathway analysis

check buttonFind out the enriched GO biological processes and KEGG pathways involved in transition from healthy to precancer to cancer
check button Figure of enriched GO biological processes.
TissueDisease StageEnriched GO biological Processes
ColorectumADGO analysis - Figure of enriched GO biological processes: Top 15 enriched GO BP terms are showed in the bar plot of each disease state in each tissue. Each row represents a significant GO biological process which is colored according to the -log10(p.adjust).
ColorectumSERGO analysis - Figure of enriched GO biological processes: Top 15 enriched GO BP terms are showed in the bar plot of each disease state in each tissue. Each row represents a significant GO biological process which is colored according to the -log10(p.adjust).
ColorectumMSSGO analysis - Figure of enriched GO biological processes: Top 15 enriched GO BP terms are showed in the bar plot of each disease state in each tissue. Each row represents a significant GO biological process which is colored according to the -log10(p.adjust).
ColorectumMSI-HGO analysis - Figure of enriched GO biological processes: Top 15 enriched GO BP terms are showed in the bar plot of each disease state in each tissue. Each row represents a significant GO biological process which is colored according to the -log10(p.adjust).
ColorectumFAPGO analysis - Figure of enriched GO biological processes: Top 15 enriched GO BP terms are showed in the bar plot of each disease state in each tissue. Each row represents a significant GO biological process which is colored according to the -log10(p.adjust).
∗Top 15 enriched GO BP terms are showed in the bar plot of each disease state in each tissue. Each row represents a significant GO biological process which is colored according to the -log10(p.adjust).
Page: 1 2 3 4 5 6 7 8 9 

check button Enriched GO biological processes.
GO IDTissueDisease StageDescriptionGene RatioBg Ratiopvaluep.adjustCount
GO:0070265BreastPrecancernecrotic cell death11/108062/187237.54e-049.01e-0311
GO:00325358BreastIDCregulation of cellular component size45/1434383/187232.72e-032.41e-0245
GO:00702651BreastIDCnecrotic cell death11/143462/187236.92e-034.79e-0211
GO:003253514BreastDCISregulation of cellular component size44/1390383/187232.58e-032.30e-0244
GO:00702652BreastDCISnecrotic cell death11/139062/187235.50e-034.01e-0211
GO:003253510EndometriumAEHregulation of cellular component size78/2100383/187231.10e-075.29e-0678
GO:00083616EndometriumAEHregulation of cell size38/2100181/187239.69e-051.40e-0338
GO:003253516EndometriumEECregulation of cellular component size79/2168383/187231.98e-078.93e-0679
GO:000836111EndometriumEECregulation of cell size39/2168181/187238.72e-051.24e-0339
GO:003253520EsophagusESCCregulation of cellular component size227/8552383/187234.77e-088.60e-07227
GO:00083619EsophagusESCCregulation of cell size107/8552181/187231.81e-041.16e-03107
GO:00702654EsophagusESCCnecrotic cell death39/855262/187234.68e-031.82e-0239
GO:00325356LiverNAFLDregulation of cellular component size55/1882383/187234.31e-033.55e-0255
GO:003253512LiverCirrhoticregulation of cellular component size135/4634383/187232.32e-064.26e-05135
GO:003253522LiverHCCregulation of cellular component size217/7958383/187231.28e-083.14e-07217
GO:00083614LiverHCCregulation of cell size95/7958181/187234.15e-031.81e-0295
GO:003253519Oral cavityOSCCregulation of cellular component size201/7305383/187234.80e-088.88e-07201
GO:00083618Oral cavityOSCCregulation of cell size92/7305181/187237.86e-044.26e-0392
GO:00702653Oral cavityOSCCnecrotic cell death34/730562/187238.23e-033.00e-0234
GO:0032535110Oral cavityLPregulation of cellular component size128/4623383/187236.56e-058.80e-04128
Page: 1 2 

check button Enriched KEGG pathways.
Pathway IDTissueDisease StageDescriptionGene RatioBg Ratiopvaluep.adjustqvalueCount
Page: 1 

Top

Cell-cell communication analysis

check buttonIdentification of potential cell-cell interactions between two cell types and their ligand-receptor pairs for different disease states
LigandReceptorLRpairPathwayTissueDisease Stage
Page: 1 

Top

Single-cell gene regulatory network inference analysis

check buttonFind out the significant the regulons (TFs) and the target genes of each regulon across cell types for different disease states
TFCell TypeTissueDisease StageTarget GeneRSSRegulon Activity
∗The dot plots of a searched regulon are shown for all cell subpopulations in each disease state of each tissue based on the regulon specific score inferred using pySCENIC and by calculating the average expression.
Page: 1 

Top

Somatic mutation of malignant transformation related genes

check buttonAnnotation of somatic variants for genes involved in malignant transformation
Hugo SymbolVariant ClassVariant ClassificationdbSNP RSHGVScHGVSpHGVSp ShortSWISSPROTBIOTYPESIFTPolyPhenTumor Sample BarcodeTissueHistologySexAgeStageTherapy TypesDrugsOutcome
TMEM123insertionFrame_Shift_Insnovelc.230_231insCGATACCGAAp.Ala78AspfsTer9p.A78Dfs*9Q8N131protein_codingTCGA-AO-A0JC-01Breastbreast invasive carcinomaFemale<65I/IIChemotherapyfluorouracilSD
TMEM123SNVMissense_Mutationc.497N>Ap.Thr166Asnp.T166NQ8N131protein_codingdeleterious(0.04)probably_damaging(0.952)TCGA-AG-A002-01Colorectumrectum adenocarcinomaMale<65I/IIUnknownUnknownSD
TMEM123SNVMissense_Mutationnovelc.403N>Ap.Val135Ilep.V135IQ8N131protein_codingdeleterious(0.05)benign(0.003)TCGA-A5-A0G2-01Endometriumuterine corpus endometrioid carcinomaFemale<65III/IVUnknownUnknownSD
TMEM123SNVMissense_Mutationnovelc.604N>Tp.Asp202Tyrp.D202YQ8N131protein_codingdeleterious(0)probably_damaging(1)TCGA-AP-A1E0-01Endometriumuterine corpus endometrioid carcinomaFemale<65III/IVChemotherapypaclitaxelSD
TMEM123SNVMissense_Mutationnovelc.254C>Tp.Thr85Metp.T85MQ8N131protein_codingdeleterious(0)probably_damaging(0.954)TCGA-AX-A06F-01Endometriumuterine corpus endometrioid carcinomaFemale<65III/IVChemotherapycarboplatinSD
TMEM123SNVMissense_Mutationnovelc.617C>Tp.Ala206Valp.A206VQ8N131protein_codingdeleterious(0)probably_damaging(0.999)TCGA-AX-A0J1-01Endometriumuterine corpus endometrioid carcinomaFemale>=65I/IIUnknownUnknownSD
TMEM123SNVMissense_Mutationnovelc.521N>Cp.Val174Alap.V174AQ8N131protein_codingtolerated(0.09)benign(0.403)TCGA-AX-A2HD-01Endometriumuterine corpus endometrioid carcinomaFemale>=65III/IVUnknownUnknownSD
TMEM123SNVMissense_Mutationnovelc.547N>Ap.Leu183Ilep.L183IQ8N131protein_codingdeleterious(0.01)probably_damaging(0.964)TCGA-BS-A0UV-01Endometriumuterine corpus endometrioid carcinomaFemale<65III/IVUnknownUnknownSD
TMEM123SNVMissense_Mutationnovelc.117G>Tp.Glu39Aspp.E39DQ8N131protein_codingtolerated(0.6)benign(0.042)TCGA-D1-A103-01Endometriumuterine corpus endometrioid carcinomaFemale>=65I/IIUnknownUnknownSD
TMEM123insertionIn_Frame_Insnovelc.230_231insACCGAAp.Val77_Ala78insProAsnp.V77_A78insPNQ8N131protein_codingTCGA-A5-A0R9-01Endometriumuterine corpus endometrioid carcinomaFemale<65I/IIUnknownUnknownSD
Page: 1 2 3 

Top

Related drugs of malignant transformation related genes

check buttonIdentification of chemicals and drugs interact with genes involved in malignant transfromation
(DGIdb 4.0)
Entrez IDSymbolCategoryInteraction TypesDrug Claim NameDrug NamePMIDs
Page: 1