
|
|||||
|
 | |
| |
| |
| |
| |
| |
|
Gene: TMCC1 |
Gene summary for TMCC1 |
| Gene information | Species | Human | Gene symbol | TMCC1 | Gene ID | 23023 |
| Gene name | transmembrane and coiled-coil domain family 1 | |
| Gene Alias | TMCC1 | |
| Cytomap | 3q22.1 | |
| Gene Type | protein-coding | GO ID | GO:0006810 | UniProtAcc | O94876 |
Top |
Malignant transformation analysis |
| Identification of the aberrant gene expression in precancerous and cancerous lesions by comparing the gene expression of stem-like cells in diseased tissues with normal stem cells |
| Entrez ID | Symbol | Replicates | Species | Organ | Tissue | Adj P-value | Log2FC | Malignancy |
| 23023 | TMCC1 | EEC-subject5 | Human | Endometrium | EEC | 4.15e-20 | 6.58e-01 | -0.249 |
| 23023 | TMCC1 | GSM5276934 | Human | Endometrium | EEC | 9.21e-03 | -1.36e-01 | -0.0913 |
| 23023 | TMCC1 | GSM6177620_NYU_UCEC1_lib1_lib1 | Human | Endometrium | EEC | 3.98e-02 | -1.18e-01 | -0.1869 |
| 23023 | TMCC1 | GSM6177620_NYU_UCEC1_lib2_lib2 | Human | Endometrium | EEC | 3.23e-03 | -9.71e-02 | -0.1875 |
| 23023 | TMCC1 | GSM6177620_NYU_UCEC1_lib3_lib3 | Human | Endometrium | EEC | 1.62e-05 | -1.04e-01 | -0.1883 |
| 23023 | TMCC1 | GSM6177621_NYU_UCEC2_lib1_lib1 | Human | Endometrium | EEC | 2.31e-11 | 1.68e-01 | -0.1934 |
| 23023 | TMCC1 | GSM6177622_NYU_UCEC3_lib1_lib1 | Human | Endometrium | EEC | 2.83e-16 | 4.21e-04 | -0.1917 |
| 23023 | TMCC1 | GSM6177622_NYU_UCEC3_lib2_lib2 | Human | Endometrium | EEC | 5.88e-06 | 3.10e-02 | -0.1916 |
| 23023 | TMCC1 | LZE4T | Human | Esophagus | ESCC | 4.38e-06 | 2.02e-01 | 0.0811 |
| 23023 | TMCC1 | LZE7T | Human | Esophagus | ESCC | 2.31e-02 | 2.78e-01 | 0.0667 |
| 23023 | TMCC1 | LZE20T | Human | Esophagus | ESCC | 1.83e-05 | 1.35e-01 | 0.0662 |
| 23023 | TMCC1 | LZE24T | Human | Esophagus | ESCC | 4.66e-09 | 3.27e-01 | 0.0596 |
| 23023 | TMCC1 | P1T-E | Human | Esophagus | ESCC | 7.25e-05 | 2.55e-01 | 0.0875 |
| 23023 | TMCC1 | P2T-E | Human | Esophagus | ESCC | 1.30e-27 | 5.27e-01 | 0.1177 |
| 23023 | TMCC1 | P4T-E | Human | Esophagus | ESCC | 4.55e-09 | 3.00e-01 | 0.1323 |
| 23023 | TMCC1 | P5T-E | Human | Esophagus | ESCC | 6.20e-12 | 1.54e-01 | 0.1327 |
| 23023 | TMCC1 | P8T-E | Human | Esophagus | ESCC | 8.03e-33 | 4.76e-01 | 0.0889 |
| 23023 | TMCC1 | P9T-E | Human | Esophagus | ESCC | 4.58e-21 | 5.57e-01 | 0.1131 |
| 23023 | TMCC1 | P10T-E | Human | Esophagus | ESCC | 6.45e-21 | 3.27e-01 | 0.116 |
| 23023 | TMCC1 | P11T-E | Human | Esophagus | ESCC | 3.05e-06 | 2.96e-01 | 0.1426 |
| Page: 1 2 3 4 5 6 7 8 9 10 |
| Tissue | Expression Dynamics | Abbreviation |
| Cervix | 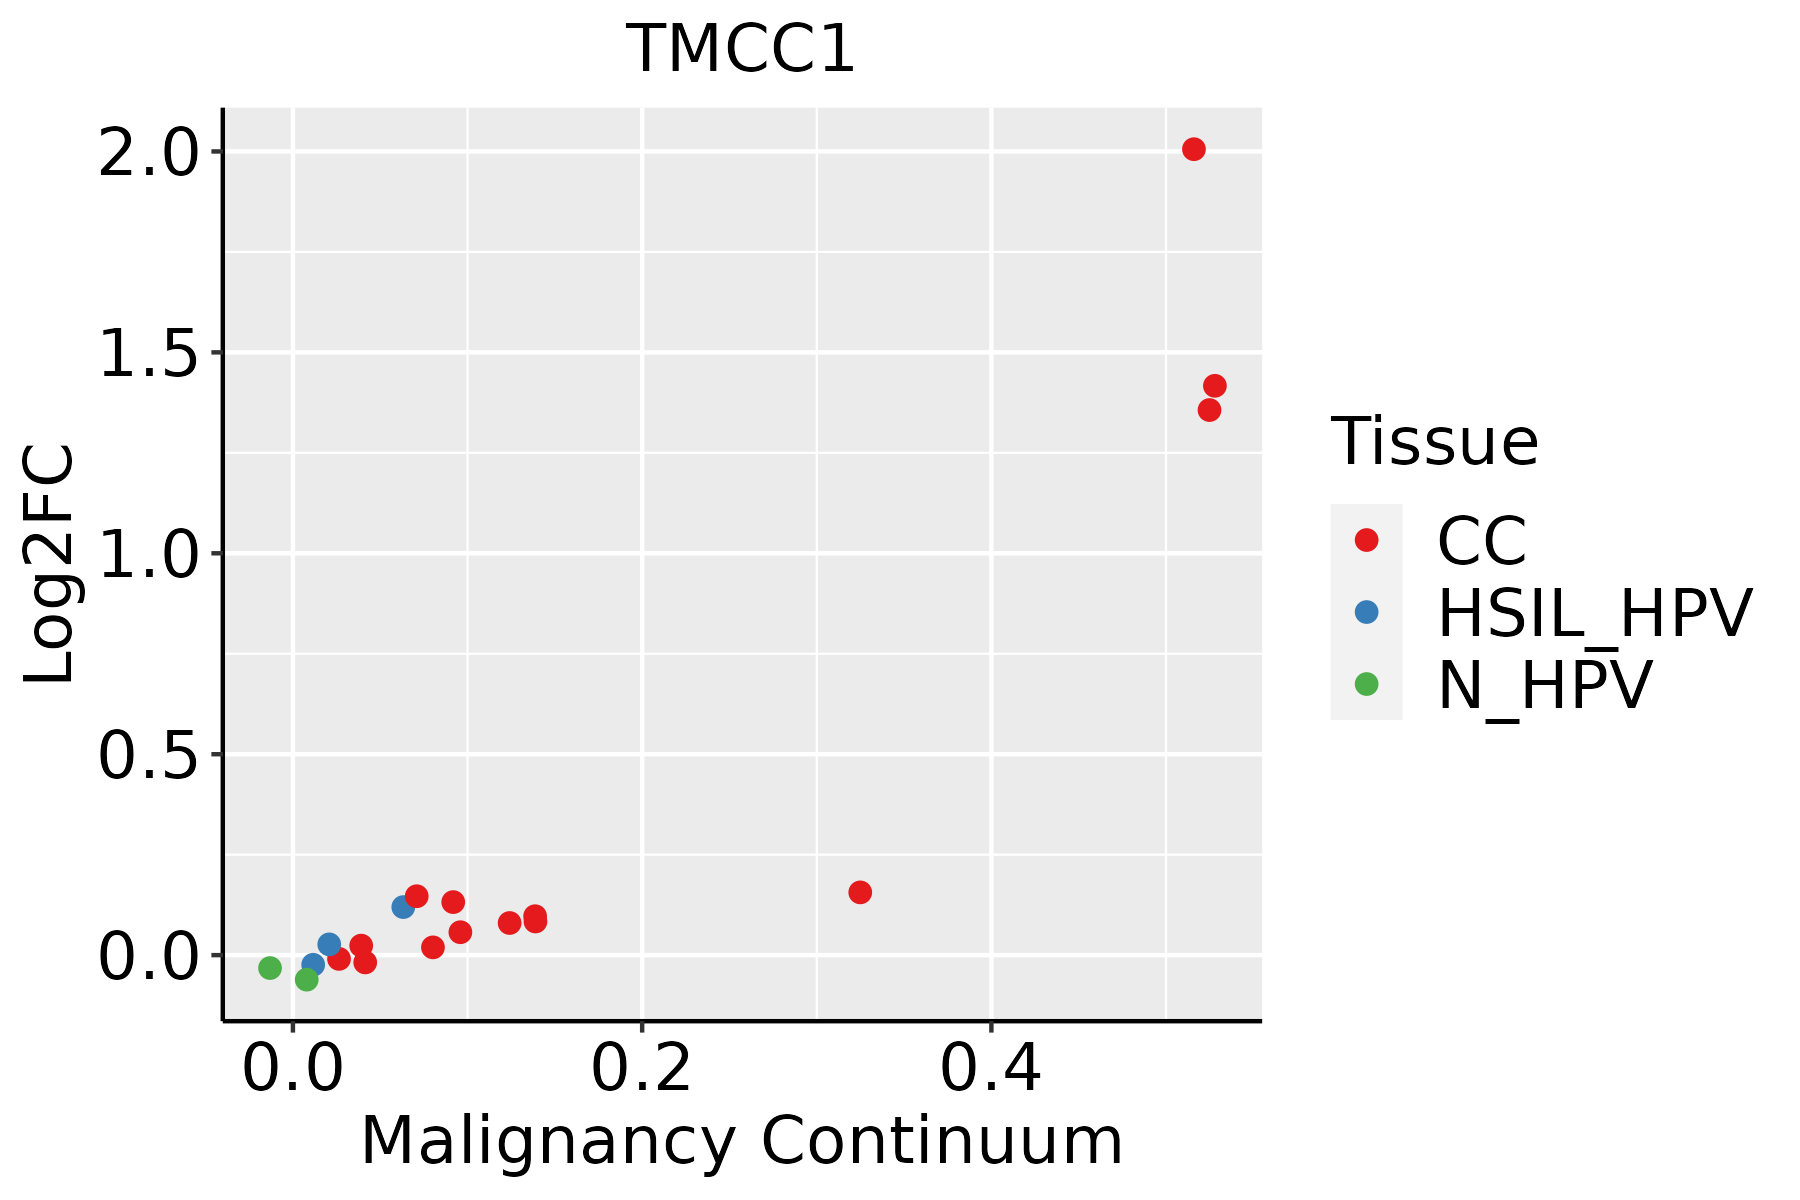 | CC: Cervix cancer |
| HSIL_HPV: HPV-infected high-grade squamous intraepithelial lesions | ||
| N_HPV: HPV-infected normal cervix | ||
| Colorectum (GSE201348) |  | FAP: Familial adenomatous polyposis |
| CRC: Colorectal cancer | ||
| Colorectum (HTA11) |  | AD: Adenomas |
| SER: Sessile serrated lesions | ||
| MSI-H: Microsatellite-high colorectal cancer | ||
| MSS: Microsatellite stable colorectal cancer | ||
| Endometrium | 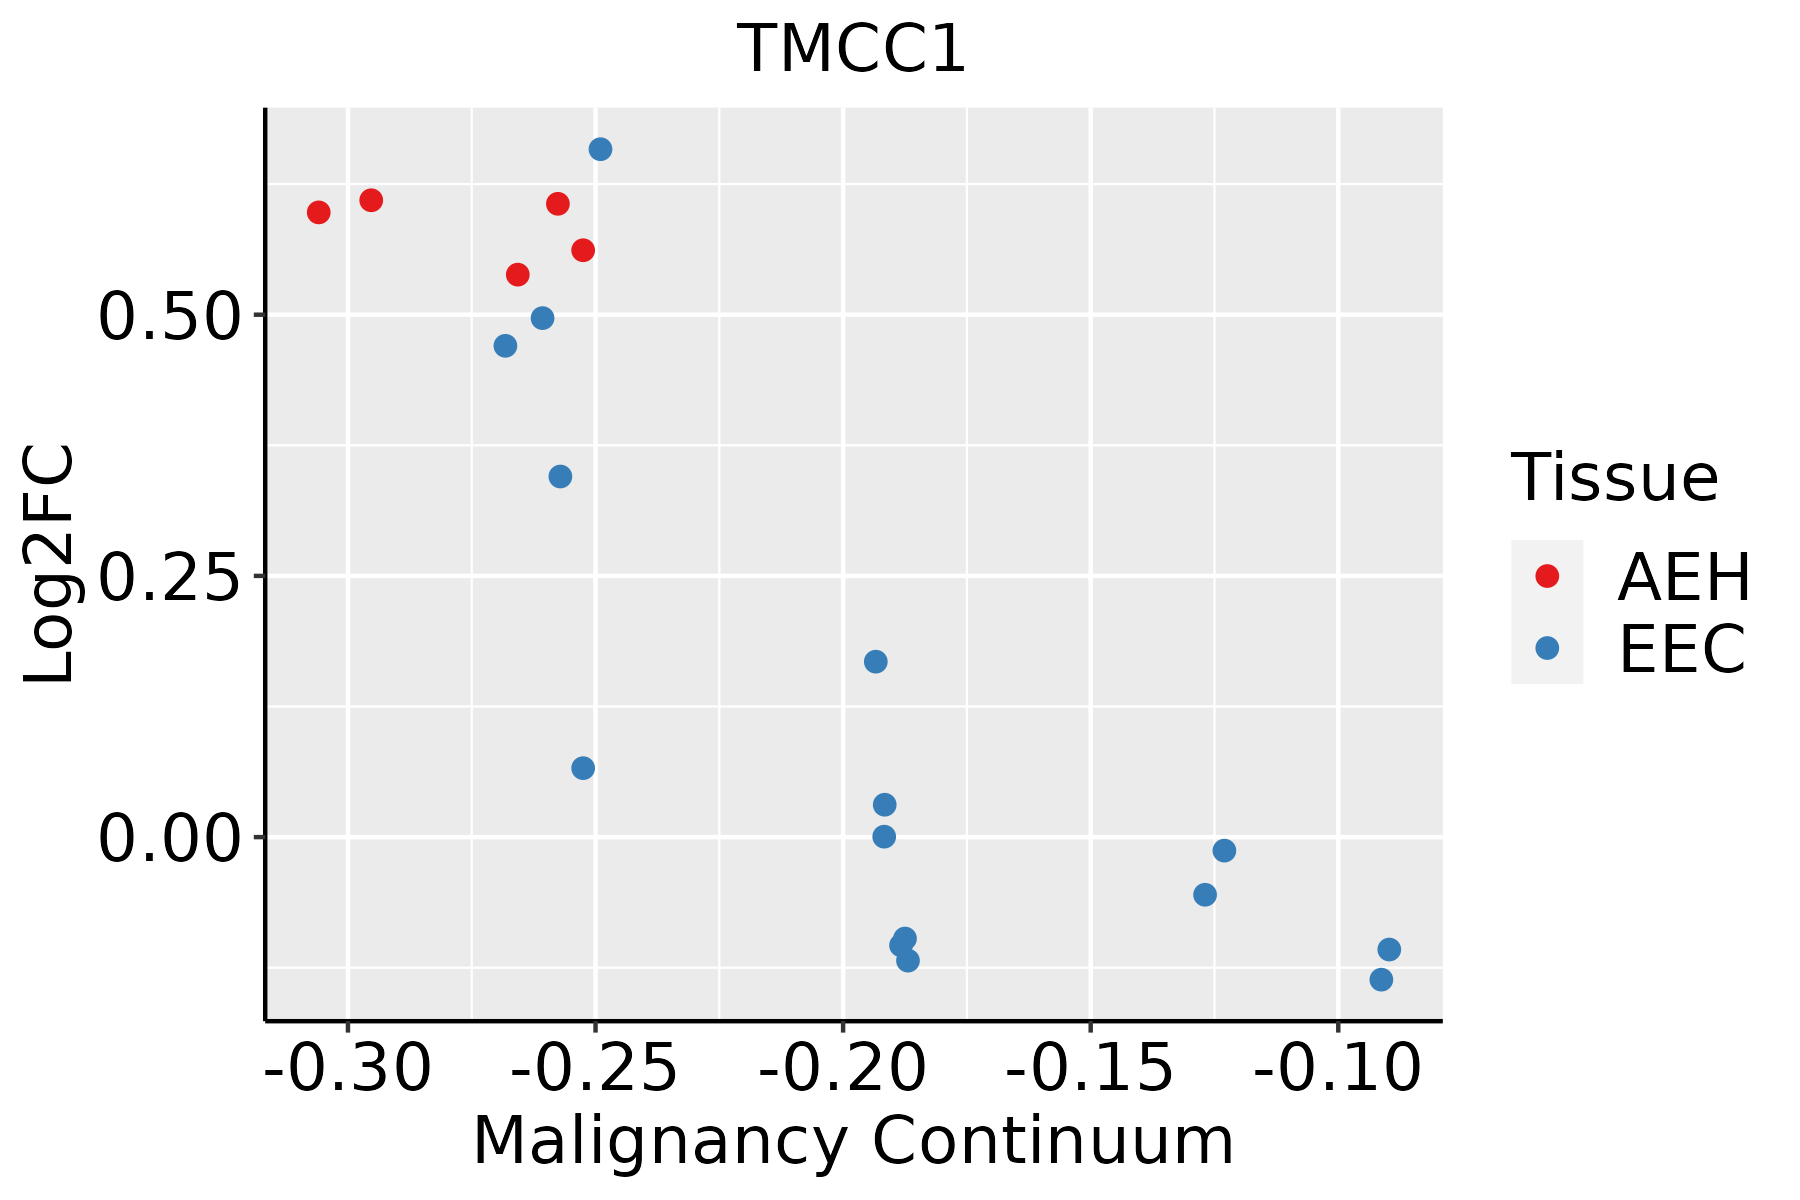 | AEH: Atypical endometrial hyperplasia |
| EEC: Endometrioid Cancer | ||
| Esophagus | 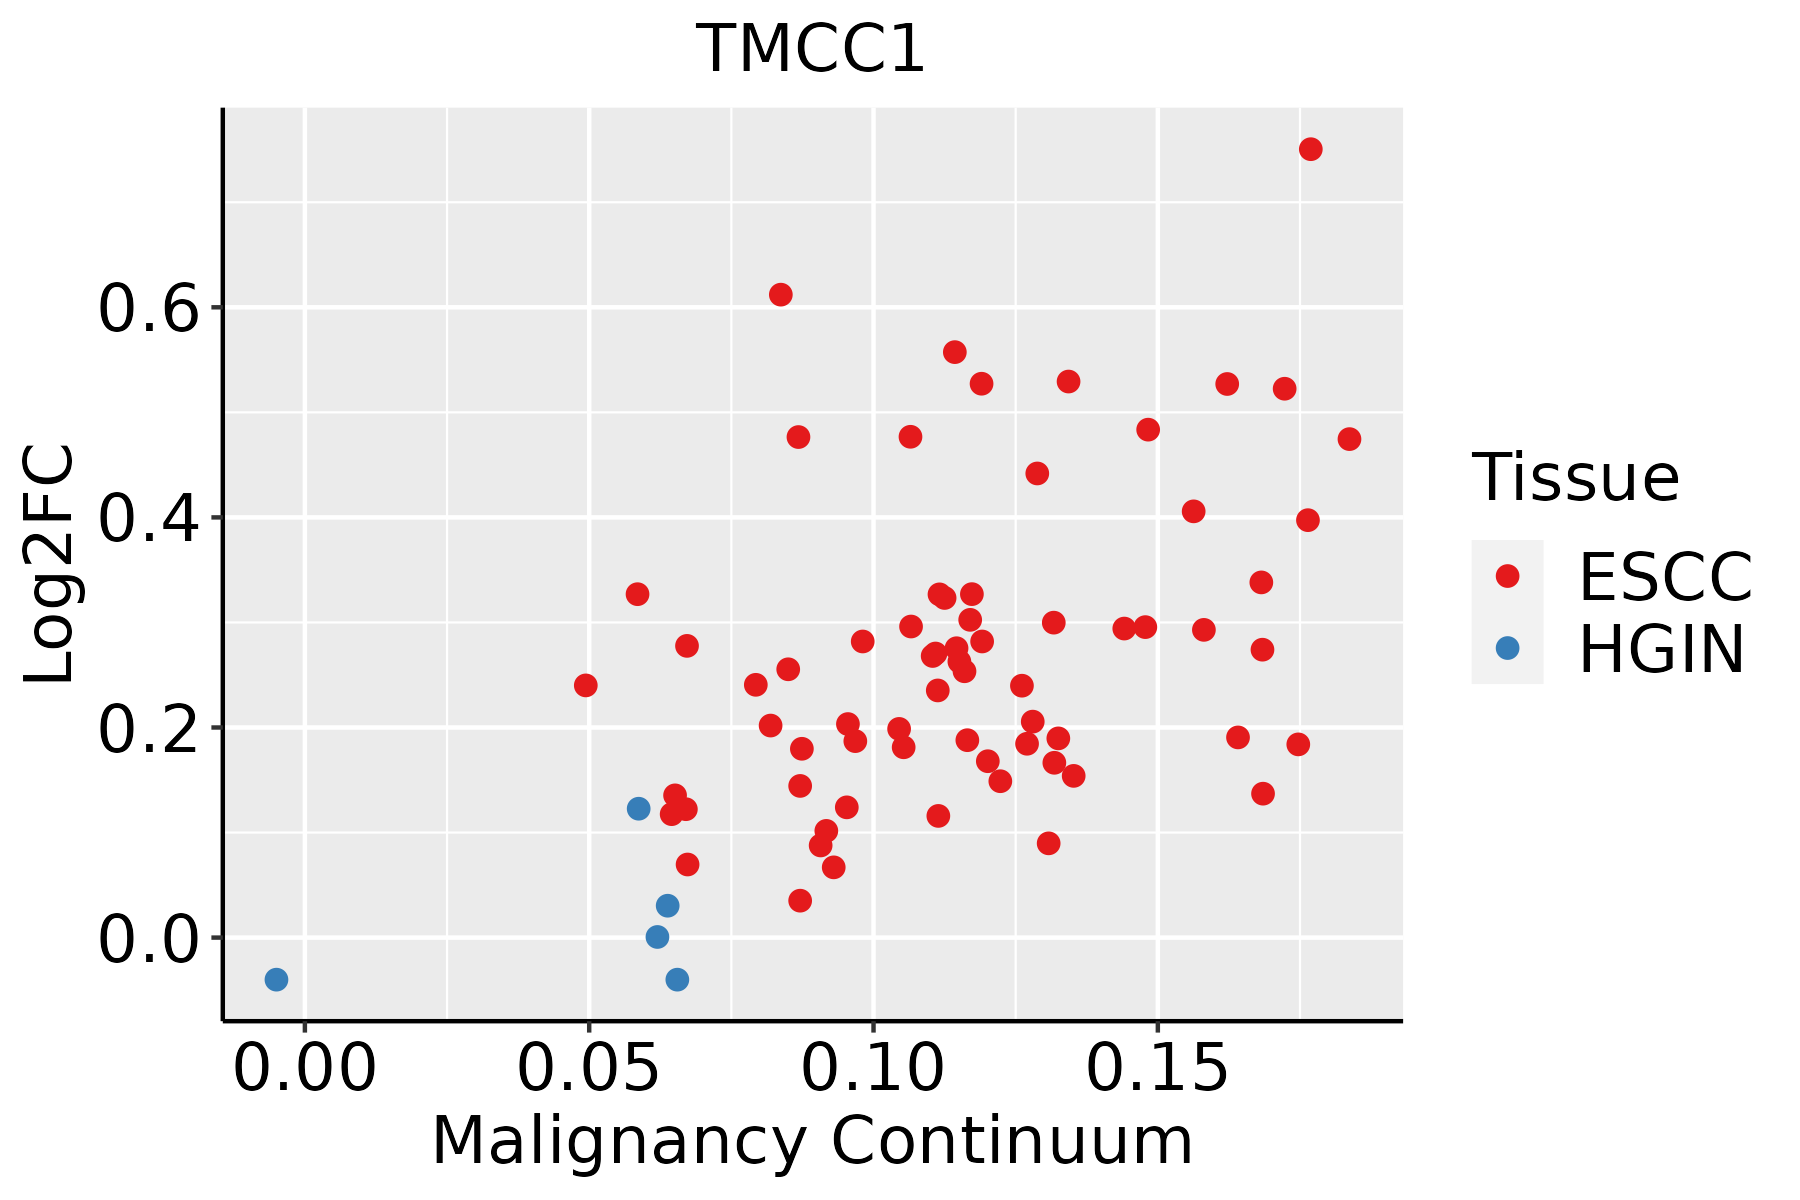 | ESCC: Esophageal squamous cell carcinoma |
| HGIN: High-grade intraepithelial neoplasias | ||
| LGIN: Low-grade intraepithelial neoplasias | ||
| Liver | 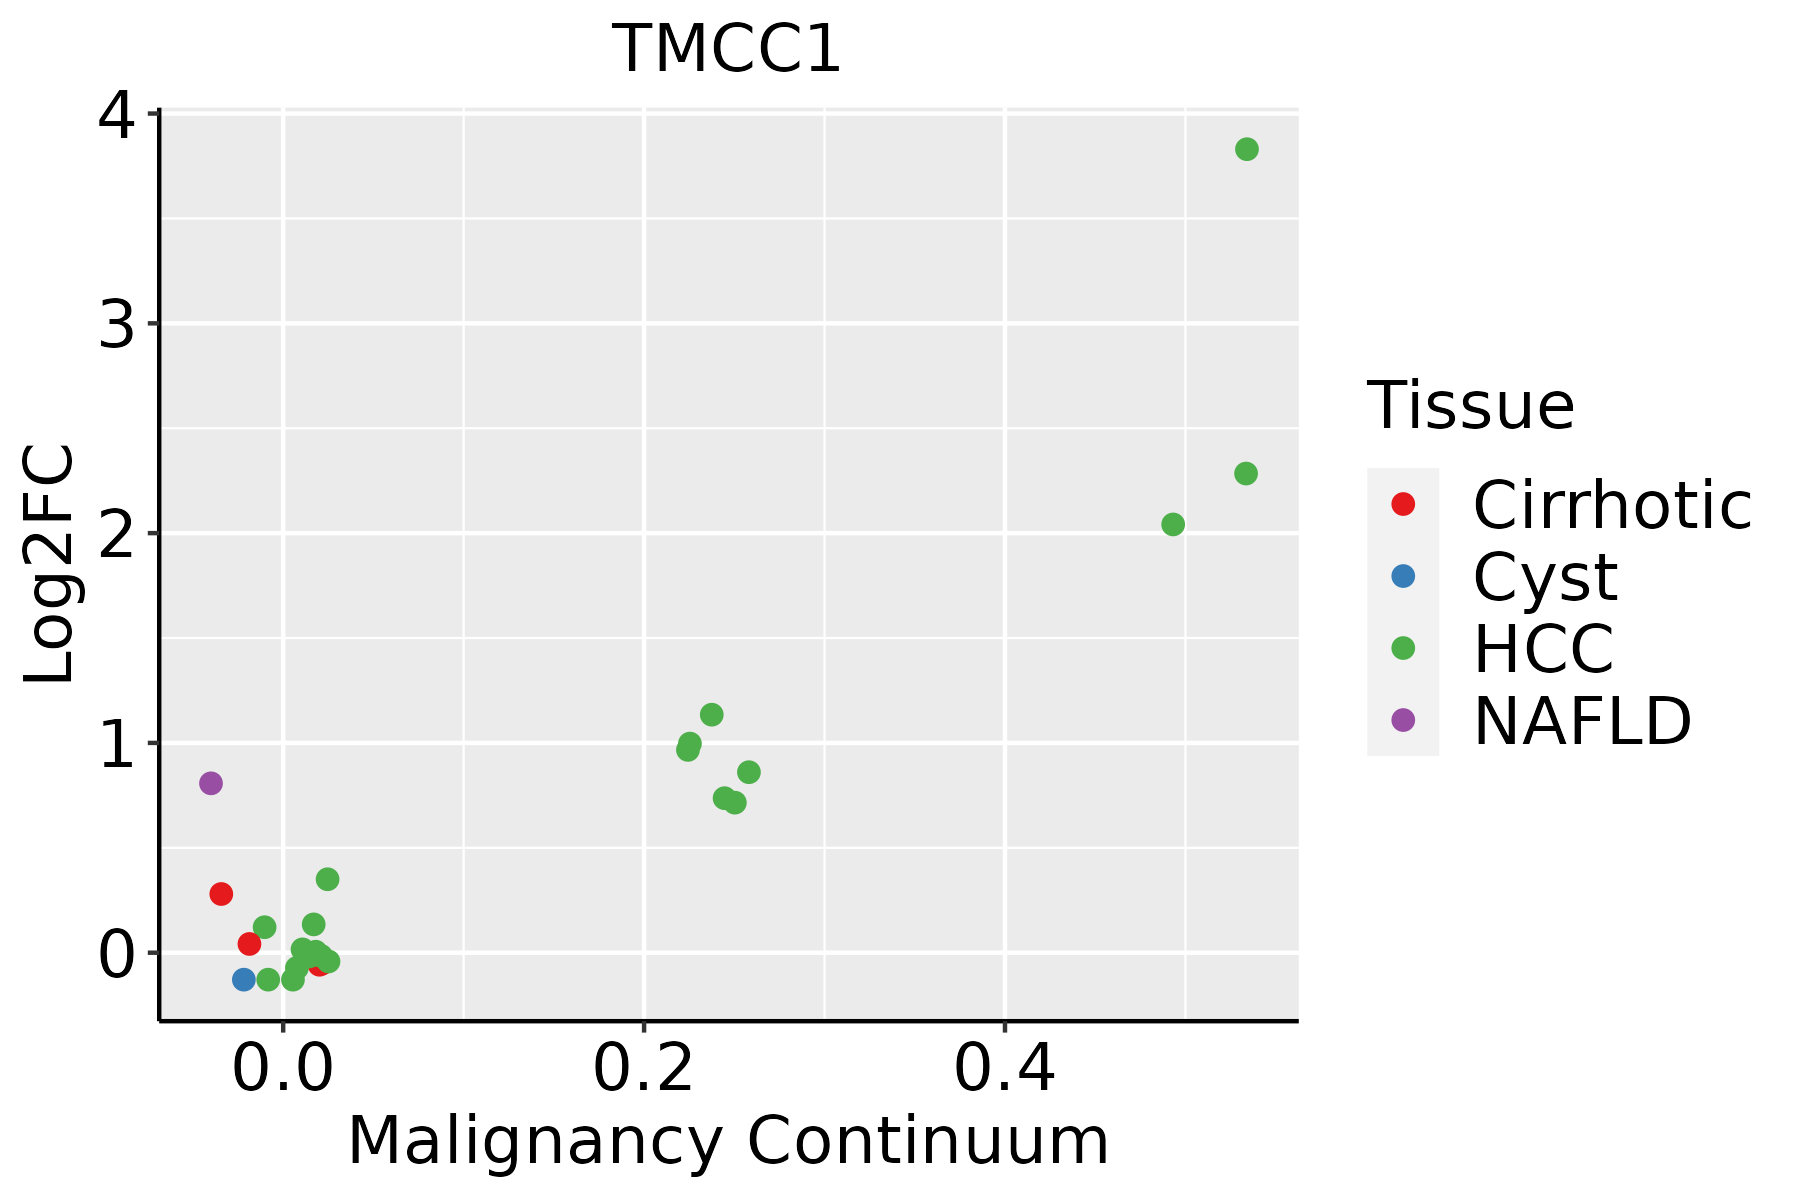 | HCC: Hepatocellular carcinoma |
| NAFLD: Non-alcoholic fatty liver disease | ||
| Lung | 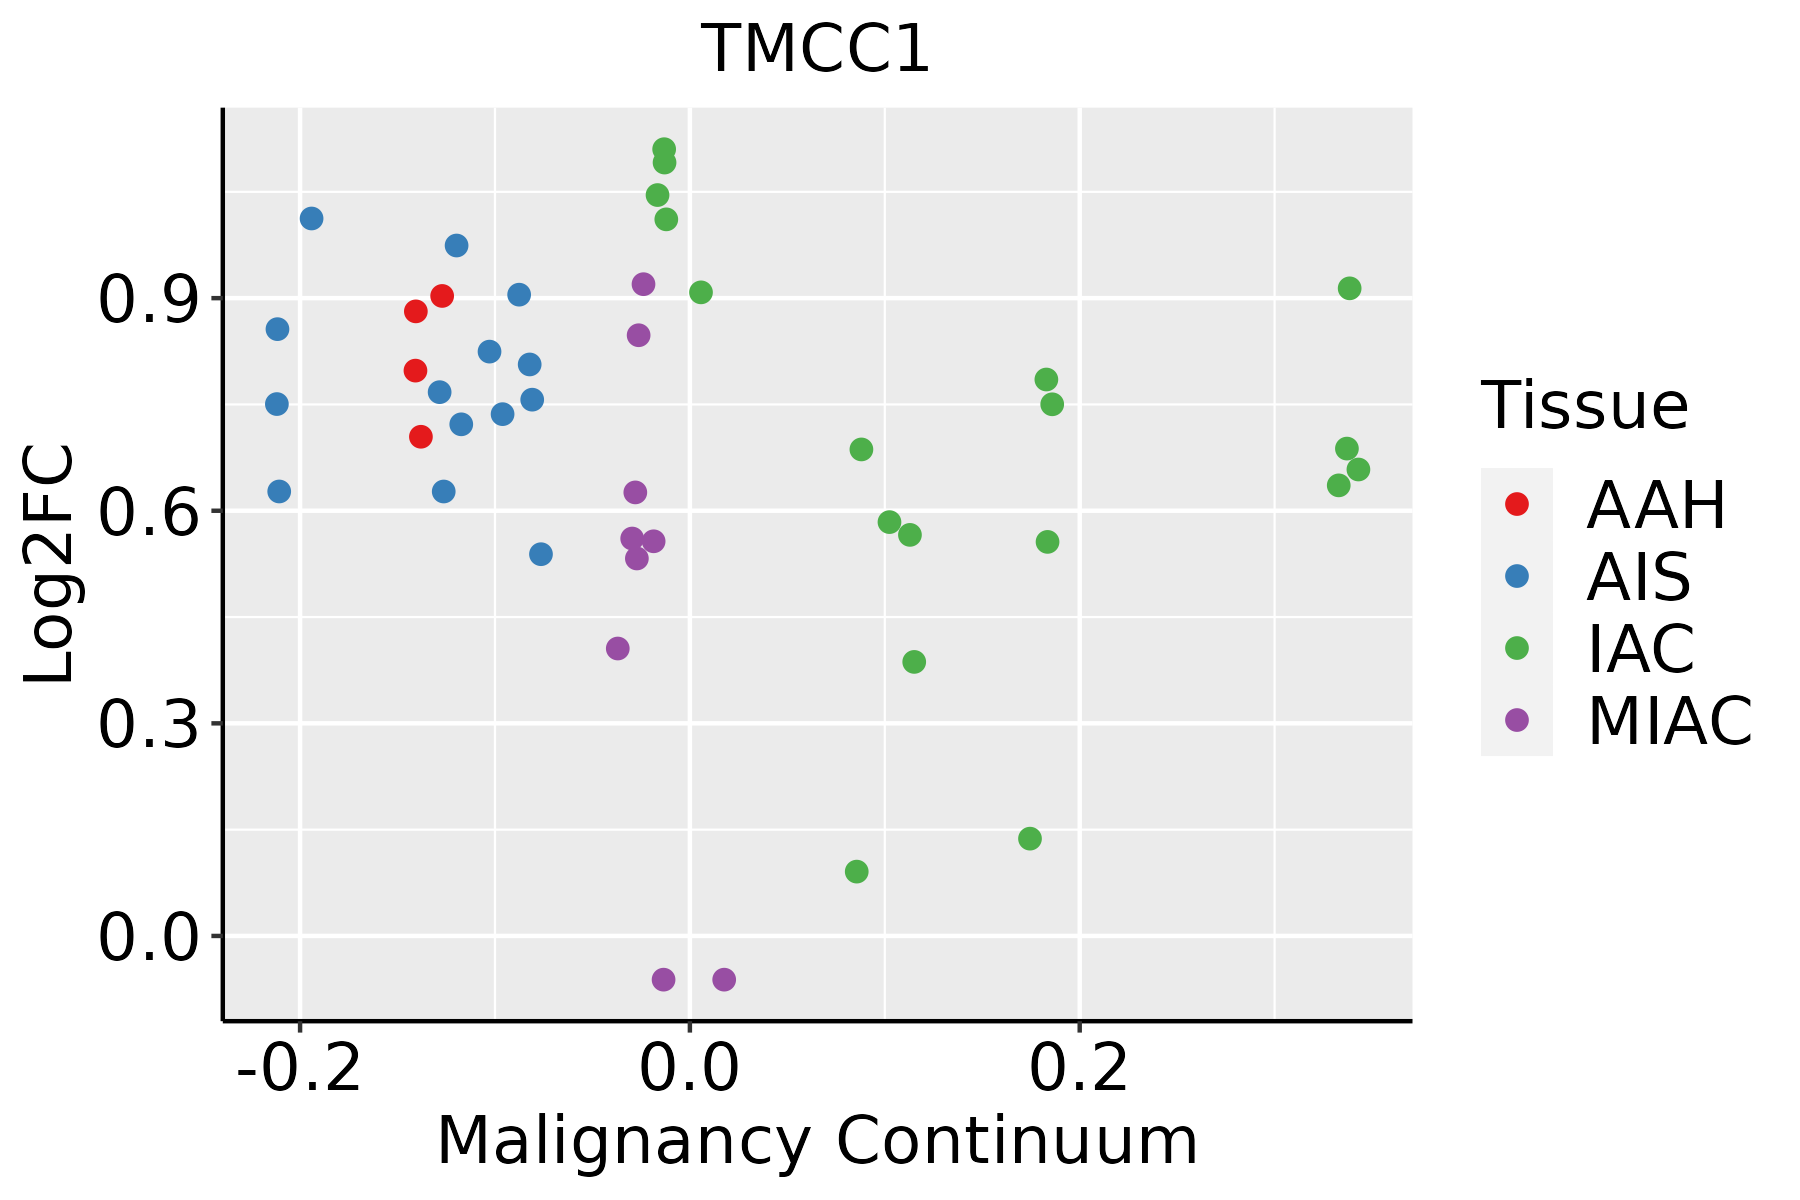 | AAH: Atypical adenomatous hyperplasia |
| AIS: Adenocarcinoma in situ | ||
| IAC: Invasive lung adenocarcinoma | ||
| MIA: Minimally invasive adenocarcinoma | ||
| Oral Cavity |  | EOLP: Erosive Oral lichen planus |
| LP: leukoplakia | ||
| NEOLP: Non-erosive oral lichen planus | ||
| OSCC: Oral squamous cell carcinoma | ||
| Prostate | 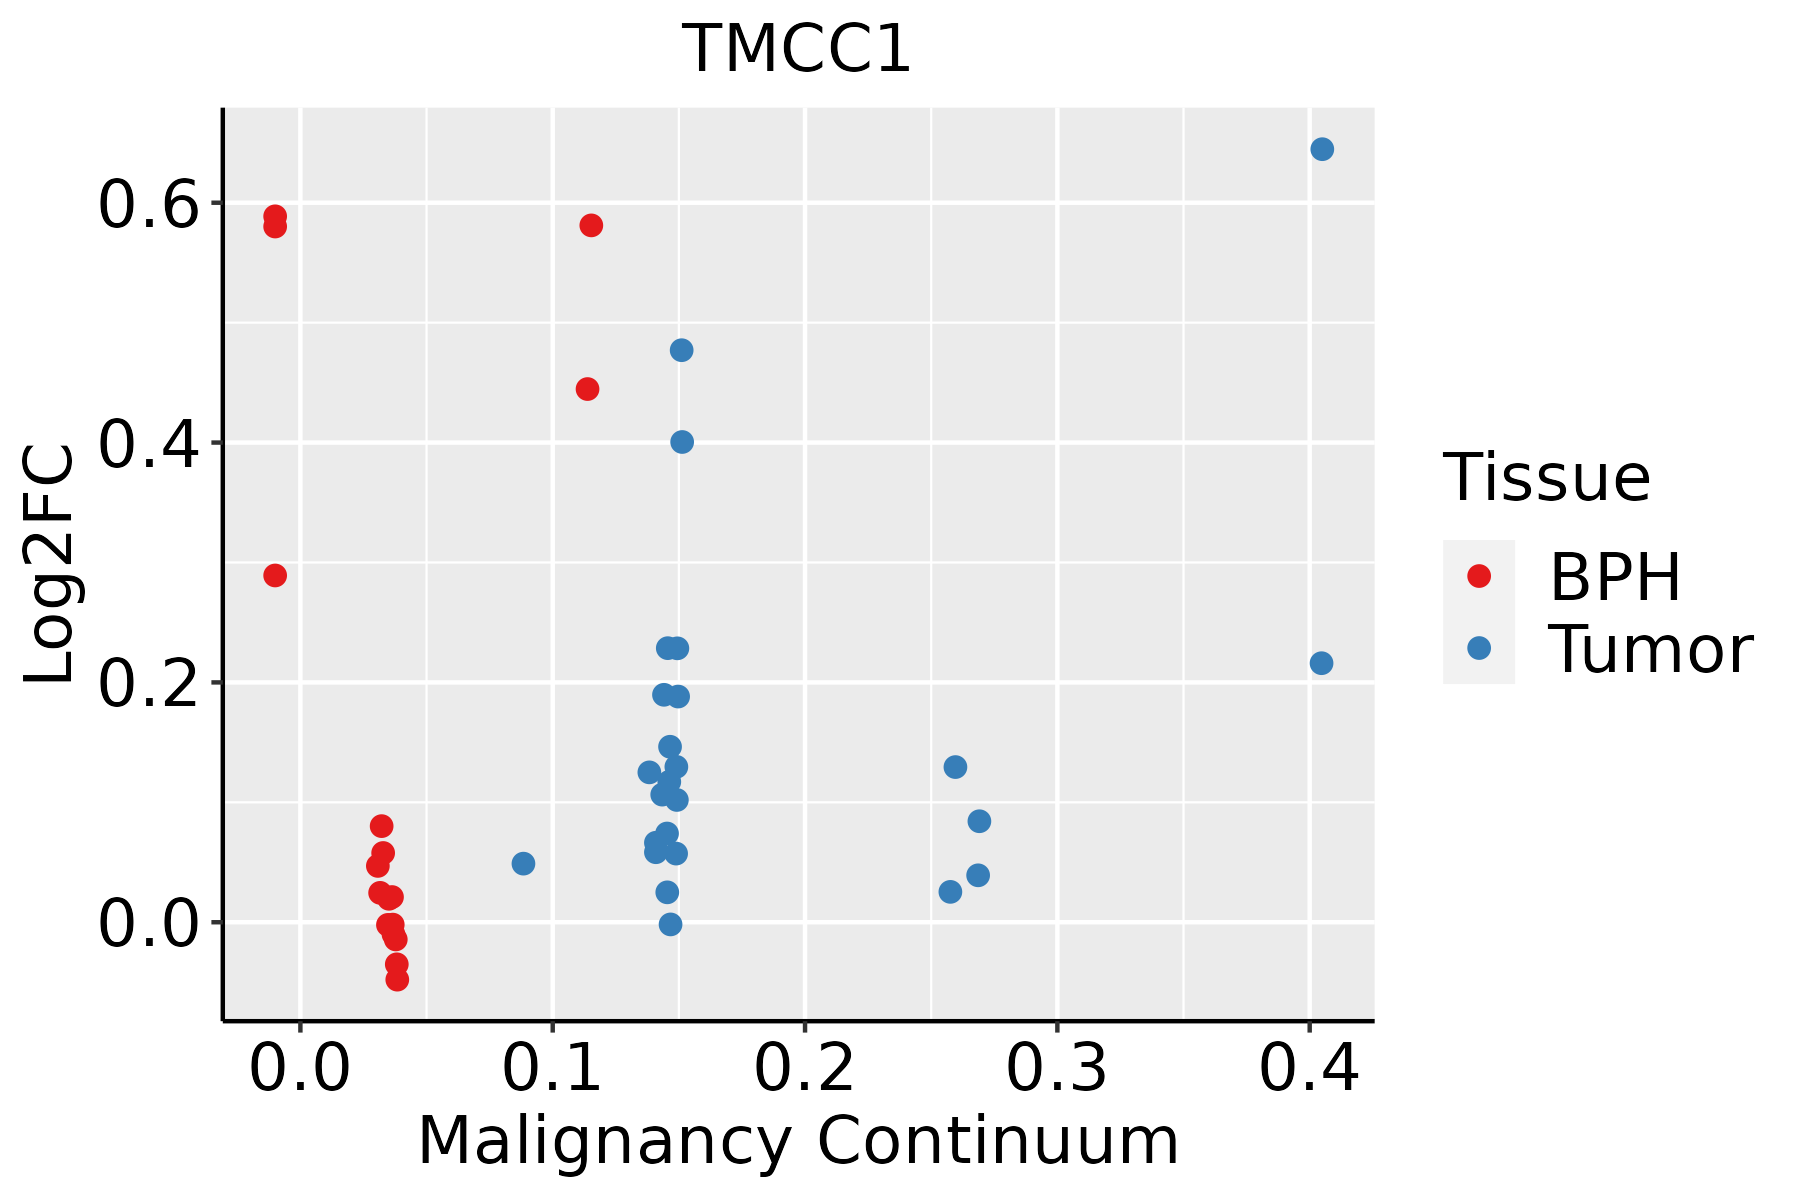 | BPH: Benign Prostatic Hyperplasia |
| Thyroid |  | ATC: Anaplastic thyroid cancer |
| HT: Hashimoto's thyroiditis | ||
| PTC: Papillary thyroid cancer |
| ∗log2FC in expression of this searched gene in stem-like cells from each diseased tissue sample relative to stem-like cells in normal samples in each tissue plotted against the malignancy continuum. Samples are colored based on if they are from different disease stage. |
Top |
Malignant transformation related pathway analysis |
| Find out the enriched GO biological processes and KEGG pathways involved in transition from healthy to precancer to cancer |
| Tissue | Disease Stage | Enriched GO biological Processes |
| Colorectum | AD |  |
| Colorectum | SER |  |
| Colorectum | MSS |  |
| Colorectum | MSI-H |  |
| Colorectum | FAP |  |
| ∗Top 15 enriched GO BP terms are showed in the bar plot of each disease state in each tissue. Each row represents a significant GO biological process which is colored according to the -log10(p.adjust). |
| Page: 1 2 3 4 5 6 7 8 9 |
| GO ID | Tissue | Disease Stage | Description | Gene Ratio | Bg Ratio | pvalue | p.adjust | Count |
| GO:00161977 | Cervix | CC | endosomal transport | 48/2311 | 230/18723 | 1.65e-04 | 1.97e-03 | 48 |
| GO:00160506 | Cervix | CC | vesicle organization | 54/2311 | 300/18723 | 2.71e-03 | 1.85e-02 | 54 |
| GO:00482851 | Cervix | CC | organelle fission | 78/2311 | 488/18723 | 9.70e-03 | 4.79e-02 | 78 |
| GO:0016197 | Colorectum | AD | endosomal transport | 90/3918 | 230/18723 | 1.88e-10 | 1.73e-08 | 90 |
| GO:0016050 | Colorectum | AD | vesicle organization | 101/3918 | 300/18723 | 1.65e-07 | 7.17e-06 | 101 |
| GO:0007032 | Colorectum | AD | endosome organization | 33/3918 | 82/18723 | 5.30e-05 | 9.01e-04 | 33 |
| GO:0007029 | Colorectum | AD | endoplasmic reticulum organization | 31/3918 | 87/18723 | 1.08e-03 | 1.00e-02 | 31 |
| GO:00160503 | Colorectum | FAP | vesicle organization | 74/2622 | 300/18723 | 5.16e-07 | 2.66e-05 | 74 |
| GO:00161973 | Colorectum | FAP | endosomal transport | 56/2622 | 230/18723 | 1.79e-05 | 4.53e-04 | 56 |
| GO:00070323 | Colorectum | FAP | endosome organization | 20/2622 | 82/18723 | 8.23e-03 | 4.82e-02 | 20 |
| GO:00161974 | Colorectum | CRC | endosomal transport | 49/2078 | 230/18723 | 5.07e-06 | 2.05e-04 | 49 |
| GO:00160504 | Colorectum | CRC | vesicle organization | 57/2078 | 300/18723 | 3.36e-05 | 8.57e-04 | 57 |
| GO:00070324 | Colorectum | CRC | endosome organization | 18/2078 | 82/18723 | 3.37e-03 | 2.88e-02 | 18 |
| GO:001605014 | Esophagus | ESCC | vesicle organization | 211/8552 | 300/18723 | 2.85e-18 | 2.87e-16 | 211 |
| GO:001619715 | Esophagus | ESCC | endosomal transport | 168/8552 | 230/18723 | 2.28e-17 | 1.93e-15 | 168 |
| GO:00482853 | Esophagus | ESCC | organelle fission | 301/8552 | 488/18723 | 4.64e-13 | 2.12e-11 | 301 |
| GO:000702914 | Esophagus | ESCC | endoplasmic reticulum organization | 65/8552 | 87/18723 | 3.28e-08 | 6.08e-07 | 65 |
| GO:000703214 | Esophagus | ESCC | endosome organization | 61/8552 | 82/18723 | 1.13e-07 | 1.85e-06 | 61 |
| GO:00161975 | Liver | NAFLD | endosomal transport | 41/1882 | 230/18723 | 2.02e-04 | 3.53e-03 | 41 |
| GO:00160505 | Liver | NAFLD | vesicle organization | 50/1882 | 300/18723 | 2.42e-04 | 4.06e-03 | 50 |
| Page: 1 2 3 |
| Pathway ID | Tissue | Disease Stage | Description | Gene Ratio | Bg Ratio | pvalue | p.adjust | qvalue | Count |
| Page: 1 |
Top |
Cell-cell communication analysis |
| Identification of potential cell-cell interactions between two cell types and their ligand-receptor pairs for different disease states |
| Ligand | Receptor | LRpair | Pathway | Tissue | Disease Stage |
| Page: 1 |
Top |
Single-cell gene regulatory network inference analysis |
| Find out the significant the regulons (TFs) and the target genes of each regulon across cell types for different disease states |
| TF | Cell Type | Tissue | Disease Stage | Target Gene | RSS | Regulon Activity |
| ∗The dot plots of a searched regulon are shown for all cell subpopulations in each disease state of each tissue based on the regulon specific score inferred using pySCENIC and by calculating the average expression. |
| Page: 1 |
Top |
Somatic mutation of malignant transformation related genes |
| Annotation of somatic variants for genes involved in malignant transformation |
| Hugo Symbol | Variant Class | Variant Classification | dbSNP RS | HGVSc | HGVSp | HGVSp Short | SWISSPROT | BIOTYPE | SIFT | PolyPhen | Tumor Sample Barcode | Tissue | Histology | Sex | Age | Stage | Therapy Types | Drugs | Outcome |
| TMCC1 | SNV | Missense_Mutation | novel | c.1217N>A | p.Gly406Glu | p.G406E | O94876 | protein_coding | deleterious(0.01) | probably_damaging(1) | TCGA-A7-A2KD-01 | Breast | breast invasive carcinoma | Female | <65 | III/IV | Chemotherapy | cytoxan | SD |
| TMCC1 | SNV | Missense_Mutation | novel | c.1900N>A | p.Leu634Ile | p.L634I | O94876 | protein_coding | tolerated(0.08) | benign(0.188) | TCGA-AN-A046-01 | Breast | breast invasive carcinoma | Female | >=65 | I/II | Unknown | Unknown | SD |
| TMCC1 | SNV | Missense_Mutation | c.1173N>G | p.Asp391Glu | p.D391E | O94876 | protein_coding | tolerated(0.1) | probably_damaging(0.992) | TCGA-BH-A0AW-01 | Breast | breast invasive carcinoma | Female | <65 | I/II | Chemotherapy | carboplatin | SD | |
| TMCC1 | SNV | Missense_Mutation | novel | c.1835N>G | p.Val612Gly | p.V612G | O94876 | protein_coding | deleterious(0.01) | probably_damaging(0.95) | TCGA-BH-A0BO-01 | Breast | breast invasive carcinoma | Female | <65 | I/II | Unknown | Unknown | SD |
| TMCC1 | SNV | Missense_Mutation | c.1094N>C | p.Val365Ala | p.V365A | O94876 | protein_coding | deleterious(0) | probably_damaging(0.989) | TCGA-D8-A1XK-01 | Breast | breast invasive carcinoma | Female | <65 | I/II | Chemotherapy | doxorubicine+cyclophosphamide | SD | |
| TMCC1 | SNV | Missense_Mutation | c.1045N>C | p.Gly349Arg | p.G349R | O94876 | protein_coding | deleterious(0) | probably_damaging(1) | TCGA-EW-A1PD-01 | Breast | breast invasive carcinoma | Male | <65 | I/II | Chemotherapy | docetaxel | SD | |
| TMCC1 | deletion | Frame_Shift_Del | novel | c.354delN | p.Thr119GlnfsTer27 | p.T119Qfs*27 | O94876 | protein_coding | TCGA-D8-A27V-01 | Breast | breast invasive carcinoma | Female | <65 | I/II | Hormone Therapy | tamoxiphen | SD | ||
| TMCC1 | SNV | Missense_Mutation | rs148011506 | c.1321N>A | p.Ala441Thr | p.A441T | O94876 | protein_coding | tolerated(0.24) | benign(0.006) | TCGA-VS-A8EH-01 | Cervix | cervical & endocervical cancer | Female | <65 | III/IV | Chemotherapy | cisplatin | CR |
| TMCC1 | deletion | Frame_Shift_Del | novel | c.1840delN | p.Leu614SerfsTer2 | p.L614Sfs*2 | O94876 | protein_coding | TCGA-C5-A1BK-01 | Cervix | cervical & endocervical cancer | Female | <65 | I/II | Unknown | Unknown | SD | ||
| TMCC1 | SNV | Missense_Mutation | novel | c.146N>A | p.Gly49Asp | p.G49D | O94876 | protein_coding | deleterious_low_confidence(0) | probably_damaging(0.998) | TCGA-A6-2672-01 | Colorectum | colon adenocarcinoma | Female | >=65 | III/IV | Unknown | Unknown | SD |
| Page: 1 2 3 4 5 6 7 |
Top |
Related drugs of malignant transformation related genes |
| Identification of chemicals and drugs interact with genes involved in malignant transfromation |
| (DGIdb 4.0) |
| Entrez ID | Symbol | Category | Interaction Types | Drug Claim Name | Drug Name | PMIDs |
| Page: 1 |

Copyright 2023-Present -The University of Texas Health Science Center at Houston |