
|
|||||
|
 | |
| |
| |
| |
| |
| |
|
Gene: TM9SF3 |
Gene summary for TM9SF3 |
| Gene information | Species | Human | Gene symbol | TM9SF3 | Gene ID | 56889 |
| Gene name | transmembrane 9 superfamily member 3 | |
| Gene Alias | EP70-P-iso | |
| Cytomap | 10q24.1 | |
| Gene Type | protein-coding | GO ID | GO:0008104 | UniProtAcc | A0A024QYS2 |
Top |
Malignant transformation analysis |
| Identification of the aberrant gene expression in precancerous and cancerous lesions by comparing the gene expression of stem-like cells in diseased tissues with normal stem cells |
| Entrez ID | Symbol | Replicates | Species | Organ | Tissue | Adj P-value | Log2FC | Malignancy |
| 56889 | TM9SF3 | EEC-subject3 | Human | Endometrium | EEC | 1.00e-20 | -6.84e-02 | -0.2525 |
| 56889 | TM9SF3 | GSM6177620_NYU_UCEC1_lib1_lib1 | Human | Endometrium | EEC | 3.69e-36 | 5.25e-02 | -0.1869 |
| 56889 | TM9SF3 | GSM6177620_NYU_UCEC1_lib2_lib2 | Human | Endometrium | EEC | 1.50e-35 | -3.78e-02 | -0.1875 |
| 56889 | TM9SF3 | GSM6177620_NYU_UCEC1_lib3_lib3 | Human | Endometrium | EEC | 8.52e-36 | -1.55e-01 | -0.1883 |
| 56889 | TM9SF3 | GSM6177621_NYU_UCEC2_lib1_lib1 | Human | Endometrium | EEC | 2.76e-31 | 3.54e-01 | -0.1934 |
| 56889 | TM9SF3 | GSM6177622_NYU_UCEC3_lib1_lib1 | Human | Endometrium | EEC | 1.19e-43 | -9.36e-02 | -0.1917 |
| 56889 | TM9SF3 | GSM6177622_NYU_UCEC3_lib2_lib2 | Human | Endometrium | EEC | 1.53e-45 | -6.96e-02 | -0.1916 |
| 56889 | TM9SF3 | GSM6177623_NYU_UCEC3_Vis | Human | Endometrium | EEC | 2.83e-03 | 1.09e-01 | -0.1269 |
| 56889 | TM9SF3 | LZE4T | Human | Esophagus | ESCC | 1.52e-11 | -1.89e-01 | 0.0811 |
| 56889 | TM9SF3 | LZE8T | Human | Esophagus | ESCC | 5.11e-06 | -1.99e-01 | 0.067 |
| 56889 | TM9SF3 | LZE20T | Human | Esophagus | ESCC | 1.01e-12 | -1.55e-01 | 0.0662 |
| 56889 | TM9SF3 | LZE21D1 | Human | Esophagus | HGIN | 3.31e-02 | -3.60e-01 | 0.0632 |
| 56889 | TM9SF3 | LZE22D1 | Human | Esophagus | HGIN | 2.19e-07 | -2.60e-01 | 0.0595 |
| 56889 | TM9SF3 | LZE22T | Human | Esophagus | ESCC | 6.16e-12 | 2.25e-02 | 0.068 |
| 56889 | TM9SF3 | LZE24T | Human | Esophagus | ESCC | 1.87e-06 | 4.36e-01 | 0.0596 |
| 56889 | TM9SF3 | LZE21T | Human | Esophagus | ESCC | 3.03e-05 | -3.34e-01 | 0.0655 |
| 56889 | TM9SF3 | P2T-E | Human | Esophagus | ESCC | 2.07e-19 | 2.25e-01 | 0.1177 |
| 56889 | TM9SF3 | P4T-E | Human | Esophagus | ESCC | 9.20e-13 | 4.03e-01 | 0.1323 |
| 56889 | TM9SF3 | P5T-E | Human | Esophagus | ESCC | 7.20e-07 | -1.83e-02 | 0.1327 |
| 56889 | TM9SF3 | P8T-E | Human | Esophagus | ESCC | 1.50e-19 | 5.63e-01 | 0.0889 |
| Page: 1 2 3 4 5 6 7 8 9 10 11 12 |
| Tissue | Expression Dynamics | Abbreviation |
| Colorectum (GSE201348) |  | FAP: Familial adenomatous polyposis |
| CRC: Colorectal cancer | ||
| Colorectum (HTA11) | 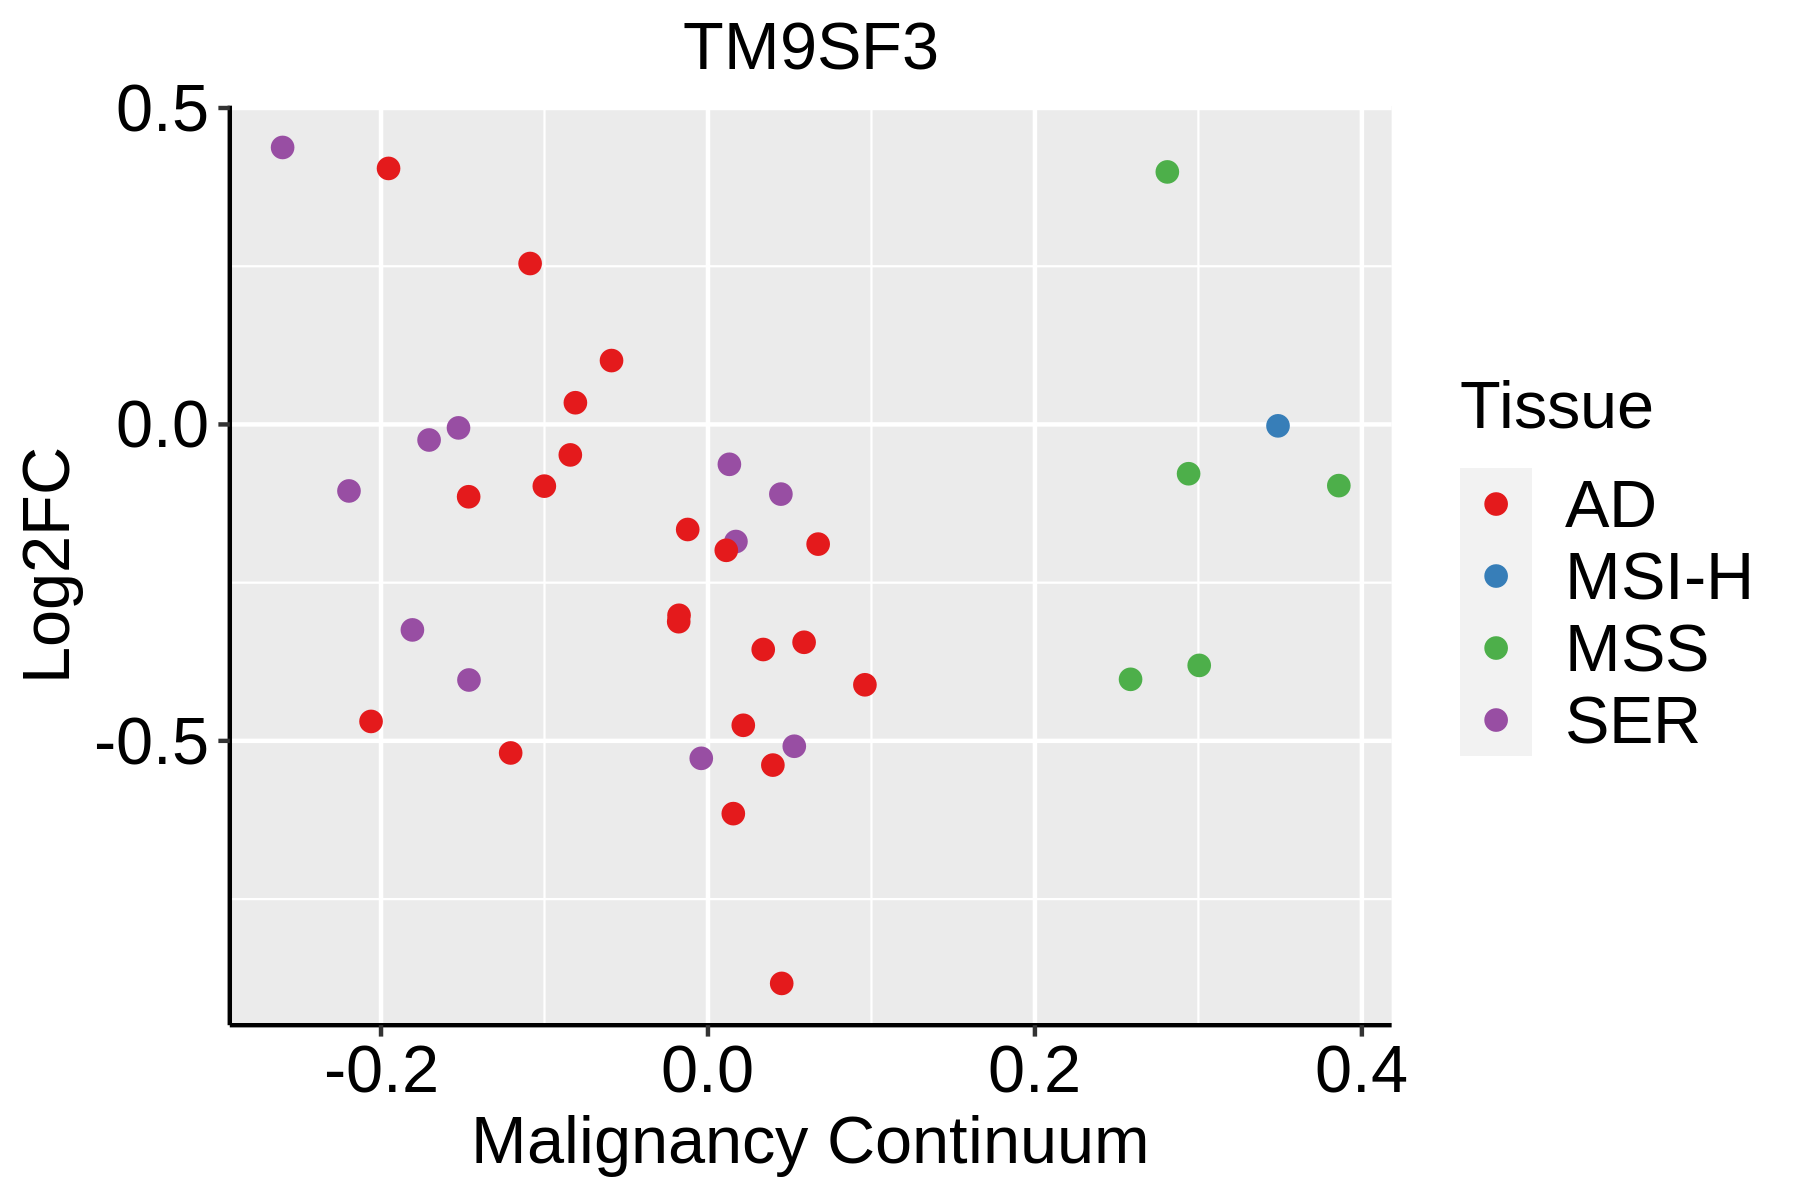 | AD: Adenomas |
| SER: Sessile serrated lesions | ||
| MSI-H: Microsatellite-high colorectal cancer | ||
| MSS: Microsatellite stable colorectal cancer | ||
| Endometrium | 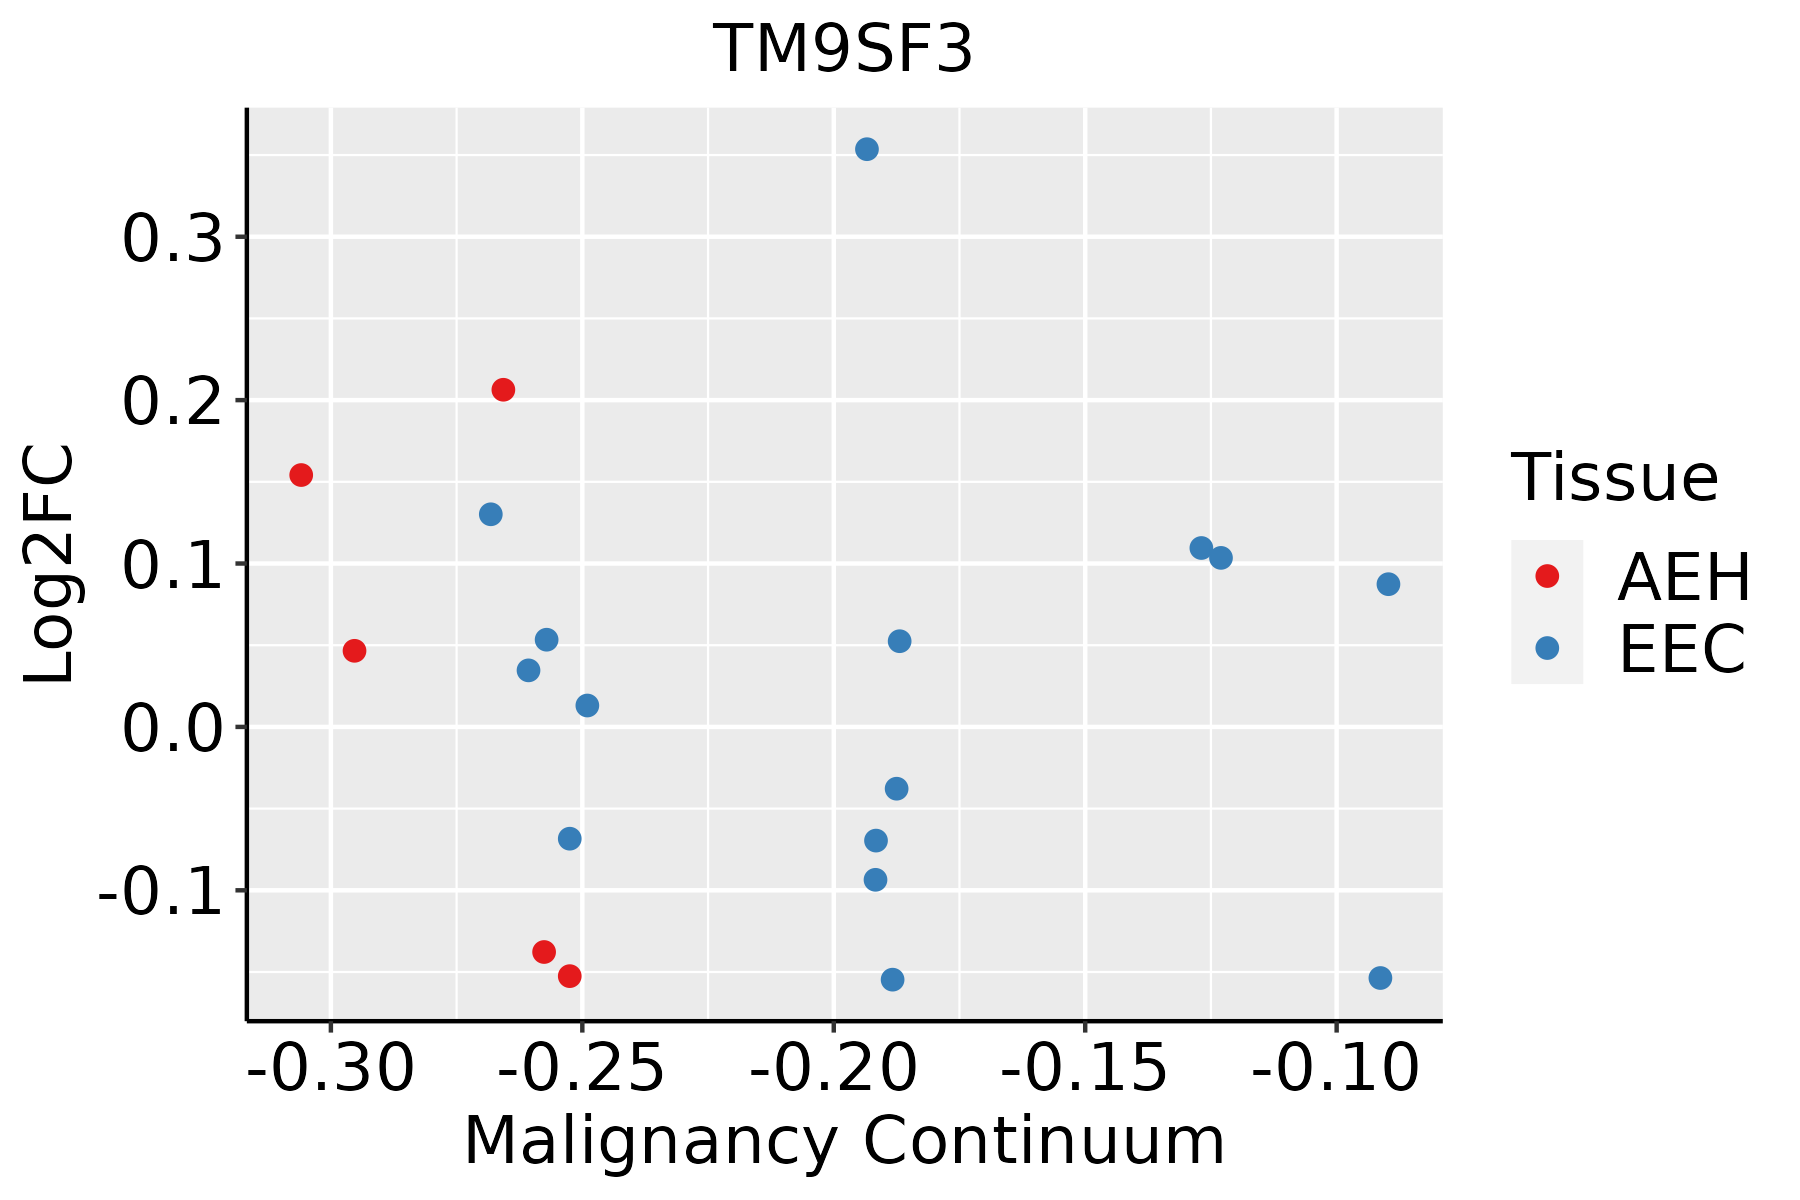 | AEH: Atypical endometrial hyperplasia |
| EEC: Endometrioid Cancer | ||
| Esophagus | 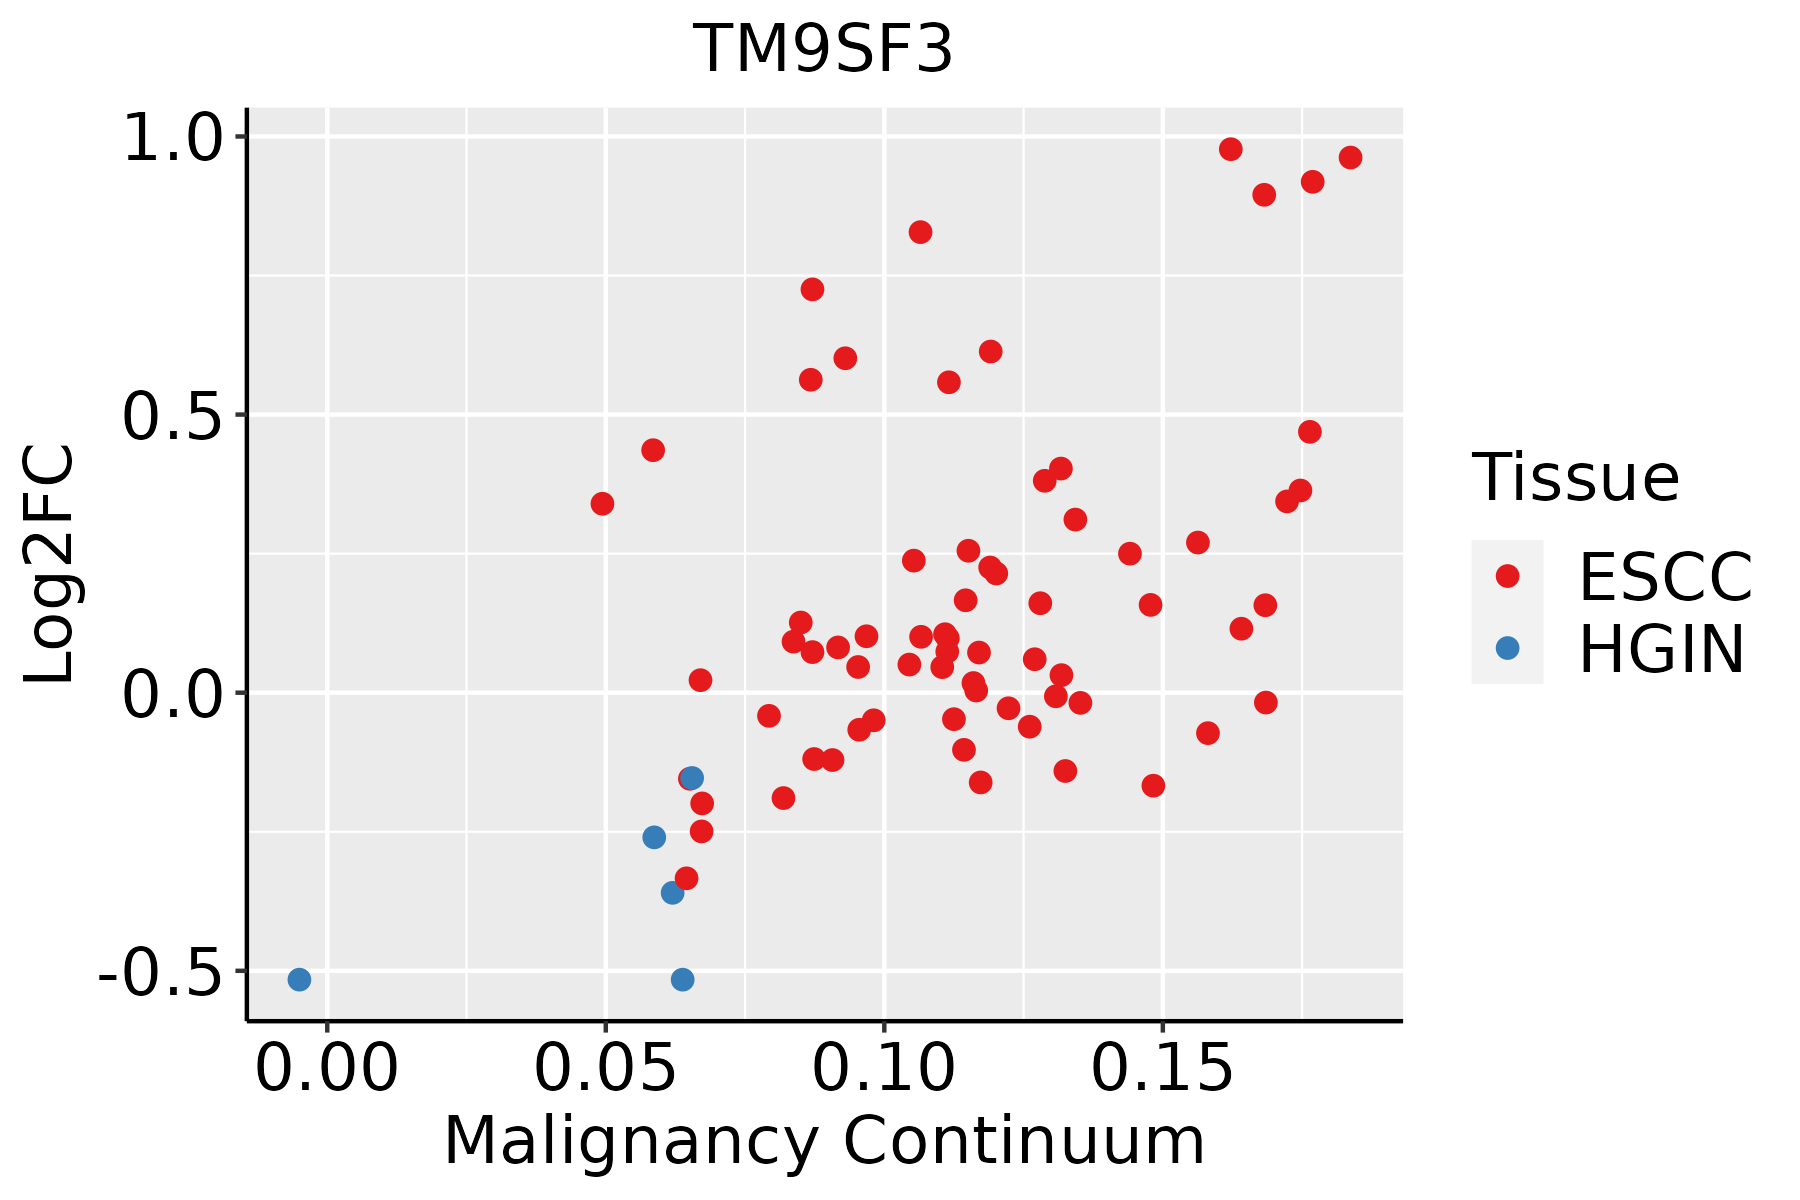 | ESCC: Esophageal squamous cell carcinoma |
| HGIN: High-grade intraepithelial neoplasias | ||
| LGIN: Low-grade intraepithelial neoplasias | ||
| GC |  | CAG: Chronic atrophic gastritis |
| CAG with IM: Chronic atrophic gastritis with intestinal metaplasia | ||
| CSG: Chronic superficial gastritis | ||
| GC: Gastric cancer | ||
| SIM: Severe intestinal metaplasia | ||
| WIM: Wild intestinal metaplasia | ||
| Liver |  | HCC: Hepatocellular carcinoma |
| NAFLD: Non-alcoholic fatty liver disease | ||
| Oral Cavity | 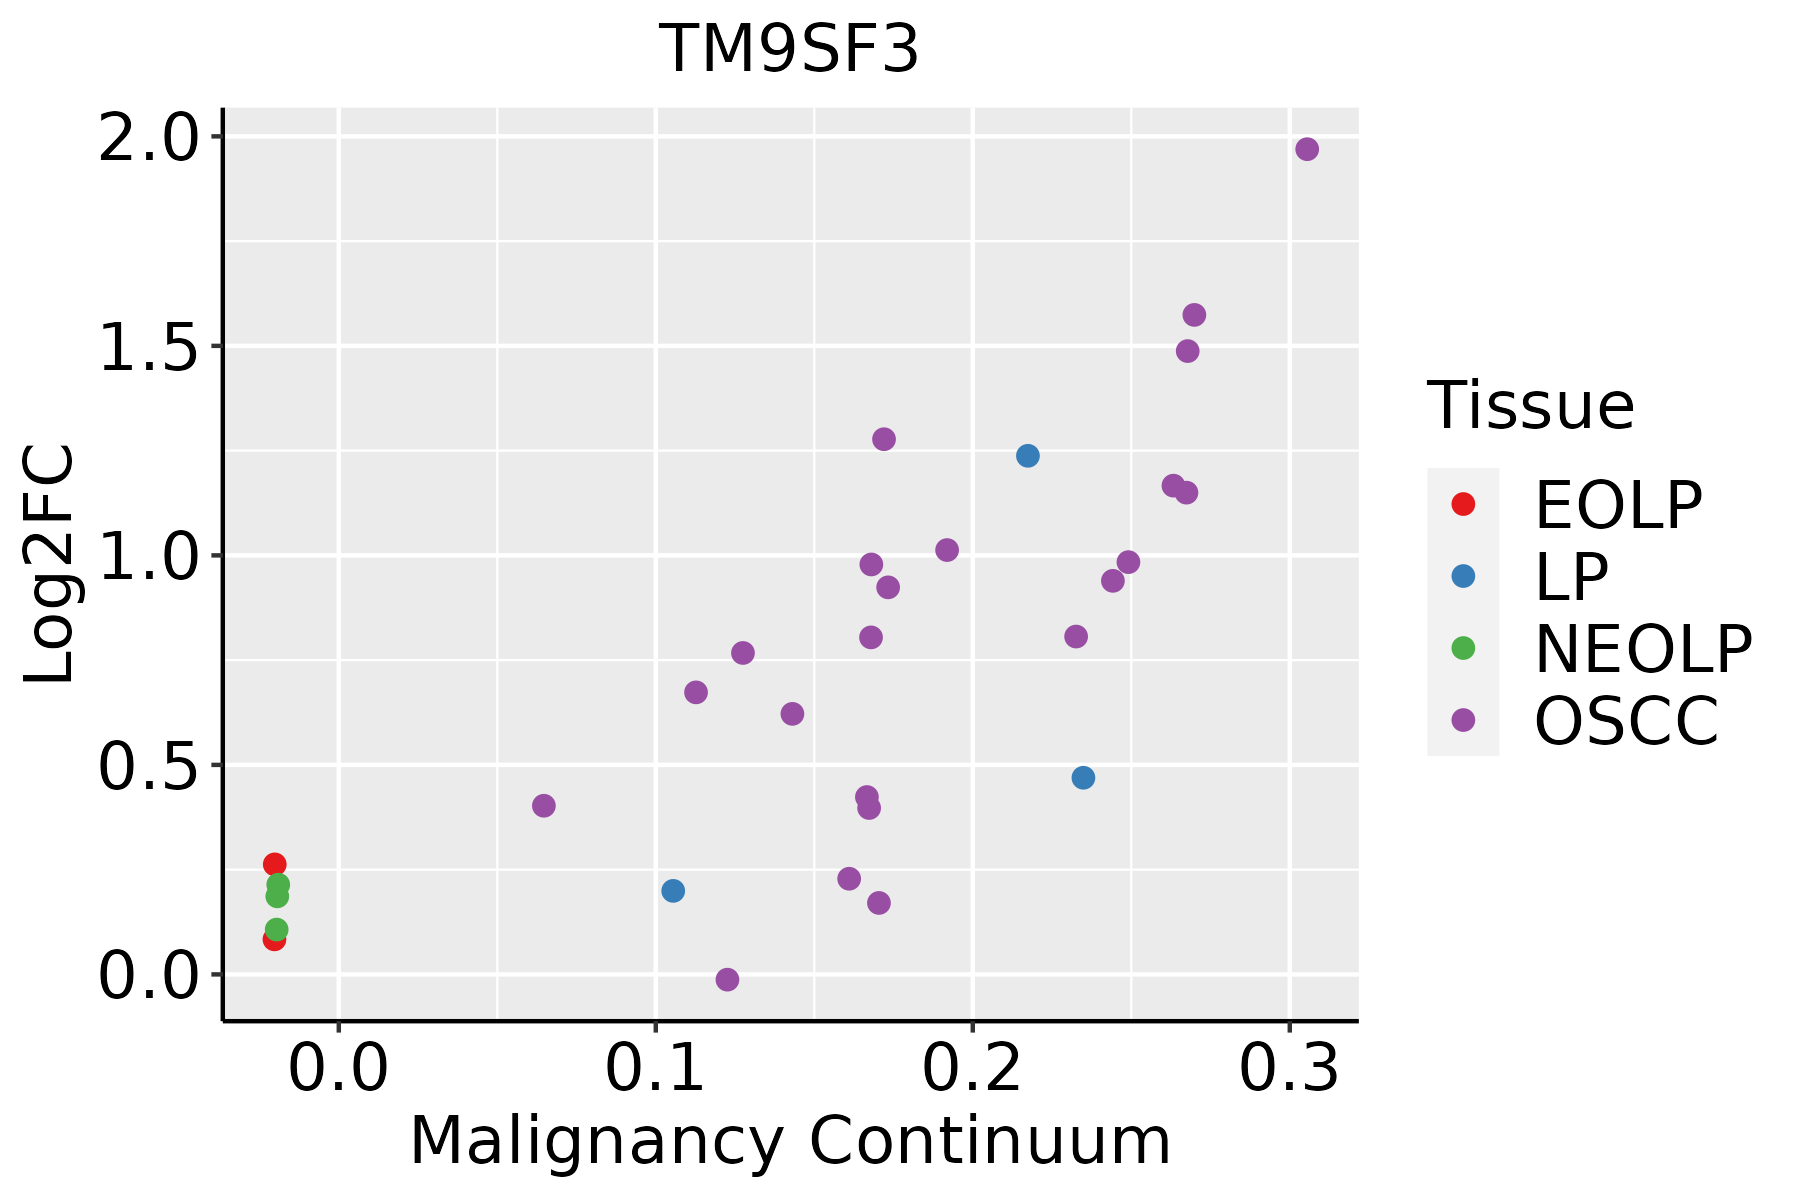 | EOLP: Erosive Oral lichen planus |
| LP: leukoplakia | ||
| NEOLP: Non-erosive oral lichen planus | ||
| OSCC: Oral squamous cell carcinoma | ||
| Prostate | 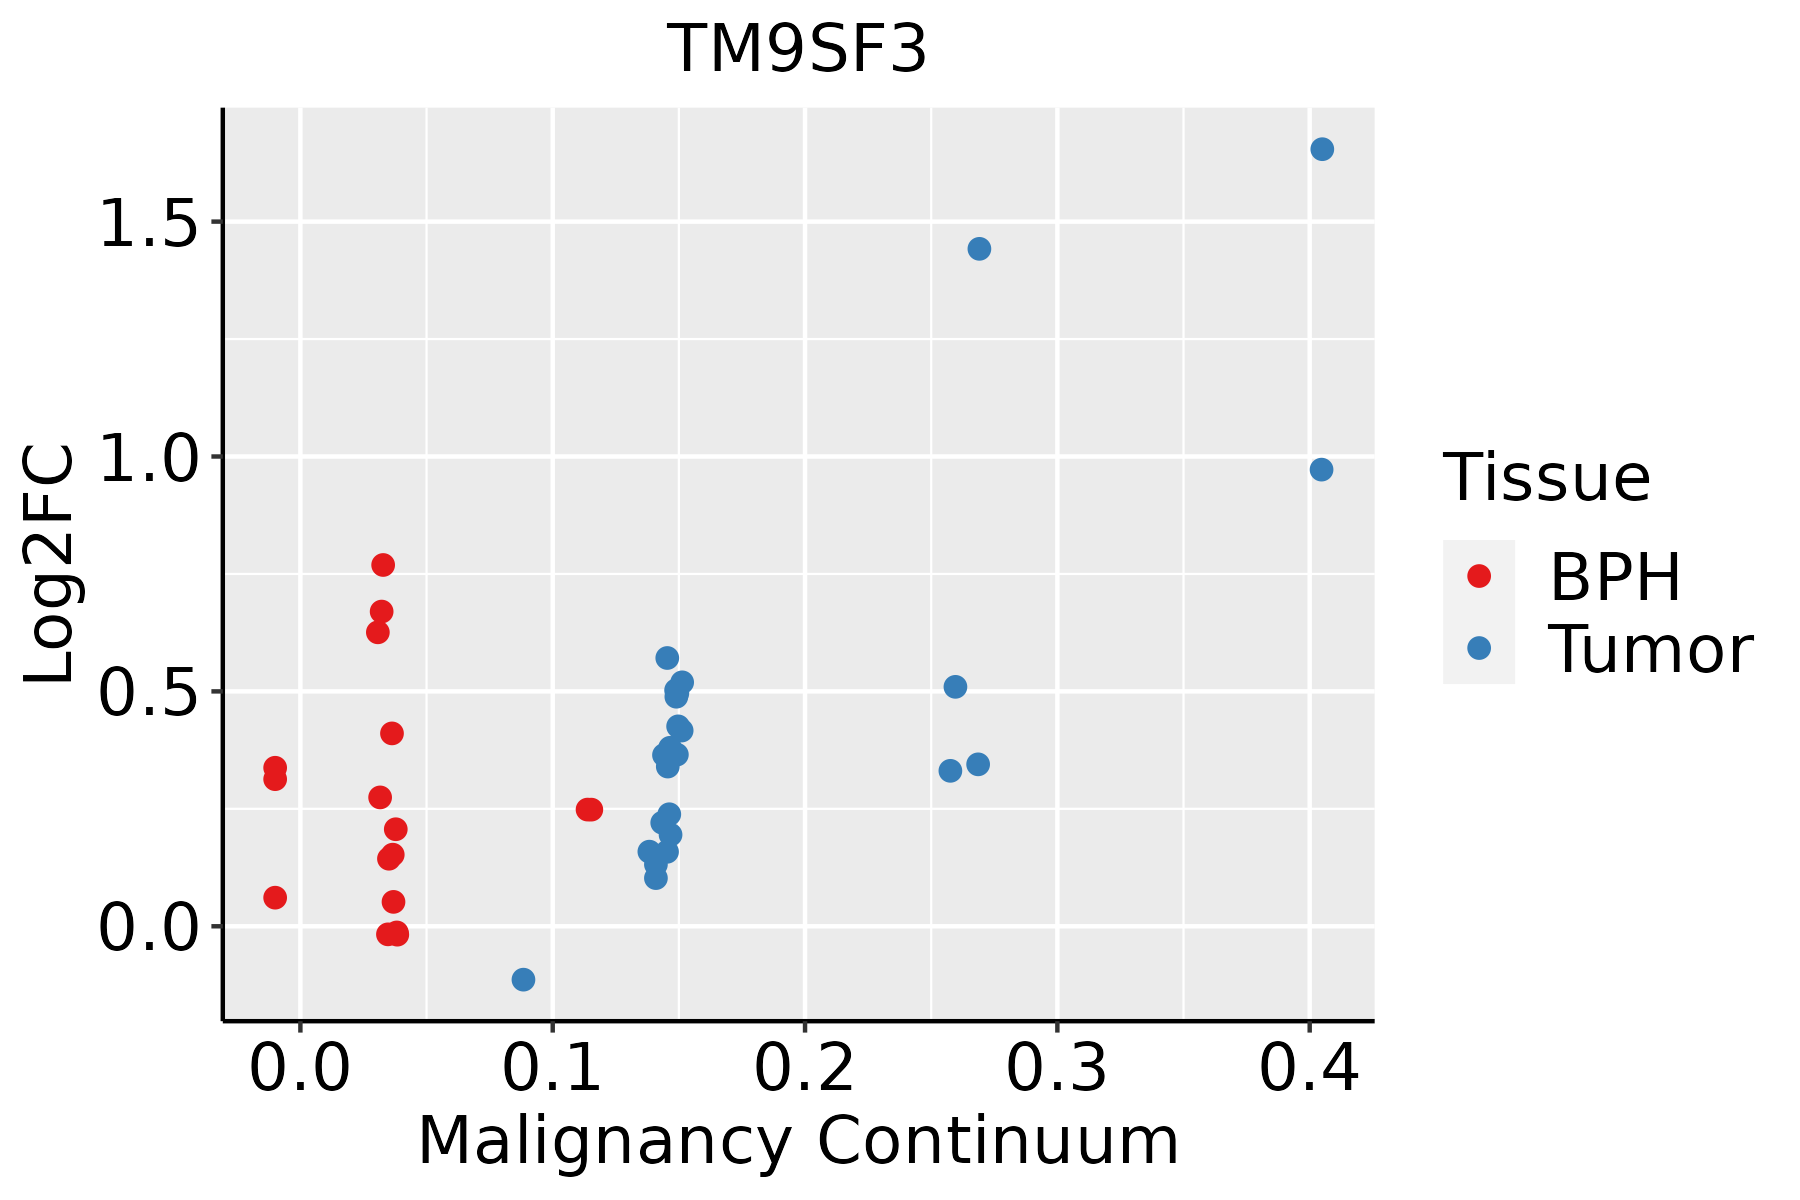 | BPH: Benign Prostatic Hyperplasia |
| Skin | 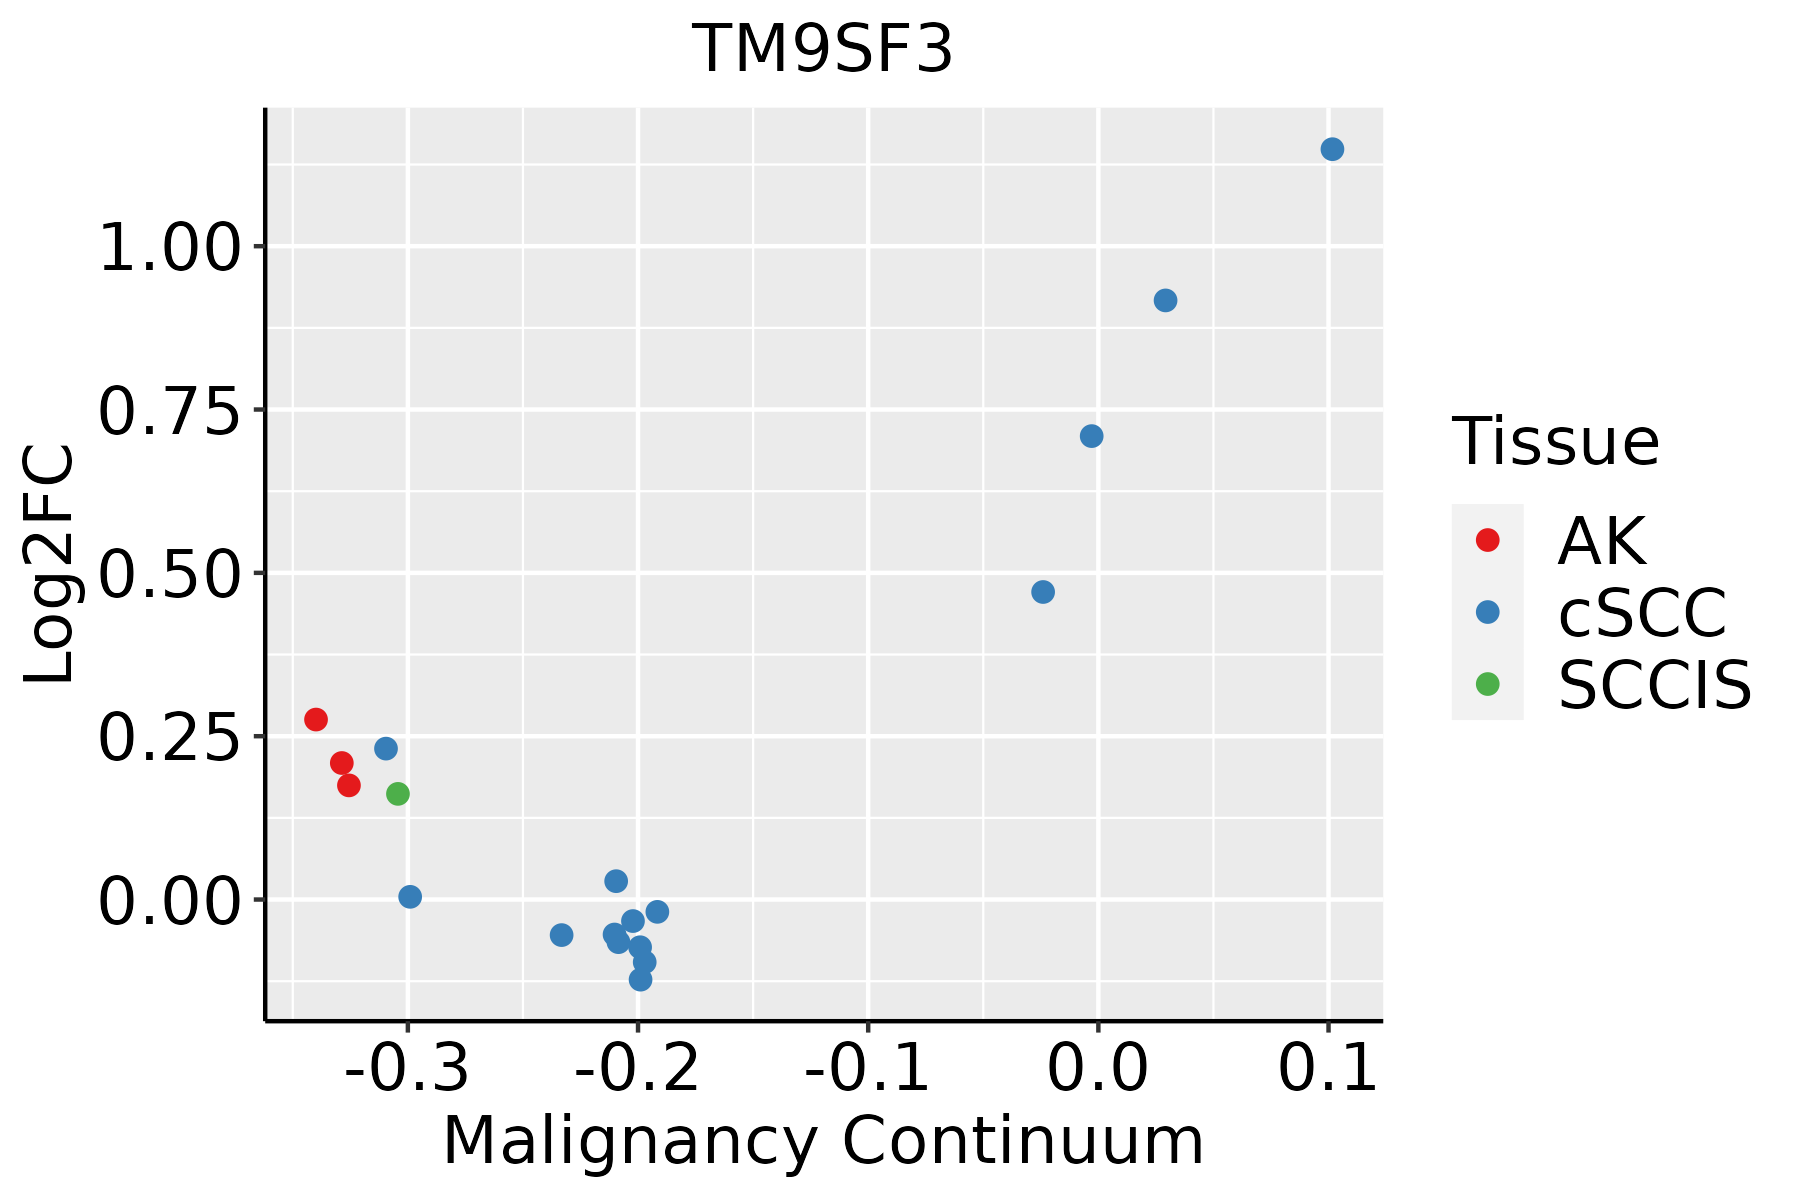 | AK: Actinic keratosis |
| cSCC: Cutaneous squamous cell carcinoma | ||
| SCCIS:squamous cell carcinoma in situ | ||
| Thyroid | 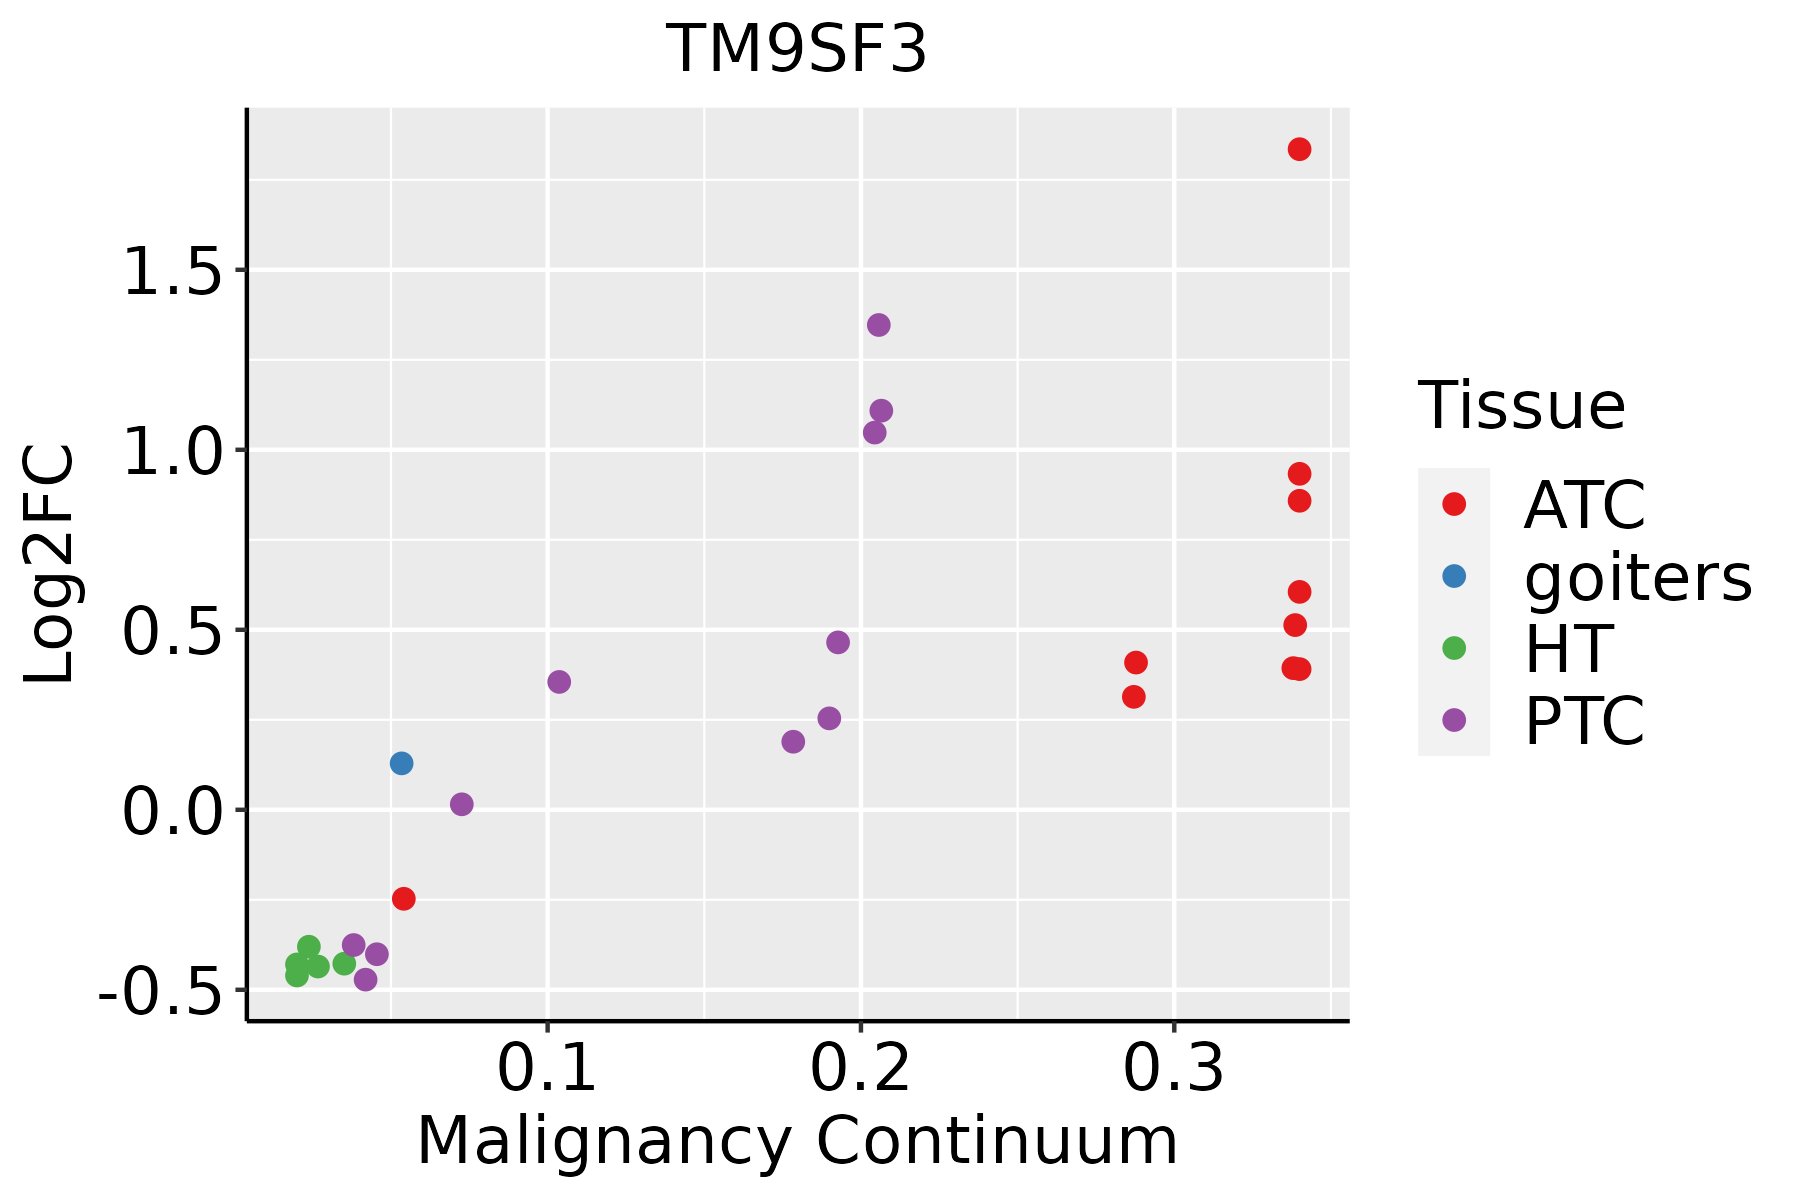 | ATC: Anaplastic thyroid cancer |
| HT: Hashimoto's thyroiditis | ||
| PTC: Papillary thyroid cancer |
| ∗log2FC in expression of this searched gene in stem-like cells from each diseased tissue sample relative to stem-like cells in normal samples in each tissue plotted against the malignancy continuum. Samples are colored based on if they are from different disease stage. |
Top |
Malignant transformation related pathway analysis |
| Find out the enriched GO biological processes and KEGG pathways involved in transition from healthy to precancer to cancer |
| Tissue | Disease Stage | Enriched GO biological Processes |
| Colorectum | AD |  |
| Colorectum | SER |  |
| Colorectum | MSS |  |
| Colorectum | MSI-H |  |
| Colorectum | FAP |  |
| ∗Top 15 enriched GO BP terms are showed in the bar plot of each disease state in each tissue. Each row represents a significant GO biological process which is colored according to the -log10(p.adjust). |
| Page: 1 2 3 4 5 6 7 8 9 |
| GO ID | Tissue | Disease Stage | Description | Gene Ratio | Bg Ratio | pvalue | p.adjust | Count |
| Page: 1 |
| Pathway ID | Tissue | Disease Stage | Description | Gene Ratio | Bg Ratio | pvalue | p.adjust | qvalue | Count |
| Page: 1 |
Top |
Cell-cell communication analysis |
| Identification of potential cell-cell interactions between two cell types and their ligand-receptor pairs for different disease states |
| Ligand | Receptor | LRpair | Pathway | Tissue | Disease Stage |
| Page: 1 |
Top |
Single-cell gene regulatory network inference analysis |
| Find out the significant the regulons (TFs) and the target genes of each regulon across cell types for different disease states |
| TF | Cell Type | Tissue | Disease Stage | Target Gene | RSS | Regulon Activity |
| ∗The dot plots of a searched regulon are shown for all cell subpopulations in each disease state of each tissue based on the regulon specific score inferred using pySCENIC and by calculating the average expression. |
| Page: 1 |
Top |
Somatic mutation of malignant transformation related genes |
| Annotation of somatic variants for genes involved in malignant transformation |
| Hugo Symbol | Variant Class | Variant Classification | dbSNP RS | HGVSc | HGVSp | HGVSp Short | SWISSPROT | BIOTYPE | SIFT | PolyPhen | Tumor Sample Barcode | Tissue | Histology | Sex | Age | Stage | Therapy Types | Drugs | Outcome |
| TM9SF3 | SNV | Missense_Mutation | c.939N>A | p.Met313Ile | p.M313I | Q9HD45 | protein_coding | tolerated(1) | benign(0) | TCGA-A8-A06Q-01 | Breast | breast invasive carcinoma | Female | <65 | III/IV | Unknown | Unknown | SD | |
| TM9SF3 | SNV | Missense_Mutation | c.1075A>T | p.Met359Leu | p.M359L | Q9HD45 | protein_coding | tolerated(0.24) | benign(0.238) | TCGA-A8-A06Z-01 | Breast | breast invasive carcinoma | Female | >=65 | I/II | Unknown | Unknown | SD | |
| TM9SF3 | SNV | Missense_Mutation | novel | c.1137N>A | p.Phe379Leu | p.F379L | Q9HD45 | protein_coding | tolerated(0.38) | benign(0.046) | TCGA-AN-A046-01 | Breast | breast invasive carcinoma | Female | >=65 | I/II | Unknown | Unknown | SD |
| TM9SF3 | SNV | Missense_Mutation | c.836N>C | p.Gly279Ala | p.G279A | Q9HD45 | protein_coding | deleterious(0) | probably_damaging(0.998) | TCGA-D8-A1JA-01 | Breast | breast invasive carcinoma | Female | <65 | III/IV | Chemotherapy | adriamycin | PD | |
| TM9SF3 | insertion | Nonsense_Mutation | novel | c.1412_1413insCACCTTGATCTAGTTCCCCAAGCTCTCTAAGCTTCTGTAAAGT | p.Phe472ThrfsTer4 | p.F472Tfs*4 | Q9HD45 | protein_coding | TCGA-A8-A07B-01 | Breast | breast invasive carcinoma | Female | >=65 | I/II | Unknown | Unknown | SD | ||
| TM9SF3 | SNV | Missense_Mutation | c.263N>G | p.Glu88Gly | p.E88G | Q9HD45 | protein_coding | deleterious(0) | probably_damaging(0.92) | TCGA-C5-A7UE-01 | Cervix | cervical & endocervical cancer | Female | <65 | I/II | Chemotherapy | cisplatin | SD | |
| TM9SF3 | SNV | Missense_Mutation | novel | c.190N>T | p.Pro64Ser | p.P64S | Q9HD45 | protein_coding | deleterious(0) | probably_damaging(1) | TCGA-HM-A4S6-01 | Cervix | cervical & endocervical cancer | Female | <65 | III/IV | Chemotherapy | cisplatin | CR |
| TM9SF3 | SNV | Missense_Mutation | novel | c.343N>C | p.Glu115Gln | p.E115Q | Q9HD45 | protein_coding | tolerated(0.22) | benign(0.011) | TCGA-VS-A950-01 | Cervix | cervical & endocervical cancer | Female | <65 | III/IV | Unknown | Unknown | SD |
| TM9SF3 | SNV | Missense_Mutation | rs755612180 | c.1670C>T | p.Ala557Val | p.A557V | Q9HD45 | protein_coding | tolerated(0.11) | benign(0.246) | TCGA-AA-3672-01 | Colorectum | colon adenocarcinoma | Female | >=65 | III/IV | Unknown | Unknown | SD |
| TM9SF3 | SNV | Missense_Mutation | c.506N>A | p.Arg169Gln | p.R169Q | Q9HD45 | protein_coding | tolerated(0.99) | benign(0.007) | TCGA-AA-3977-01 | Colorectum | colon adenocarcinoma | Male | >=65 | I/II | Unknown | Unknown | SD |
| Page: 1 2 3 4 5 6 7 |
Top |
Related drugs of malignant transformation related genes |
| Identification of chemicals and drugs interact with genes involved in malignant transfromation |
| (DGIdb 4.0) |
| Entrez ID | Symbol | Category | Interaction Types | Drug Claim Name | Drug Name | PMIDs |
| Page: 1 |

Copyright 2023-Present -The University of Texas Health Science Center at Houston |