
|
|||||
|
 | |
| |
| |
| |
| |
| |
|
Gene: TBC1D17 |
Gene summary for TBC1D17 |
| Gene information | Species | Human | Gene symbol | TBC1D17 | Gene ID | 79735 |
| Gene name | TBC1 domain family member 17 | |
| Gene Alias | TBC1D17 | |
| Cytomap | 19q13.33 | |
| Gene Type | protein-coding | GO ID | GO:0006810 | UniProtAcc | Q9HA65 |
Top |
Malignant transformation analysis |
| Identification of the aberrant gene expression in precancerous and cancerous lesions by comparing the gene expression of stem-like cells in diseased tissues with normal stem cells |
| Entrez ID | Symbol | Replicates | Species | Organ | Tissue | Adj P-value | Log2FC | Malignancy |
| 79735 | TBC1D17 | P52T-E | Human | Esophagus | ESCC | 2.31e-20 | 4.42e-01 | 0.1555 |
| 79735 | TBC1D17 | P54T-E | Human | Esophagus | ESCC | 8.66e-28 | 5.80e-01 | 0.0975 |
| 79735 | TBC1D17 | P56T-E | Human | Esophagus | ESCC | 7.59e-13 | 1.75e+00 | 0.1613 |
| 79735 | TBC1D17 | P57T-E | Human | Esophagus | ESCC | 3.50e-22 | 4.89e-01 | 0.0926 |
| 79735 | TBC1D17 | P61T-E | Human | Esophagus | ESCC | 4.15e-22 | 4.97e-01 | 0.099 |
| 79735 | TBC1D17 | P62T-E | Human | Esophagus | ESCC | 8.61e-57 | 8.93e-01 | 0.1302 |
| 79735 | TBC1D17 | P65T-E | Human | Esophagus | ESCC | 1.84e-22 | 4.51e-01 | 0.0978 |
| 79735 | TBC1D17 | P74T-E | Human | Esophagus | ESCC | 6.74e-29 | 7.34e-01 | 0.1479 |
| 79735 | TBC1D17 | P75T-E | Human | Esophagus | ESCC | 1.52e-36 | 5.91e-01 | 0.1125 |
| 79735 | TBC1D17 | P76T-E | Human | Esophagus | ESCC | 5.05e-37 | 7.22e-01 | 0.1207 |
| 79735 | TBC1D17 | P79T-E | Human | Esophagus | ESCC | 1.49e-24 | 4.05e-01 | 0.1154 |
| 79735 | TBC1D17 | P80T-E | Human | Esophagus | ESCC | 2.40e-26 | 6.83e-01 | 0.155 |
| 79735 | TBC1D17 | P82T-E | Human | Esophagus | ESCC | 1.70e-25 | 8.42e-01 | 0.1072 |
| 79735 | TBC1D17 | P83T-E | Human | Esophagus | ESCC | 3.96e-36 | 8.66e-01 | 0.1738 |
| 79735 | TBC1D17 | P84T-E | Human | Esophagus | ESCC | 1.40e-06 | 4.64e-01 | 0.0933 |
| 79735 | TBC1D17 | P89T-E | Human | Esophagus | ESCC | 8.67e-08 | 5.96e-01 | 0.1752 |
| 79735 | TBC1D17 | P91T-E | Human | Esophagus | ESCC | 1.08e-09 | 9.59e-01 | 0.1828 |
| 79735 | TBC1D17 | P104T-E | Human | Esophagus | ESCC | 4.47e-03 | 3.20e-01 | 0.0931 |
| 79735 | TBC1D17 | P107T-E | Human | Esophagus | ESCC | 8.61e-32 | 7.14e-01 | 0.171 |
| 79735 | TBC1D17 | P126T-E | Human | Esophagus | ESCC | 2.68e-08 | 8.55e-01 | 0.1125 |
| Page: 1 2 3 4 5 |
| Tissue | Expression Dynamics | Abbreviation |
| Esophagus |  | ESCC: Esophageal squamous cell carcinoma |
| HGIN: High-grade intraepithelial neoplasias | ||
| LGIN: Low-grade intraepithelial neoplasias | ||
| Oral Cavity | 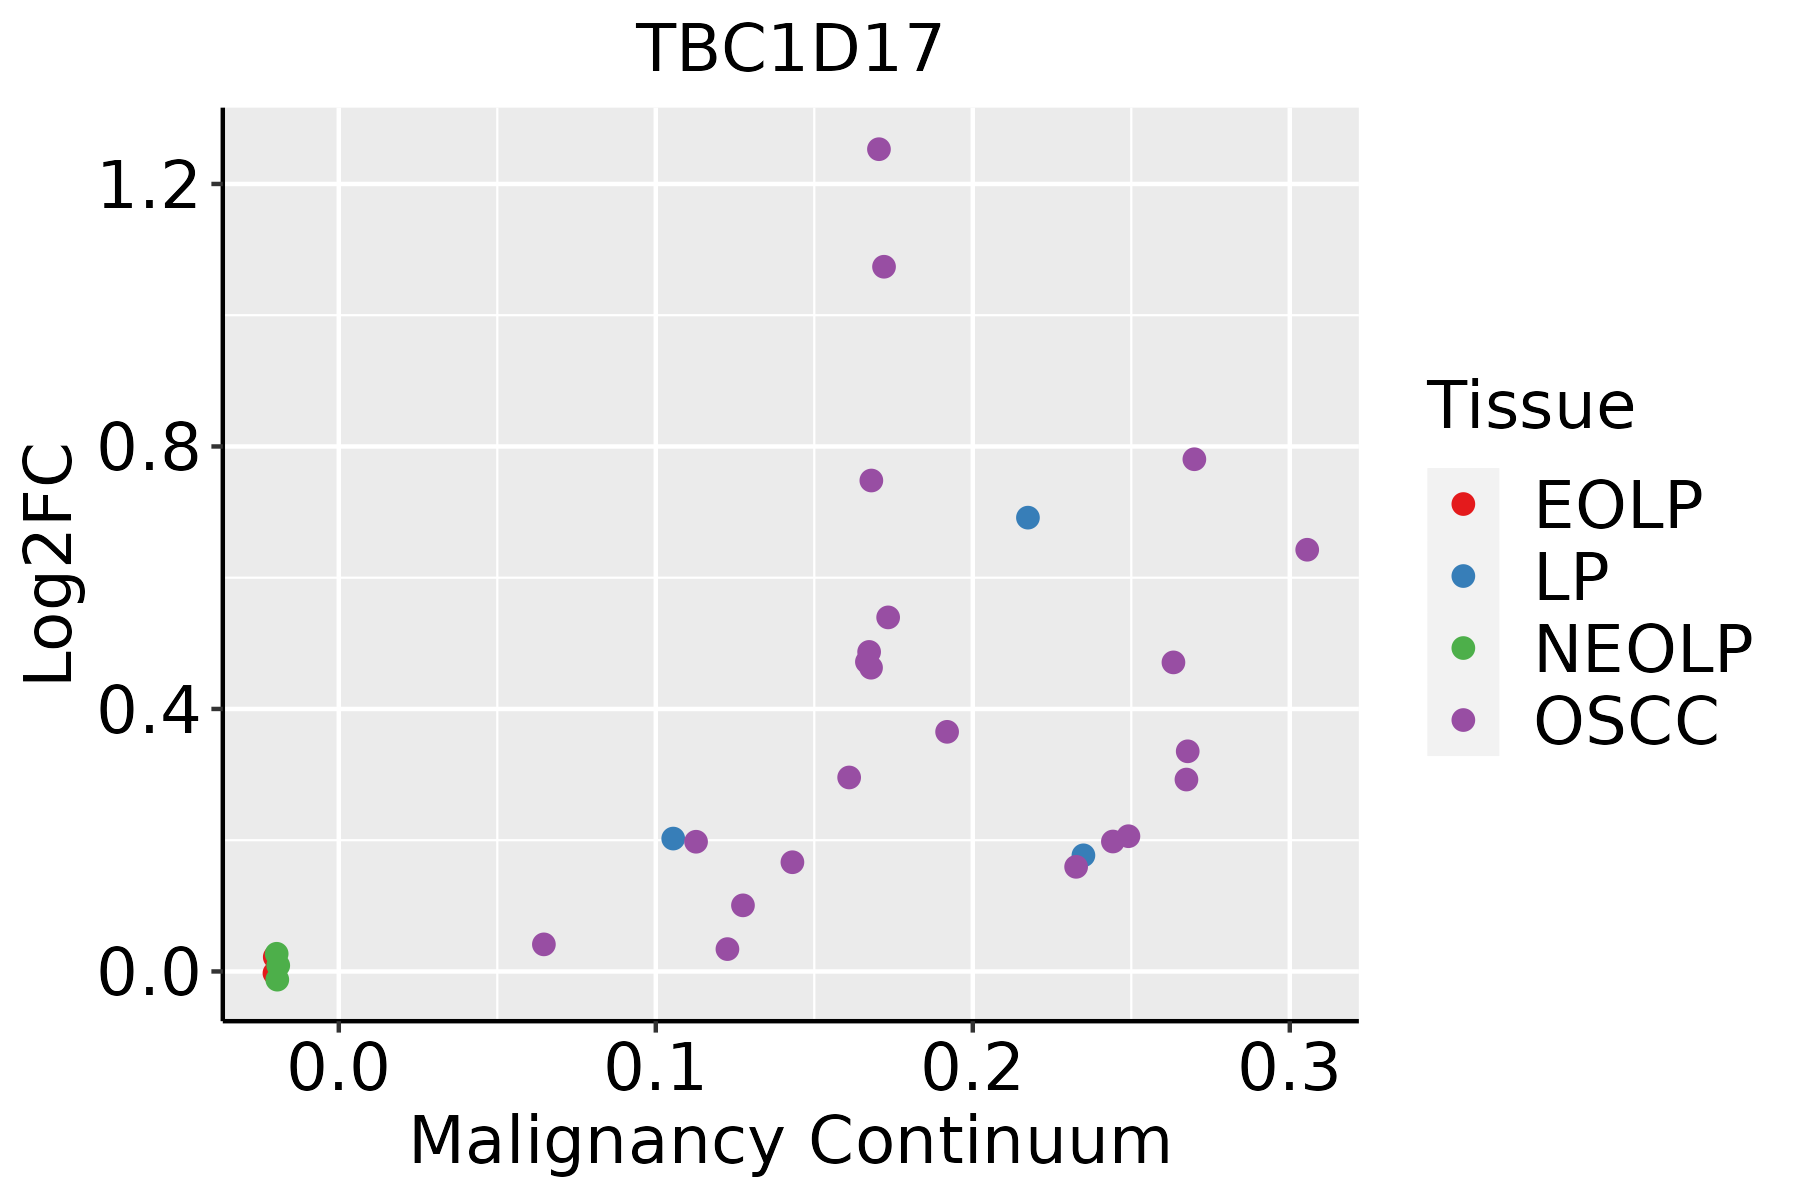 | EOLP: Erosive Oral lichen planus |
| LP: leukoplakia | ||
| NEOLP: Non-erosive oral lichen planus | ||
| OSCC: Oral squamous cell carcinoma | ||
| Thyroid | 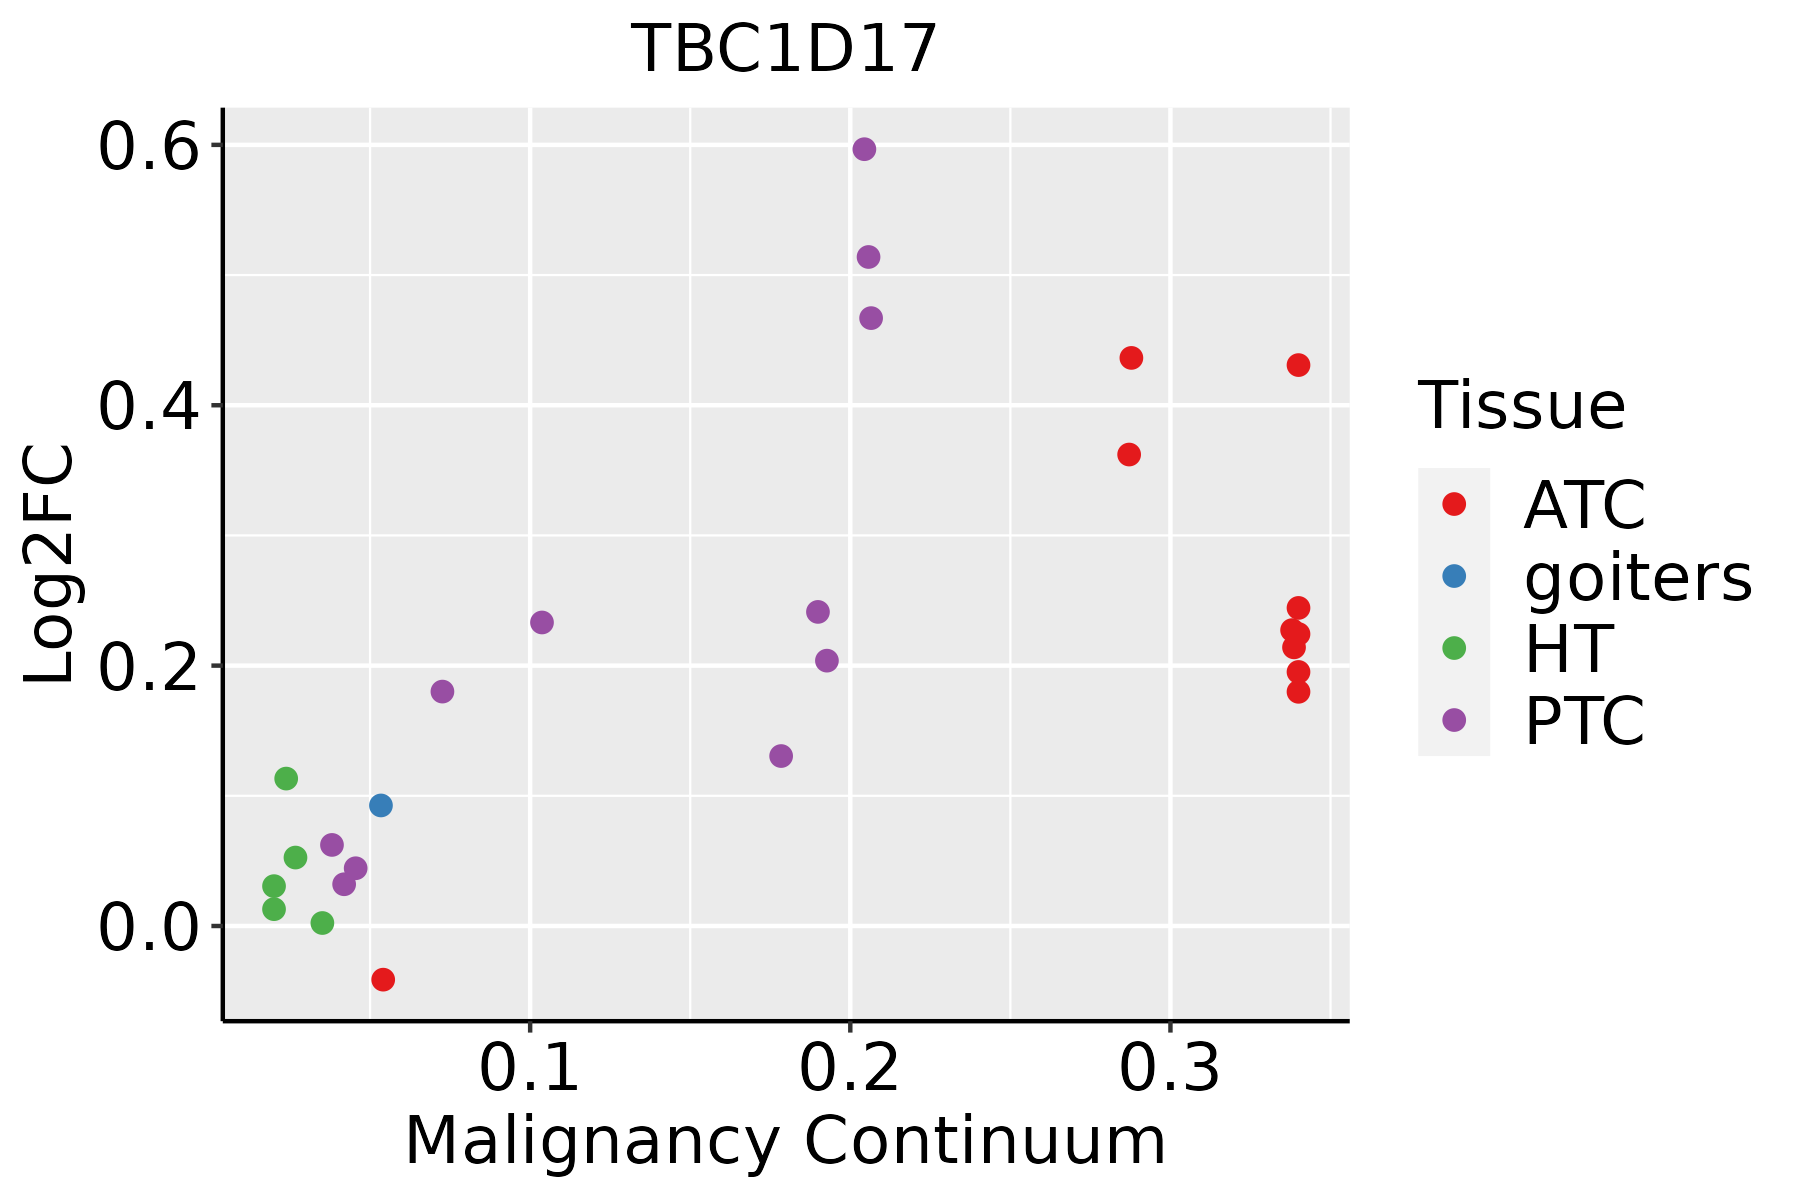 | ATC: Anaplastic thyroid cancer |
| HT: Hashimoto's thyroiditis | ||
| PTC: Papillary thyroid cancer |
| ∗log2FC in expression of this searched gene in stem-like cells from each diseased tissue sample relative to stem-like cells in normal samples in each tissue plotted against the malignancy continuum. Samples are colored based on if they are from different disease stage. |
Top |
Malignant transformation related pathway analysis |
| Find out the enriched GO biological processes and KEGG pathways involved in transition from healthy to precancer to cancer |
| Tissue | Disease Stage | Enriched GO biological Processes |
| Colorectum | AD |  |
| Colorectum | SER |  |
| Colorectum | MSS |  |
| Colorectum | MSI-H |  |
| Colorectum | FAP |  |
| ∗Top 15 enriched GO BP terms are showed in the bar plot of each disease state in each tissue. Each row represents a significant GO biological process which is colored according to the -log10(p.adjust). |
| Page: 1 2 3 4 5 6 7 8 9 |
| GO ID | Tissue | Disease Stage | Description | Gene Ratio | Bg Ratio | pvalue | p.adjust | Count |
| GO:001619715 | Esophagus | ESCC | endosomal transport | 168/8552 | 230/18723 | 2.28e-17 | 1.93e-15 | 168 |
| GO:001648210 | Esophagus | ESCC | cytosolic transport | 124/8552 | 168/18723 | 9.69e-14 | 4.69e-12 | 124 |
| GO:00421477 | Esophagus | ESCC | retrograde transport, endosome to Golgi | 63/8552 | 91/18723 | 4.58e-06 | 4.87e-05 | 63 |
| GO:004308715 | Esophagus | ESCC | regulation of GTPase activity | 183/8552 | 348/18723 | 5.34e-03 | 2.00e-02 | 183 |
| GO:00161979 | Oral cavity | OSCC | endosomal transport | 141/7305 | 230/18723 | 5.40e-12 | 2.06e-10 | 141 |
| GO:00164829 | Oral cavity | OSCC | cytosolic transport | 106/7305 | 168/18723 | 2.08e-10 | 5.90e-09 | 106 |
| GO:00421476 | Oral cavity | OSCC | retrograde transport, endosome to Golgi | 55/7305 | 91/18723 | 2.79e-05 | 2.59e-04 | 55 |
| GO:004308710 | Oral cavity | OSCC | regulation of GTPase activity | 165/7305 | 348/18723 | 7.94e-04 | 4.27e-03 | 165 |
| GO:001619718 | Thyroid | PTC | endosomal transport | 128/5968 | 230/18723 | 6.26e-14 | 3.52e-12 | 128 |
| GO:001648217 | Thyroid | PTC | cytosolic transport | 92/5968 | 168/18723 | 6.41e-10 | 1.97e-08 | 92 |
| GO:004308718 | Thyroid | PTC | regulation of GTPase activity | 148/5968 | 348/18723 | 1.63e-05 | 1.71e-04 | 148 |
| GO:00421479 | Thyroid | PTC | retrograde transport, endosome to Golgi | 48/5968 | 91/18723 | 2.86e-05 | 2.78e-04 | 48 |
| GO:004354714 | Thyroid | PTC | positive regulation of GTPase activity | 103/5968 | 255/18723 | 2.38e-03 | 1.25e-02 | 103 |
| GO:001619719 | Thyroid | ATC | endosomal transport | 128/6293 | 230/18723 | 4.44e-12 | 1.75e-10 | 128 |
| GO:001648218 | Thyroid | ATC | cytosolic transport | 93/6293 | 168/18723 | 5.19e-09 | 1.15e-07 | 93 |
| GO:004308719 | Thyroid | ATC | regulation of GTPase activity | 153/6293 | 348/18723 | 3.24e-05 | 2.68e-04 | 153 |
| GO:004214715 | Thyroid | ATC | retrograde transport, endosome to Golgi | 49/6293 | 91/18723 | 5.48e-05 | 4.23e-04 | 49 |
| GO:004354715 | Thyroid | ATC | positive regulation of GTPase activity | 106/6293 | 255/18723 | 4.58e-03 | 1.89e-02 | 106 |
| Page: 1 |
| Pathway ID | Tissue | Disease Stage | Description | Gene Ratio | Bg Ratio | pvalue | p.adjust | qvalue | Count |
| hsa04137210 | Esophagus | ESCC | Mitophagy - animal | 54/4205 | 72/8465 | 9.33e-06 | 4.96e-05 | 2.54e-05 | 54 |
| hsa0413738 | Esophagus | ESCC | Mitophagy - animal | 54/4205 | 72/8465 | 9.33e-06 | 4.96e-05 | 2.54e-05 | 54 |
| hsa0413728 | Oral cavity | OSCC | Mitophagy - animal | 58/3704 | 72/8465 | 1.48e-10 | 2.07e-09 | 1.05e-09 | 58 |
| hsa04137112 | Oral cavity | OSCC | Mitophagy - animal | 58/3704 | 72/8465 | 1.48e-10 | 2.07e-09 | 1.05e-09 | 58 |
| Page: 1 |
Top |
Cell-cell communication analysis |
| Identification of potential cell-cell interactions between two cell types and their ligand-receptor pairs for different disease states |
| Ligand | Receptor | LRpair | Pathway | Tissue | Disease Stage |
| Page: 1 |
Top |
Single-cell gene regulatory network inference analysis |
| Find out the significant the regulons (TFs) and the target genes of each regulon across cell types for different disease states |
| TF | Cell Type | Tissue | Disease Stage | Target Gene | RSS | Regulon Activity |
| ∗The dot plots of a searched regulon are shown for all cell subpopulations in each disease state of each tissue based on the regulon specific score inferred using pySCENIC and by calculating the average expression. |
| Page: 1 |
Top |
Somatic mutation of malignant transformation related genes |
| Annotation of somatic variants for genes involved in malignant transformation |
| Hugo Symbol | Variant Class | Variant Classification | dbSNP RS | HGVSc | HGVSp | HGVSp Short | SWISSPROT | BIOTYPE | SIFT | PolyPhen | Tumor Sample Barcode | Tissue | Histology | Sex | Age | Stage | Therapy Types | Drugs | Outcome |
| TBC1D17 | SNV | Missense_Mutation | novel | c.695A>G | p.Asn232Ser | p.N232S | Q9HA65 | protein_coding | deleterious(0.02) | possibly_damaging(0.596) | TCGA-A7-A6VW-01 | Breast | breast invasive carcinoma | Female | <65 | I/II | Chemotherapy | doxorubicin | CR |
| TBC1D17 | SNV | Missense_Mutation | novel | c.1237N>A | p.Asp413Asn | p.D413N | Q9HA65 | protein_coding | deleterious(0.01) | benign(0.249) | TCGA-AN-A046-01 | Breast | breast invasive carcinoma | Female | >=65 | I/II | Unknown | Unknown | SD |
| TBC1D17 | SNV | Missense_Mutation | c.166N>A | p.Asp56Asn | p.D56N | Q9HA65 | protein_coding | tolerated(0.07) | possibly_damaging(0.71) | TCGA-C8-A1HE-01 | Breast | breast invasive carcinoma | Female | <65 | I/II | Unknown | Unknown | SD | |
| TBC1D17 | SNV | Missense_Mutation | c.1205N>G | p.Asp402Gly | p.D402G | Q9HA65 | protein_coding | deleterious(0) | probably_damaging(0.994) | TCGA-D8-A1XK-01 | Breast | breast invasive carcinoma | Female | <65 | I/II | Chemotherapy | doxorubicine+cyclophosphamide | SD | |
| TBC1D17 | insertion | Nonsense_Mutation | novel | c.1508_1509insGATTTGATGTAACTTGACCTGCTGG | p.Phe504IlefsTer2 | p.F504Ifs*2 | Q9HA65 | protein_coding | TCGA-AN-A0FJ-01 | Breast | breast invasive carcinoma | Female | <65 | III/IV | Unknown | Unknown | SD | ||
| TBC1D17 | insertion | Nonsense_Mutation | novel | c.1643_1644insTTGAGTTAA | p.Ser548_Asn549insTer | p.S548_N549ins* | Q9HA65 | protein_coding | TCGA-BH-A0B1-01 | Breast | breast invasive carcinoma | Female | >=65 | I/II | Chemotherapy | adriamycin | SD | ||
| TBC1D17 | insertion | In_Frame_Ins | novel | c.1644_1645insTTGGGGGGAAAA | p.Ser548_Asn549insLeuGlyGlyLys | p.S548_N549insLGGK | Q9HA65 | protein_coding | TCGA-BH-A0B1-01 | Breast | breast invasive carcinoma | Female | >=65 | I/II | Chemotherapy | adriamycin | SD | ||
| TBC1D17 | SNV | Missense_Mutation | c.826N>A | p.Glu276Lys | p.E276K | Q9HA65 | protein_coding | tolerated(0.71) | benign(0.003) | TCGA-IR-A3LI-01 | Cervix | cervical & endocervical cancer | Female | <65 | I/II | Chemotherapy | cisplatin | CR | |
| TBC1D17 | SNV | Missense_Mutation | novel | c.123N>G | p.Asp41Glu | p.D41E | Q9HA65 | protein_coding | tolerated(0.48) | possibly_damaging(0.596) | TCGA-VS-A9V1-01 | Cervix | cervical & endocervical cancer | Female | <65 | I/II | Chemotherapy | cisplatin | PD |
| TBC1D17 | SNV | Missense_Mutation | novel | c.839C>T | p.Pro280Leu | p.P280L | Q9HA65 | protein_coding | deleterious(0) | probably_damaging(0.924) | TCGA-5M-AAT6-01 | Colorectum | colon adenocarcinoma | Female | <65 | III/IV | Unknown | Unknown | PD |
| Page: 1 2 3 4 5 6 |
Top |
Related drugs of malignant transformation related genes |
| Identification of chemicals and drugs interact with genes involved in malignant transfromation |
| (DGIdb 4.0) |
| Entrez ID | Symbol | Category | Interaction Types | Drug Claim Name | Drug Name | PMIDs |
| Page: 1 |

Copyright 2023-Present -The University of Texas Health Science Center at Houston |