
|
|||||
|
 | |
| |
| |
| |
| |
| |
|
Gene: SUGP2 |
Gene summary for SUGP2 |
| Gene information | Species | Human | Gene symbol | SUGP2 | Gene ID | 10147 |
| Gene name | SURP and G-patch domain containing 2 | |
| Gene Alias | SFRS14 | |
| Cytomap | 19p13.11 | |
| Gene Type | protein-coding | GO ID | GO:0006139 | UniProtAcc | Q8IX01 |
Top |
Malignant transformation analysis |
| Identification of the aberrant gene expression in precancerous and cancerous lesions by comparing the gene expression of stem-like cells in diseased tissues with normal stem cells |
| Entrez ID | Symbol | Replicates | Species | Organ | Tissue | Adj P-value | Log2FC | Malignancy |
| 10147 | SUGP2 | P54T-E | Human | Esophagus | ESCC | 4.44e-14 | 3.12e-01 | 0.0975 |
| 10147 | SUGP2 | P56T-E | Human | Esophagus | ESCC | 3.90e-03 | 2.39e-01 | 0.1613 |
| 10147 | SUGP2 | P57T-E | Human | Esophagus | ESCC | 4.26e-10 | 1.87e-01 | 0.0926 |
| 10147 | SUGP2 | P61T-E | Human | Esophagus | ESCC | 1.51e-18 | 3.45e-01 | 0.099 |
| 10147 | SUGP2 | P62T-E | Human | Esophagus | ESCC | 7.84e-19 | 2.73e-01 | 0.1302 |
| 10147 | SUGP2 | P65T-E | Human | Esophagus | ESCC | 4.43e-04 | 3.70e-02 | 0.0978 |
| 10147 | SUGP2 | P74T-E | Human | Esophagus | ESCC | 3.05e-05 | 9.63e-02 | 0.1479 |
| 10147 | SUGP2 | P75T-E | Human | Esophagus | ESCC | 3.83e-07 | 1.37e-01 | 0.1125 |
| 10147 | SUGP2 | P76T-E | Human | Esophagus | ESCC | 3.56e-12 | 7.11e-02 | 0.1207 |
| 10147 | SUGP2 | P79T-E | Human | Esophagus | ESCC | 2.14e-11 | 4.05e-02 | 0.1154 |
| 10147 | SUGP2 | P80T-E | Human | Esophagus | ESCC | 1.71e-08 | 2.38e-01 | 0.155 |
| 10147 | SUGP2 | P82T-E | Human | Esophagus | ESCC | 3.44e-05 | 2.42e-01 | 0.1072 |
| 10147 | SUGP2 | P83T-E | Human | Esophagus | ESCC | 1.01e-13 | 3.89e-01 | 0.1738 |
| 10147 | SUGP2 | P89T-E | Human | Esophagus | ESCC | 1.43e-02 | 2.76e-01 | 0.1752 |
| 10147 | SUGP2 | P91T-E | Human | Esophagus | ESCC | 3.95e-05 | 4.91e-01 | 0.1828 |
| 10147 | SUGP2 | P104T-E | Human | Esophagus | ESCC | 3.77e-02 | 1.51e-01 | 0.0931 |
| 10147 | SUGP2 | P107T-E | Human | Esophagus | ESCC | 1.32e-11 | 2.23e-01 | 0.171 |
| 10147 | SUGP2 | P127T-E | Human | Esophagus | ESCC | 2.05e-05 | 7.53e-02 | 0.0826 |
| 10147 | SUGP2 | P128T-E | Human | Esophagus | ESCC | 2.56e-15 | 4.30e-01 | 0.1241 |
| 10147 | SUGP2 | P130T-E | Human | Esophagus | ESCC | 9.02e-23 | 4.09e-01 | 0.1676 |
| Page: 1 2 3 4 5 6 |
| Tissue | Expression Dynamics | Abbreviation |
| Esophagus |  | ESCC: Esophageal squamous cell carcinoma |
| HGIN: High-grade intraepithelial neoplasias | ||
| LGIN: Low-grade intraepithelial neoplasias | ||
| Liver | 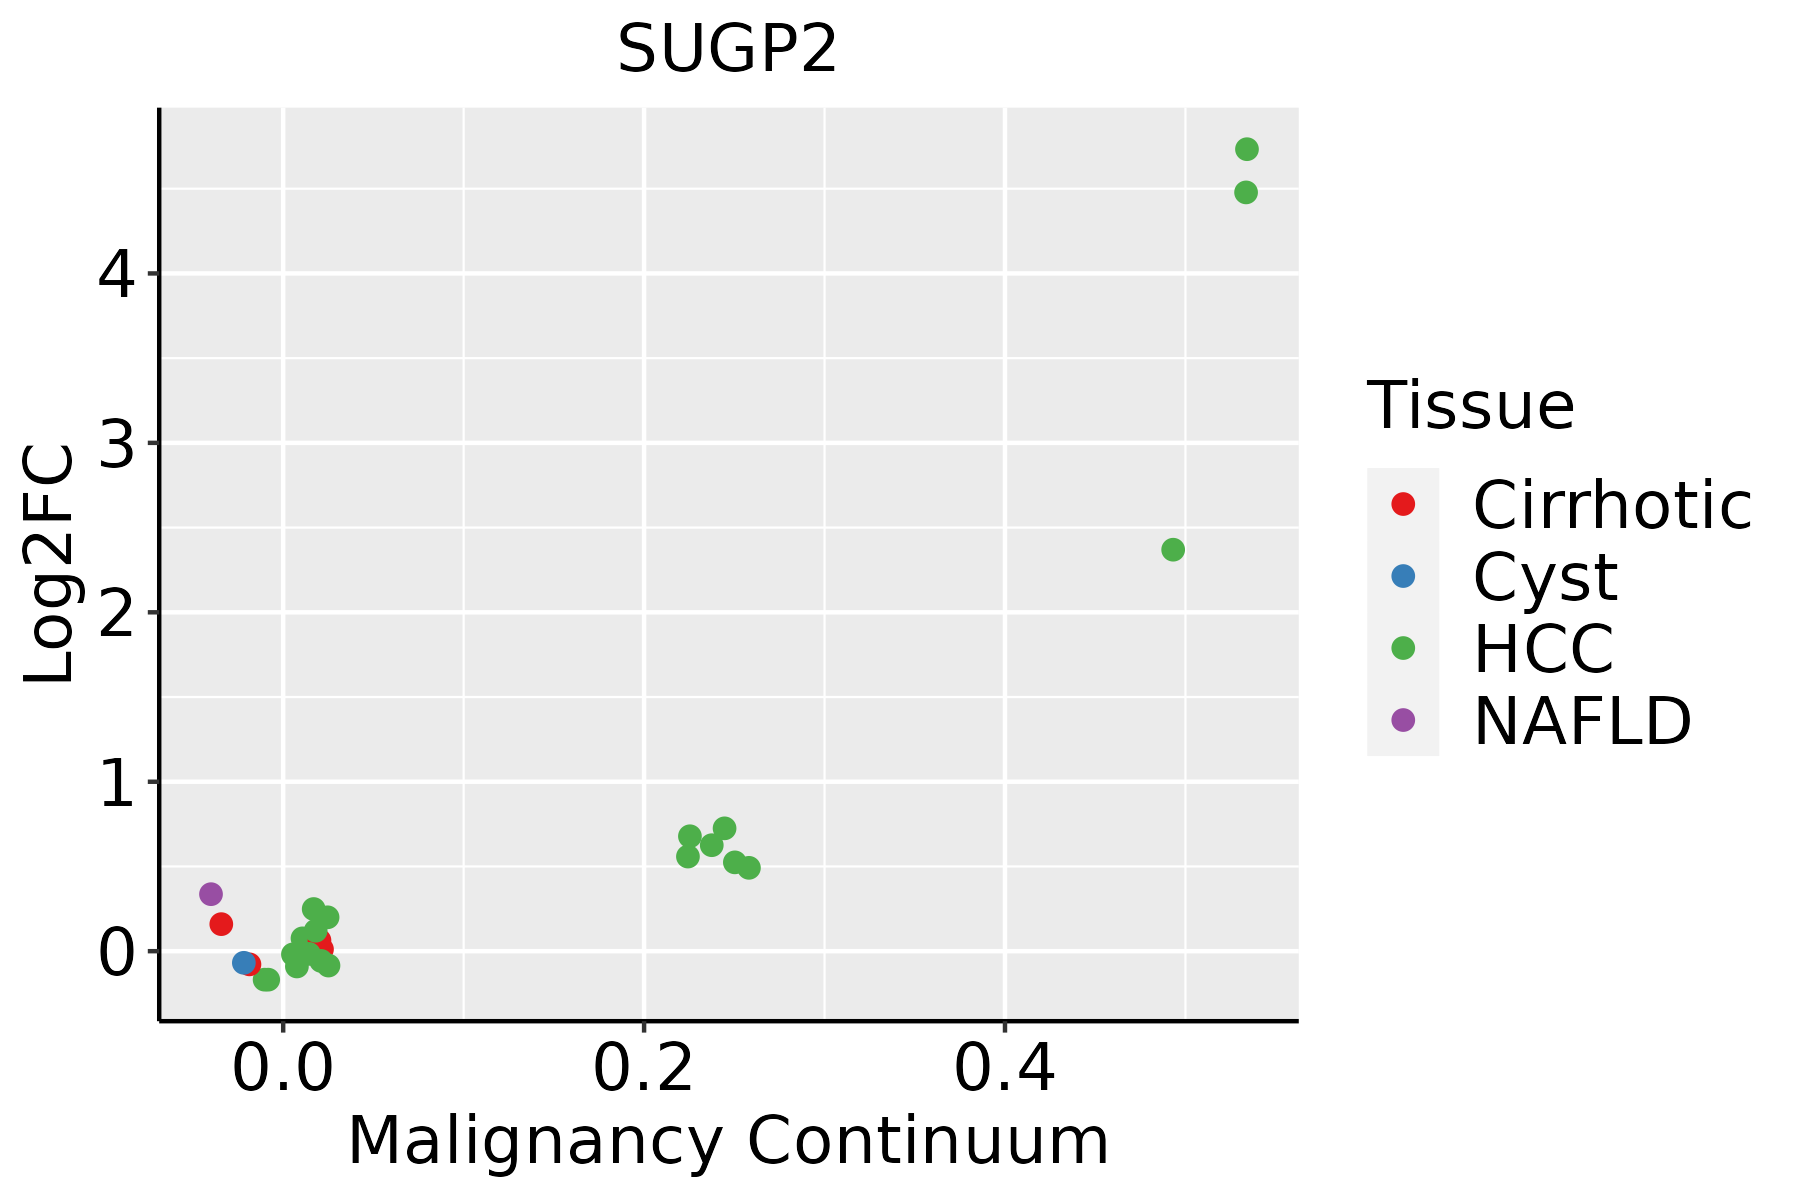 | HCC: Hepatocellular carcinoma |
| NAFLD: Non-alcoholic fatty liver disease | ||
| Oral Cavity | 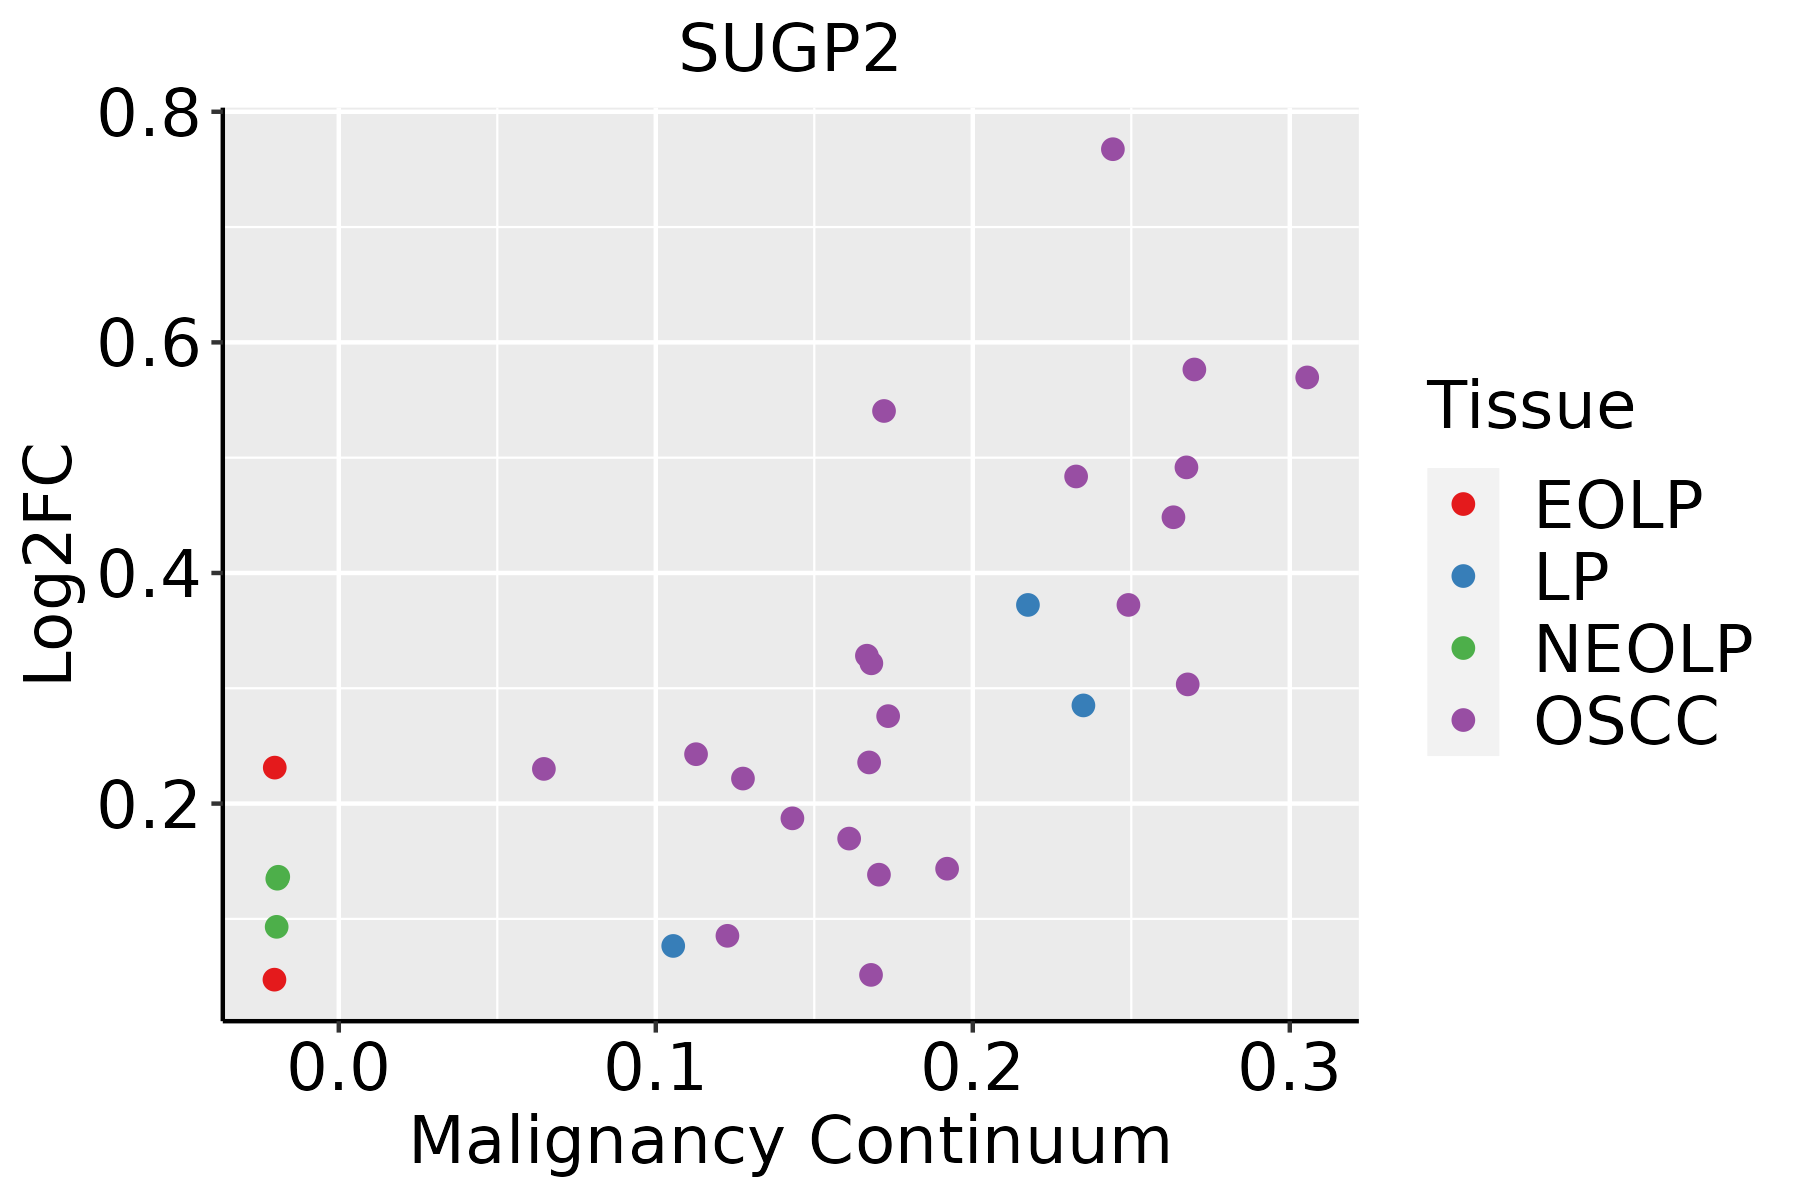 | EOLP: Erosive Oral lichen planus |
| LP: leukoplakia | ||
| NEOLP: Non-erosive oral lichen planus | ||
| OSCC: Oral squamous cell carcinoma | ||
| Thyroid | 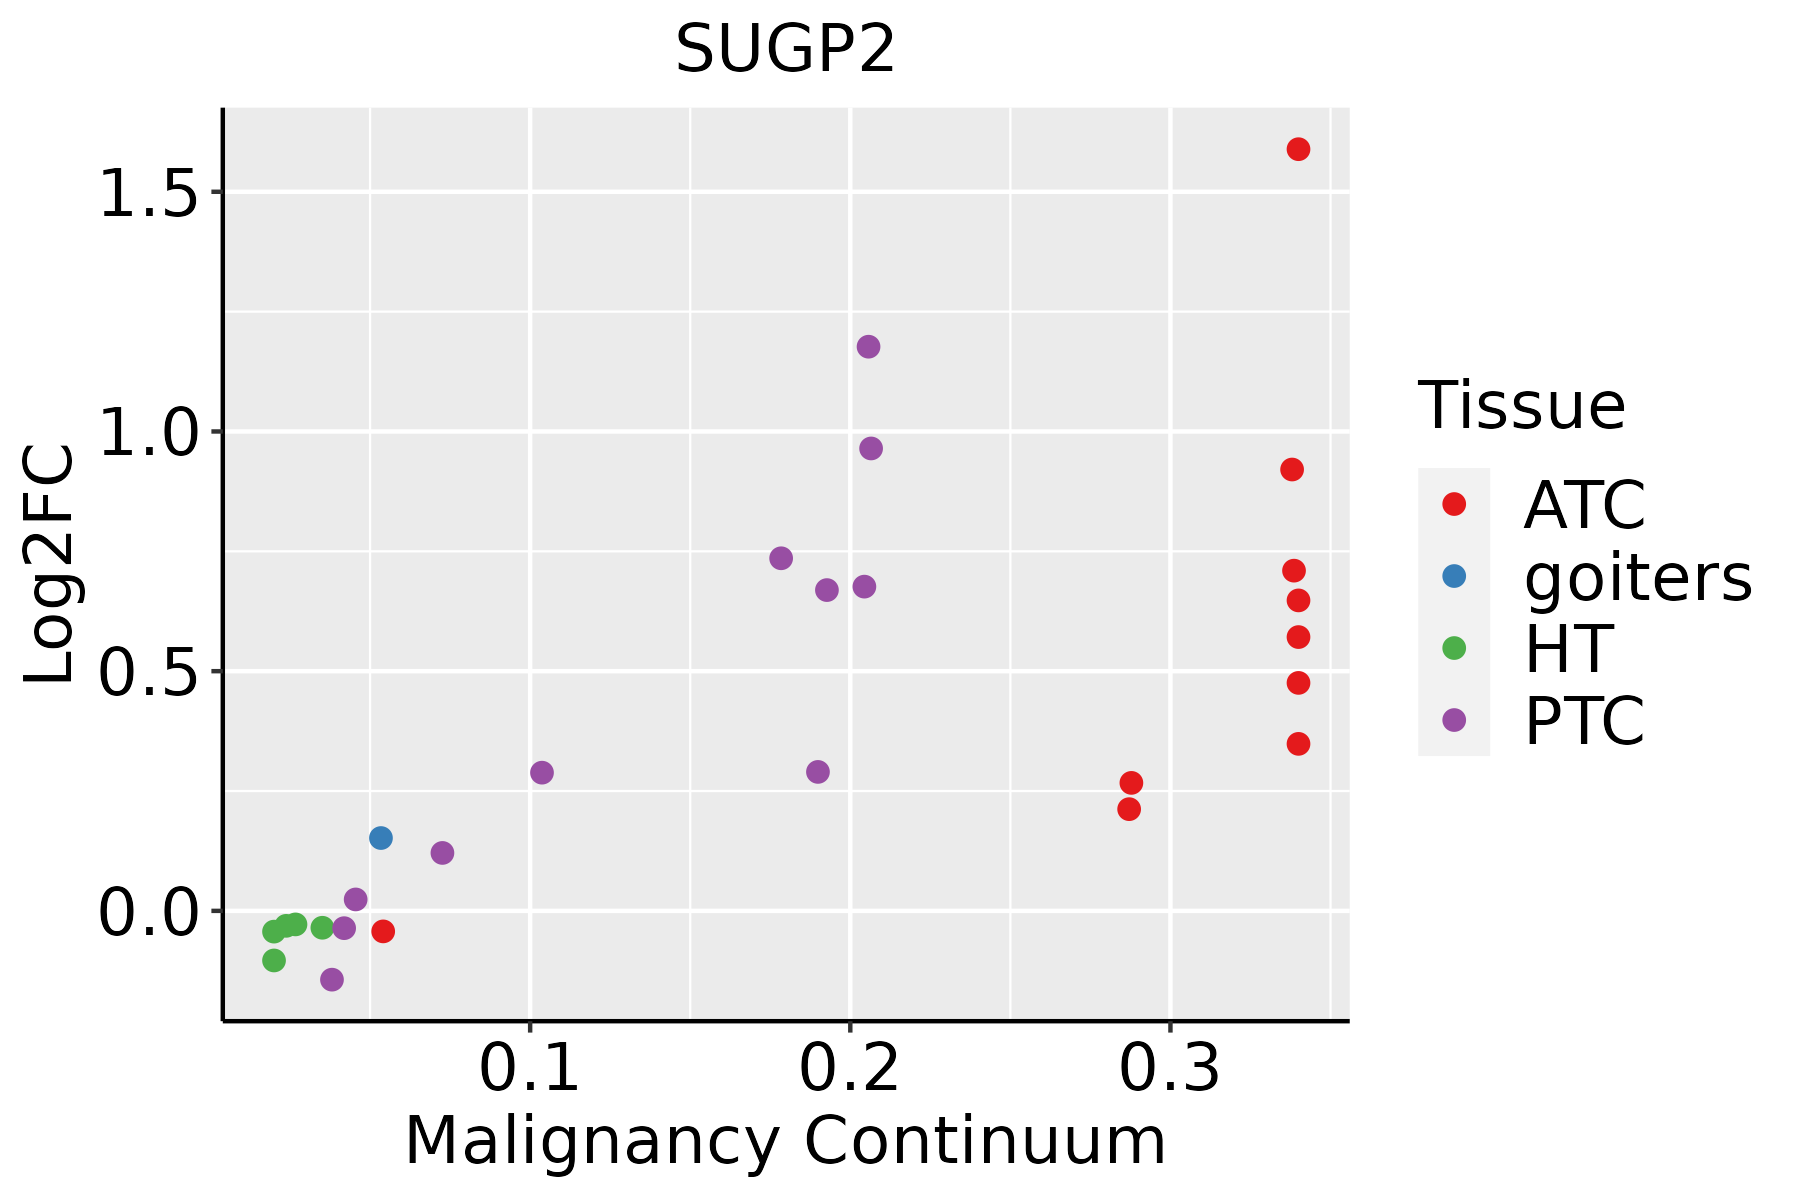 | ATC: Anaplastic thyroid cancer |
| HT: Hashimoto's thyroiditis | ||
| PTC: Papillary thyroid cancer |
| ∗log2FC in expression of this searched gene in stem-like cells from each diseased tissue sample relative to stem-like cells in normal samples in each tissue plotted against the malignancy continuum. Samples are colored based on if they are from different disease stage. |
Top |
Malignant transformation related pathway analysis |
| Find out the enriched GO biological processes and KEGG pathways involved in transition from healthy to precancer to cancer |
| Tissue | Disease Stage | Enriched GO biological Processes |
| Colorectum | AD |  |
| Colorectum | SER |  |
| Colorectum | MSS |  |
| Colorectum | MSI-H |  |
| Colorectum | FAP |  |
| ∗Top 15 enriched GO BP terms are showed in the bar plot of each disease state in each tissue. Each row represents a significant GO biological process which is colored according to the -log10(p.adjust). |
| Page: 1 2 3 4 5 6 7 8 9 |
| GO ID | Tissue | Disease Stage | Description | Gene Ratio | Bg Ratio | pvalue | p.adjust | Count |
| GO:000838026 | Esophagus | HGIN | RNA splicing | 160/2587 | 434/18723 | 3.74e-34 | 1.12e-30 | 160 |
| GO:0008380111 | Esophagus | ESCC | RNA splicing | 336/8552 | 434/18723 | 1.74e-42 | 3.67e-39 | 336 |
| GO:00083807 | Liver | NAFLD | RNA splicing | 70/1882 | 434/18723 | 4.62e-05 | 1.10e-03 | 70 |
| GO:000838022 | Liver | HCC | RNA splicing | 313/7958 | 434/18723 | 1.36e-36 | 1.73e-33 | 313 |
| GO:000838020 | Oral cavity | OSCC | RNA splicing | 308/7305 | 434/18723 | 2.43e-42 | 7.70e-39 | 308 |
| GO:000838025 | Oral cavity | EOLP | RNA splicing | 115/2218 | 434/18723 | 2.24e-17 | 3.04e-14 | 115 |
| GO:0008380113 | Thyroid | PTC | RNA splicing | 273/5968 | 434/18723 | 4.44e-41 | 1.40e-37 | 273 |
| GO:000838034 | Thyroid | ATC | RNA splicing | 270/6293 | 434/18723 | 7.50e-35 | 1.19e-31 | 270 |
| Page: 1 |
| Pathway ID | Tissue | Disease Stage | Description | Gene Ratio | Bg Ratio | pvalue | p.adjust | qvalue | Count |
| Page: 1 |
Top |
Cell-cell communication analysis |
| Identification of potential cell-cell interactions between two cell types and their ligand-receptor pairs for different disease states |
| Ligand | Receptor | LRpair | Pathway | Tissue | Disease Stage |
| Page: 1 |
Top |
Single-cell gene regulatory network inference analysis |
| Find out the significant the regulons (TFs) and the target genes of each regulon across cell types for different disease states |
| TF | Cell Type | Tissue | Disease Stage | Target Gene | RSS | Regulon Activity |
| ∗The dot plots of a searched regulon are shown for all cell subpopulations in each disease state of each tissue based on the regulon specific score inferred using pySCENIC and by calculating the average expression. |
| Page: 1 |
Top |
Somatic mutation of malignant transformation related genes |
| Annotation of somatic variants for genes involved in malignant transformation |
| Hugo Symbol | Variant Class | Variant Classification | dbSNP RS | HGVSc | HGVSp | HGVSp Short | SWISSPROT | BIOTYPE | SIFT | PolyPhen | Tumor Sample Barcode | Tissue | Histology | Sex | Age | Stage | Therapy Types | Drugs | Outcome |
| SUGP2 | SNV | Missense_Mutation | novel | c.2797A>C | p.Thr933Pro | p.T933P | protein_coding | tolerated(0.58) | benign(0) | TCGA-A2-A0D1-01 | Breast | breast invasive carcinoma | Female | >=65 | I/II | Chemotherapy | taxotere | SD | |
| SUGP2 | SNV | Missense_Mutation | c.2698N>C | p.Glu900Gln | p.E900Q | protein_coding | tolerated(0.11) | benign(0.031) | TCGA-A8-A0A7-01 | Breast | breast invasive carcinoma | Female | <65 | I/II | Unknown | Unknown | SD | ||
| SUGP2 | SNV | Missense_Mutation | novel | c.2797N>C | p.Thr933Pro | p.T933P | protein_coding | tolerated(0.58) | benign(0) | TCGA-AR-A1AX-01 | Breast | breast invasive carcinoma | Female | <65 | I/II | Chemotherapy | cytoxan | SD | |
| SUGP2 | SNV | Missense_Mutation | c.1058N>C | p.His353Pro | p.H353P | protein_coding | deleterious(0) | probably_damaging(0.999) | TCGA-BH-A0BZ-01 | Breast | breast invasive carcinoma | Female | <65 | III/IV | Chemotherapy | doxorubicin | CR | ||
| SUGP2 | SNV | Missense_Mutation | novel | c.2857N>A | p.Leu953Met | p.L953M | protein_coding | tolerated(0.15) | possibly_damaging(0.495) | TCGA-BH-A0E2-01 | Breast | breast invasive carcinoma | Female | <65 | III/IV | Chemotherapy | doxorubicin | SD | |
| SUGP2 | SNV | Missense_Mutation | c.260G>C | p.Arg87Thr | p.R87T | protein_coding | deleterious_low_confidence(0.01) | benign(0.258) | TCGA-E2-A10C-01 | Breast | breast invasive carcinoma | Female | <65 | I/II | Chemotherapy | cytoxan | SD | ||
| SUGP2 | SNV | Missense_Mutation | c.3023N>T | p.Ser1008Phe | p.S1008F | protein_coding | deleterious(0) | possibly_damaging(0.601) | TCGA-E9-A1RF-01 | Breast | breast invasive carcinoma | Female | >=65 | III/IV | Hormone Therapy | tamoxiphen | SD | ||
| SUGP2 | SNV | Missense_Mutation | rs375174157 | c.1984G>A | p.Asp662Asn | p.D662N | protein_coding | tolerated(0.13) | benign(0.378) | TCGA-UL-AAZ6-01 | Breast | breast invasive carcinoma | Female | >=65 | I/II | Chemotherapy | herceptin | SD | |
| SUGP2 | insertion | Nonsense_Mutation | novel | c.3189_3190insTTTTCCTTGTAAAAGATGAAAAACCAAACCCAGATGT | p.Glu1064PhefsTer4 | p.E1064Ffs*4 | protein_coding | TCGA-AN-A03Y-01 | Breast | breast invasive carcinoma | Female | >=65 | I/II | Unknown | Unknown | SD | |||
| SUGP2 | insertion | In_Frame_Ins | novel | c.2855_2856insACACACACAAGATACACA | p.Ala952_Leu953insHisThrGlnAspThrHis | p.A952_L953insHTQDTH | protein_coding | TCGA-BH-A0E2-01 | Breast | breast invasive carcinoma | Female | <65 | III/IV | Chemotherapy | doxorubicin | SD |
| Page: 1 2 3 4 5 6 7 8 9 10 |
Top |
Related drugs of malignant transformation related genes |
| Identification of chemicals and drugs interact with genes involved in malignant transfromation |
| (DGIdb 4.0) |
| Entrez ID | Symbol | Category | Interaction Types | Drug Claim Name | Drug Name | PMIDs |
| Page: 1 |

Copyright 2023-Present -The University of Texas Health Science Center at Houston |