
|
|||||
|
 | |
| |
| |
| |
| |
| |
|
Gene: STARD3 |
Gene summary for STARD3 |
| Gene information | Species | Human | Gene symbol | STARD3 | Gene ID | 10948 |
| Gene name | StAR related lipid transfer domain containing 3 | |
| Gene Alias | CAB1 | |
| Cytomap | 17q12 | |
| Gene Type | protein-coding | GO ID | GO:0006066 | UniProtAcc | Q14849 |
Top |
Malignant transformation analysis |
| Identification of the aberrant gene expression in precancerous and cancerous lesions by comparing the gene expression of stem-like cells in diseased tissues with normal stem cells |
| Entrez ID | Symbol | Replicates | Species | Organ | Tissue | Adj P-value | Log2FC | Malignancy |
| 10948 | STARD3 | P31T-E | Human | Esophagus | ESCC | 2.48e-30 | 4.60e-01 | 0.1251 |
| 10948 | STARD3 | P32T-E | Human | Esophagus | ESCC | 3.58e-51 | 8.30e-01 | 0.1666 |
| 10948 | STARD3 | P36T-E | Human | Esophagus | ESCC | 1.48e-33 | 1.28e+00 | 0.1187 |
| 10948 | STARD3 | P37T-E | Human | Esophagus | ESCC | 1.98e-26 | 4.81e-01 | 0.1371 |
| 10948 | STARD3 | P38T-E | Human | Esophagus | ESCC | 8.76e-13 | 3.93e-01 | 0.127 |
| 10948 | STARD3 | P39T-E | Human | Esophagus | ESCC | 1.25e-19 | 2.95e-01 | 0.0894 |
| 10948 | STARD3 | P40T-E | Human | Esophagus | ESCC | 5.93e-14 | 2.68e-01 | 0.109 |
| 10948 | STARD3 | P42T-E | Human | Esophagus | ESCC | 8.15e-21 | 4.63e-01 | 0.1175 |
| 10948 | STARD3 | P44T-E | Human | Esophagus | ESCC | 2.51e-15 | 3.64e-01 | 0.1096 |
| 10948 | STARD3 | P47T-E | Human | Esophagus | ESCC | 1.43e-22 | 2.78e-01 | 0.1067 |
| 10948 | STARD3 | P48T-E | Human | Esophagus | ESCC | 2.38e-18 | 2.88e-01 | 0.0959 |
| 10948 | STARD3 | P49T-E | Human | Esophagus | ESCC | 2.54e-11 | 1.13e+00 | 0.1768 |
| 10948 | STARD3 | P52T-E | Human | Esophagus | ESCC | 3.14e-26 | 5.39e-01 | 0.1555 |
| 10948 | STARD3 | P54T-E | Human | Esophagus | ESCC | 8.15e-10 | 2.91e-01 | 0.0975 |
| 10948 | STARD3 | P56T-E | Human | Esophagus | ESCC | 9.81e-08 | 1.04e+00 | 0.1613 |
| 10948 | STARD3 | P57T-E | Human | Esophagus | ESCC | 1.12e-26 | 5.24e-01 | 0.0926 |
| 10948 | STARD3 | P61T-E | Human | Esophagus | ESCC | 8.76e-27 | 5.46e-01 | 0.099 |
| 10948 | STARD3 | P62T-E | Human | Esophagus | ESCC | 6.81e-51 | 9.15e-01 | 0.1302 |
| 10948 | STARD3 | P65T-E | Human | Esophagus | ESCC | 1.74e-24 | 6.12e-01 | 0.0978 |
| 10948 | STARD3 | P74T-E | Human | Esophagus | ESCC | 2.01e-26 | 8.57e-01 | 0.1479 |
| Page: 1 2 3 4 5 6 7 |
| Tissue | Expression Dynamics | Abbreviation |
| Breast | 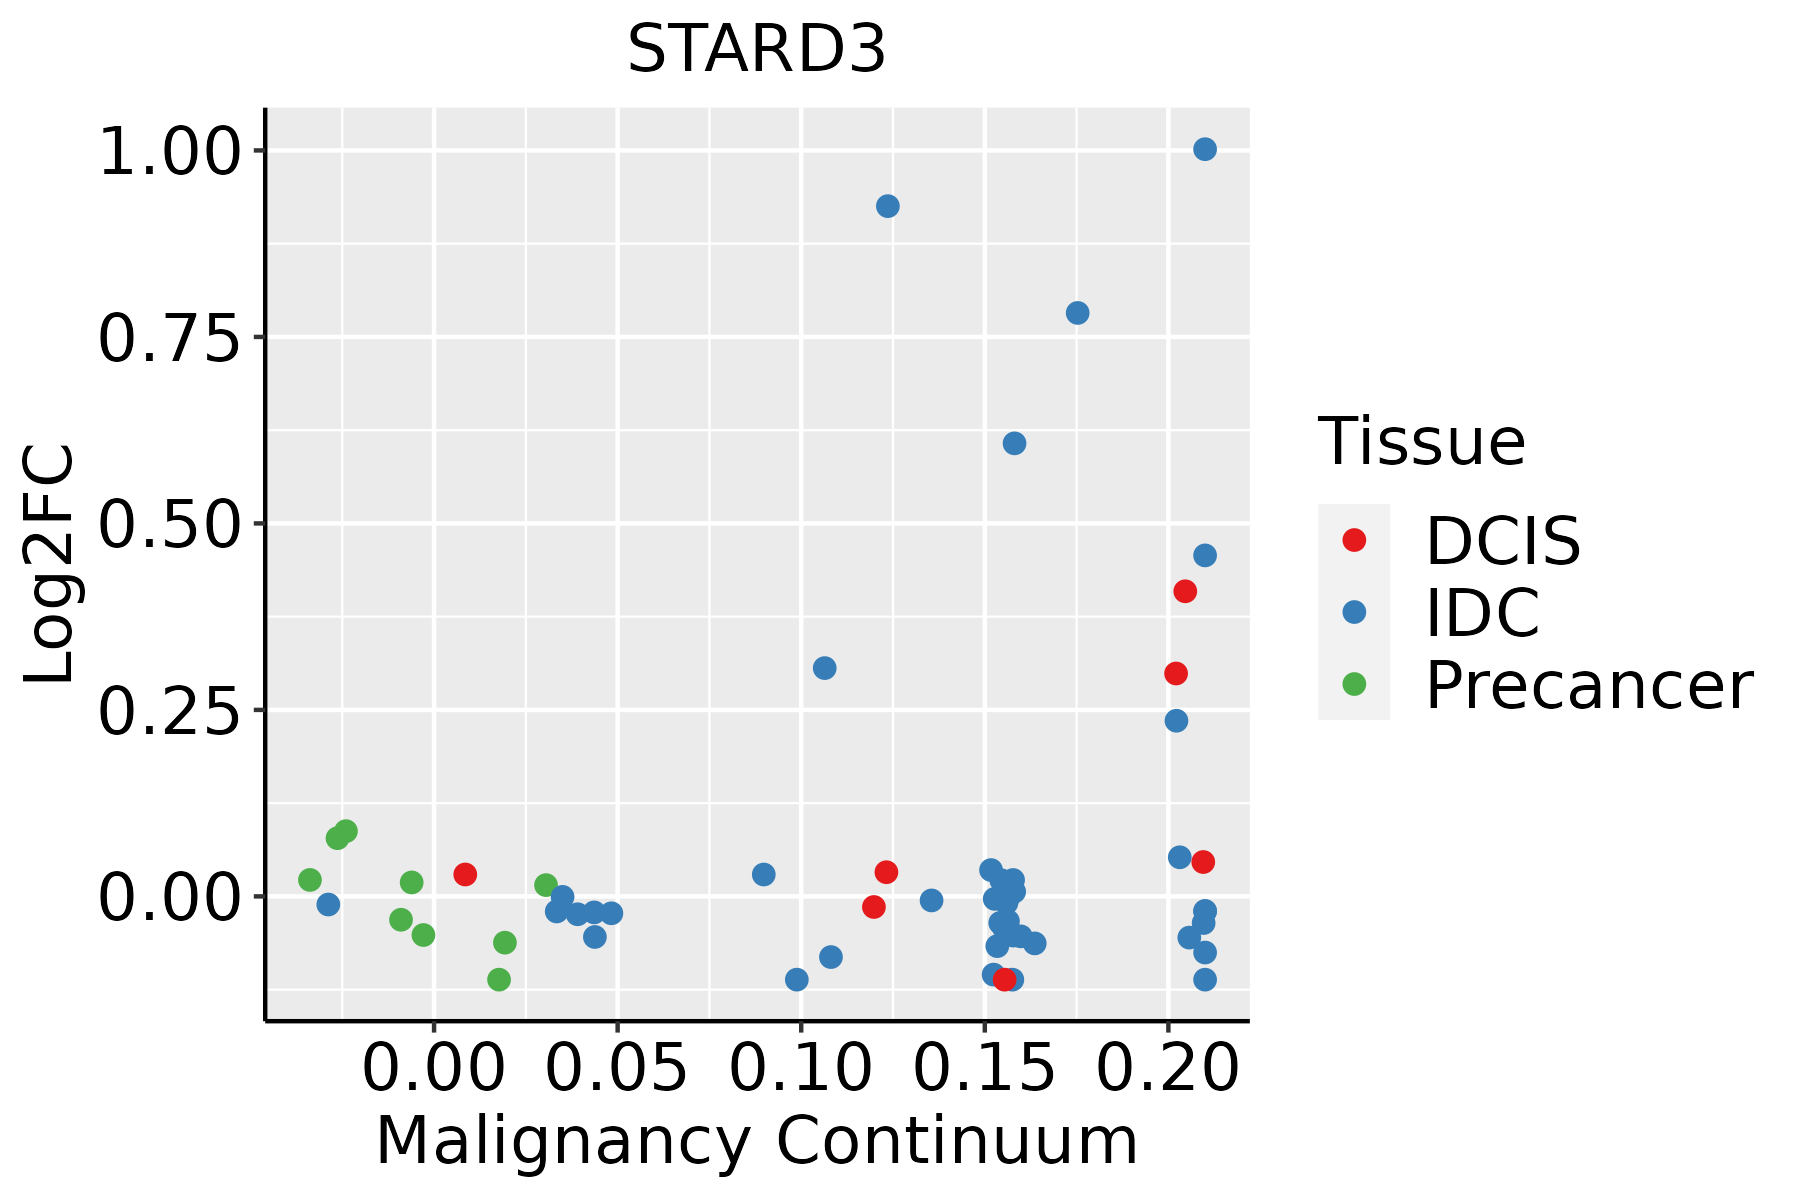 | IDC: Invasive ductal carcinoma |
| DCIS: Ductal carcinoma in situ | ||
| Precancer(BRCA1-mut): Precancerous lesion from BRCA1 mutation carriers | ||
| Esophagus | 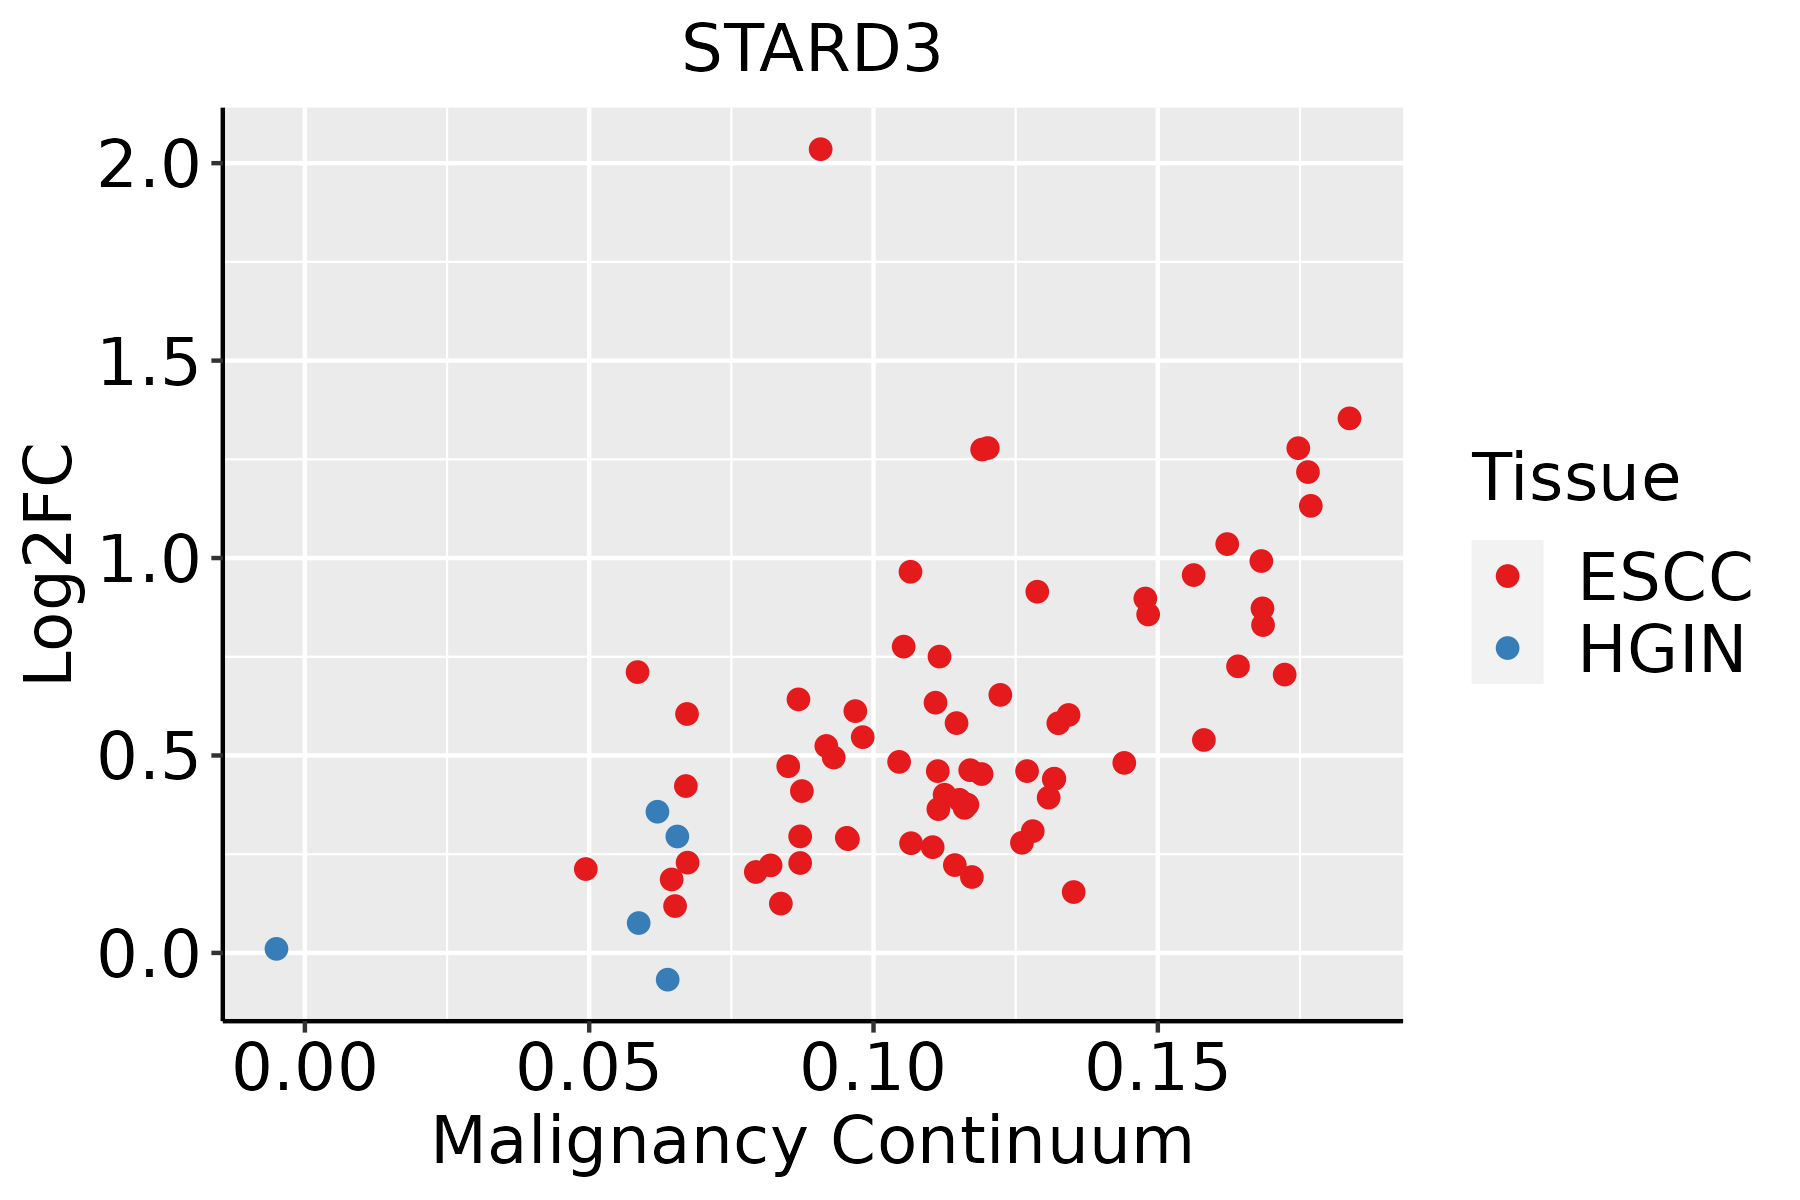 | ESCC: Esophageal squamous cell carcinoma |
| HGIN: High-grade intraepithelial neoplasias | ||
| LGIN: Low-grade intraepithelial neoplasias | ||
| Liver | 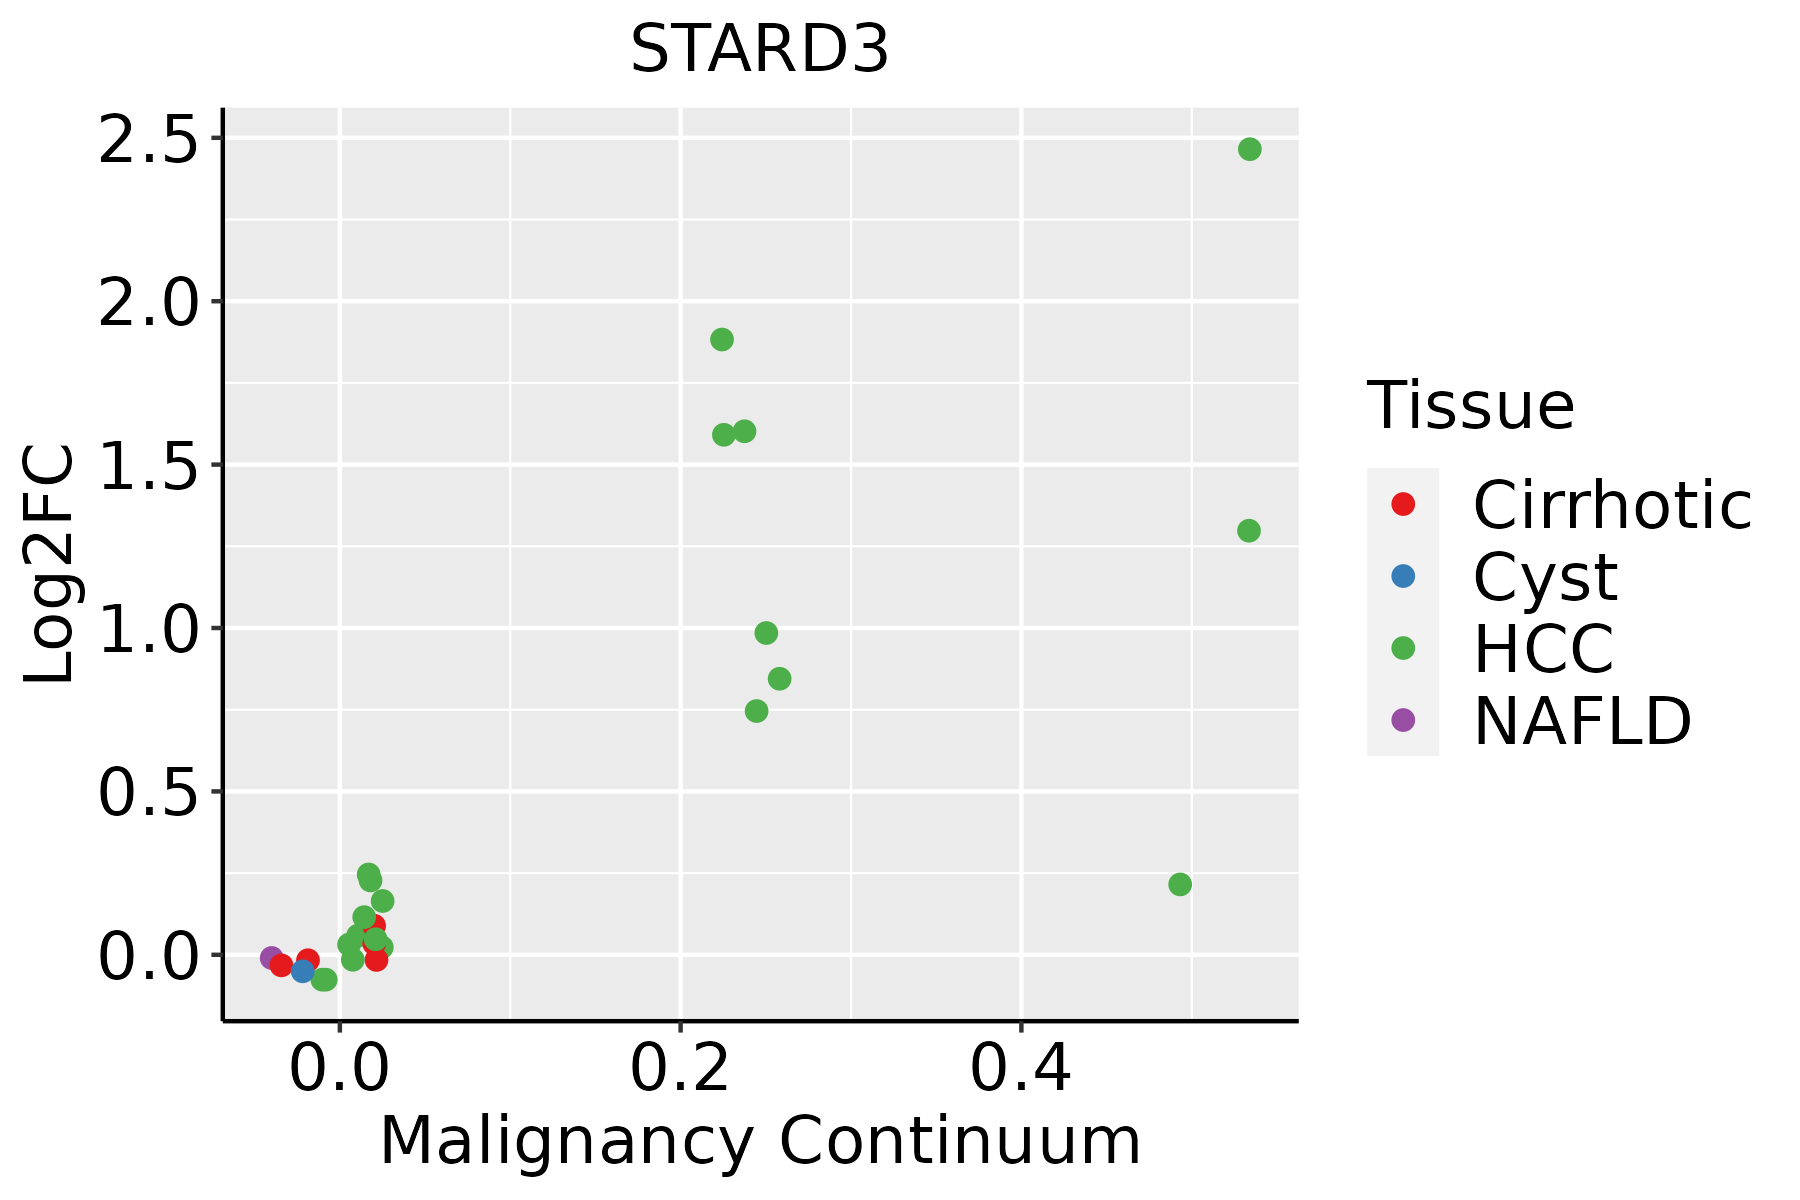 | HCC: Hepatocellular carcinoma |
| NAFLD: Non-alcoholic fatty liver disease | ||
| Oral Cavity | 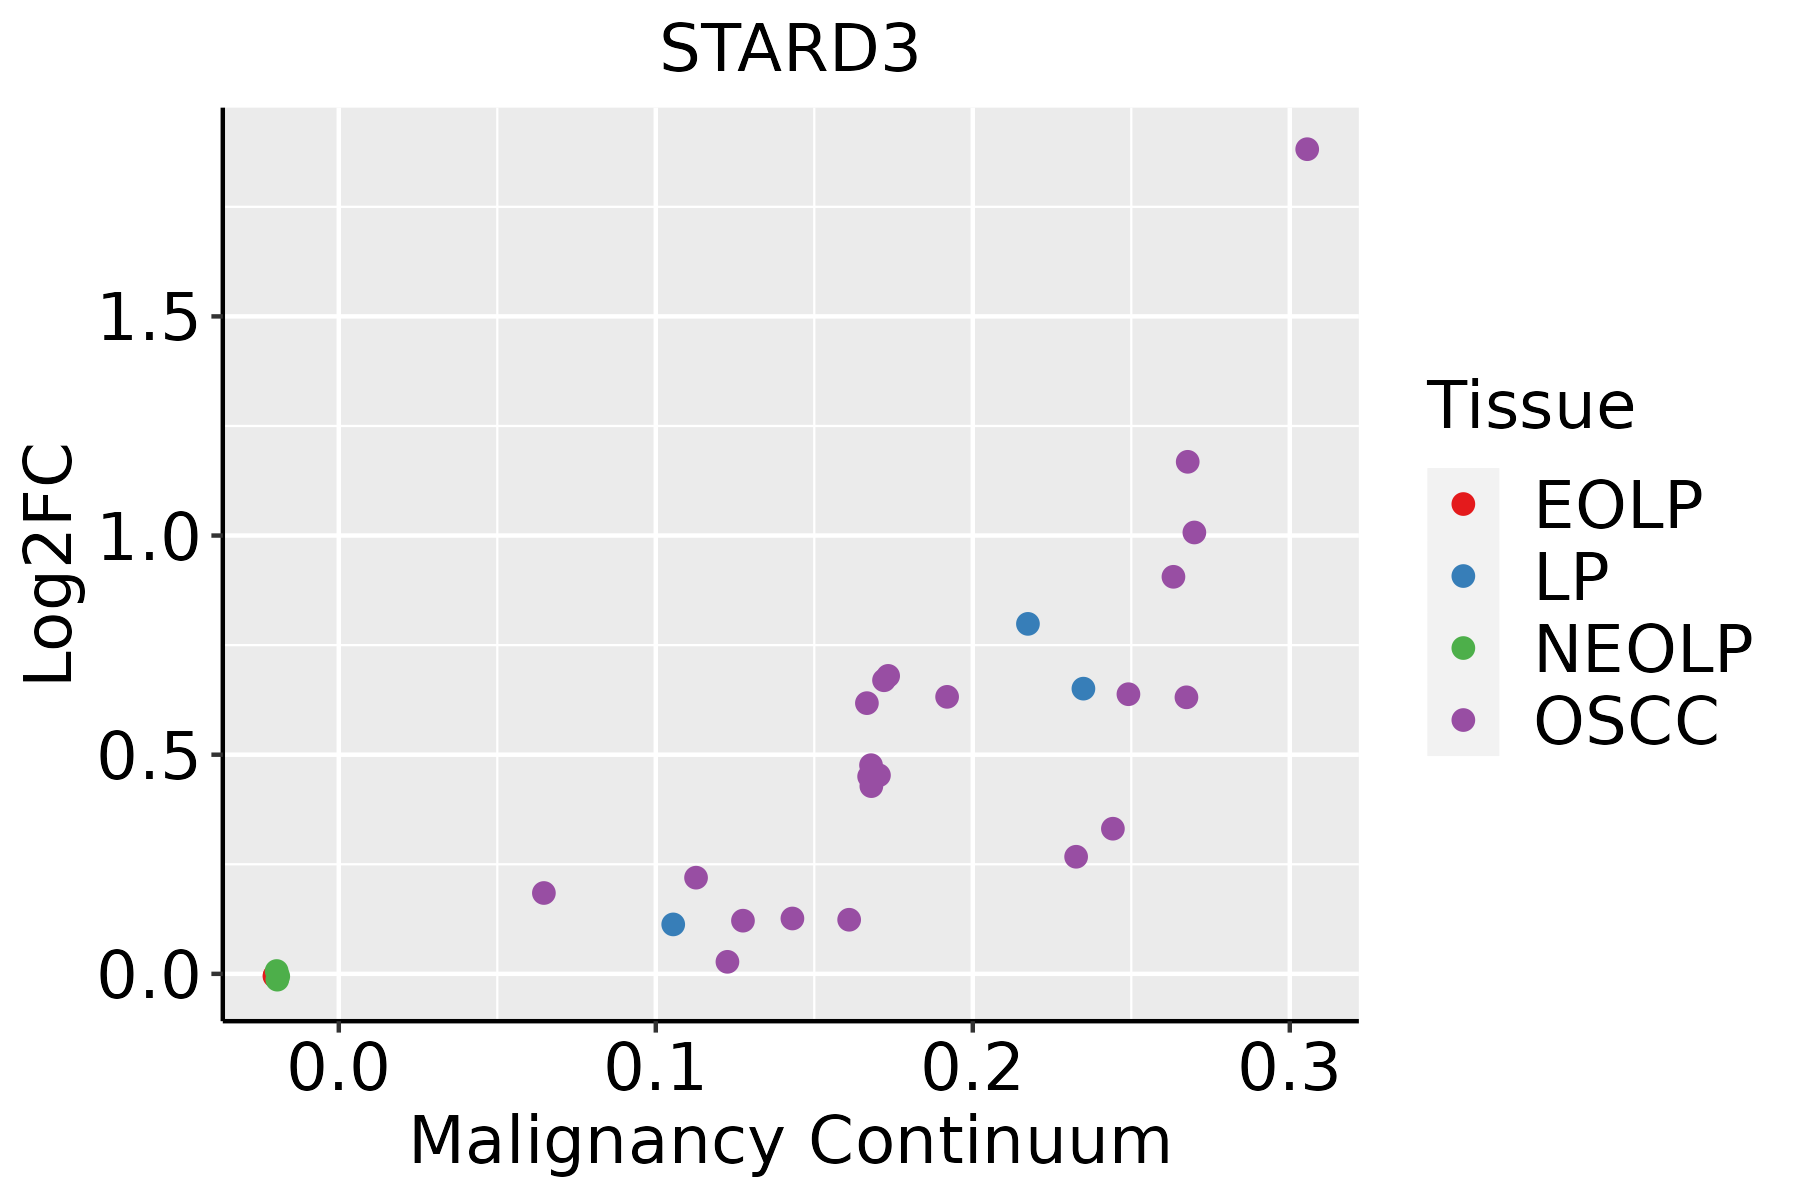 | EOLP: Erosive Oral lichen planus |
| LP: leukoplakia | ||
| NEOLP: Non-erosive oral lichen planus | ||
| OSCC: Oral squamous cell carcinoma | ||
| Skin | 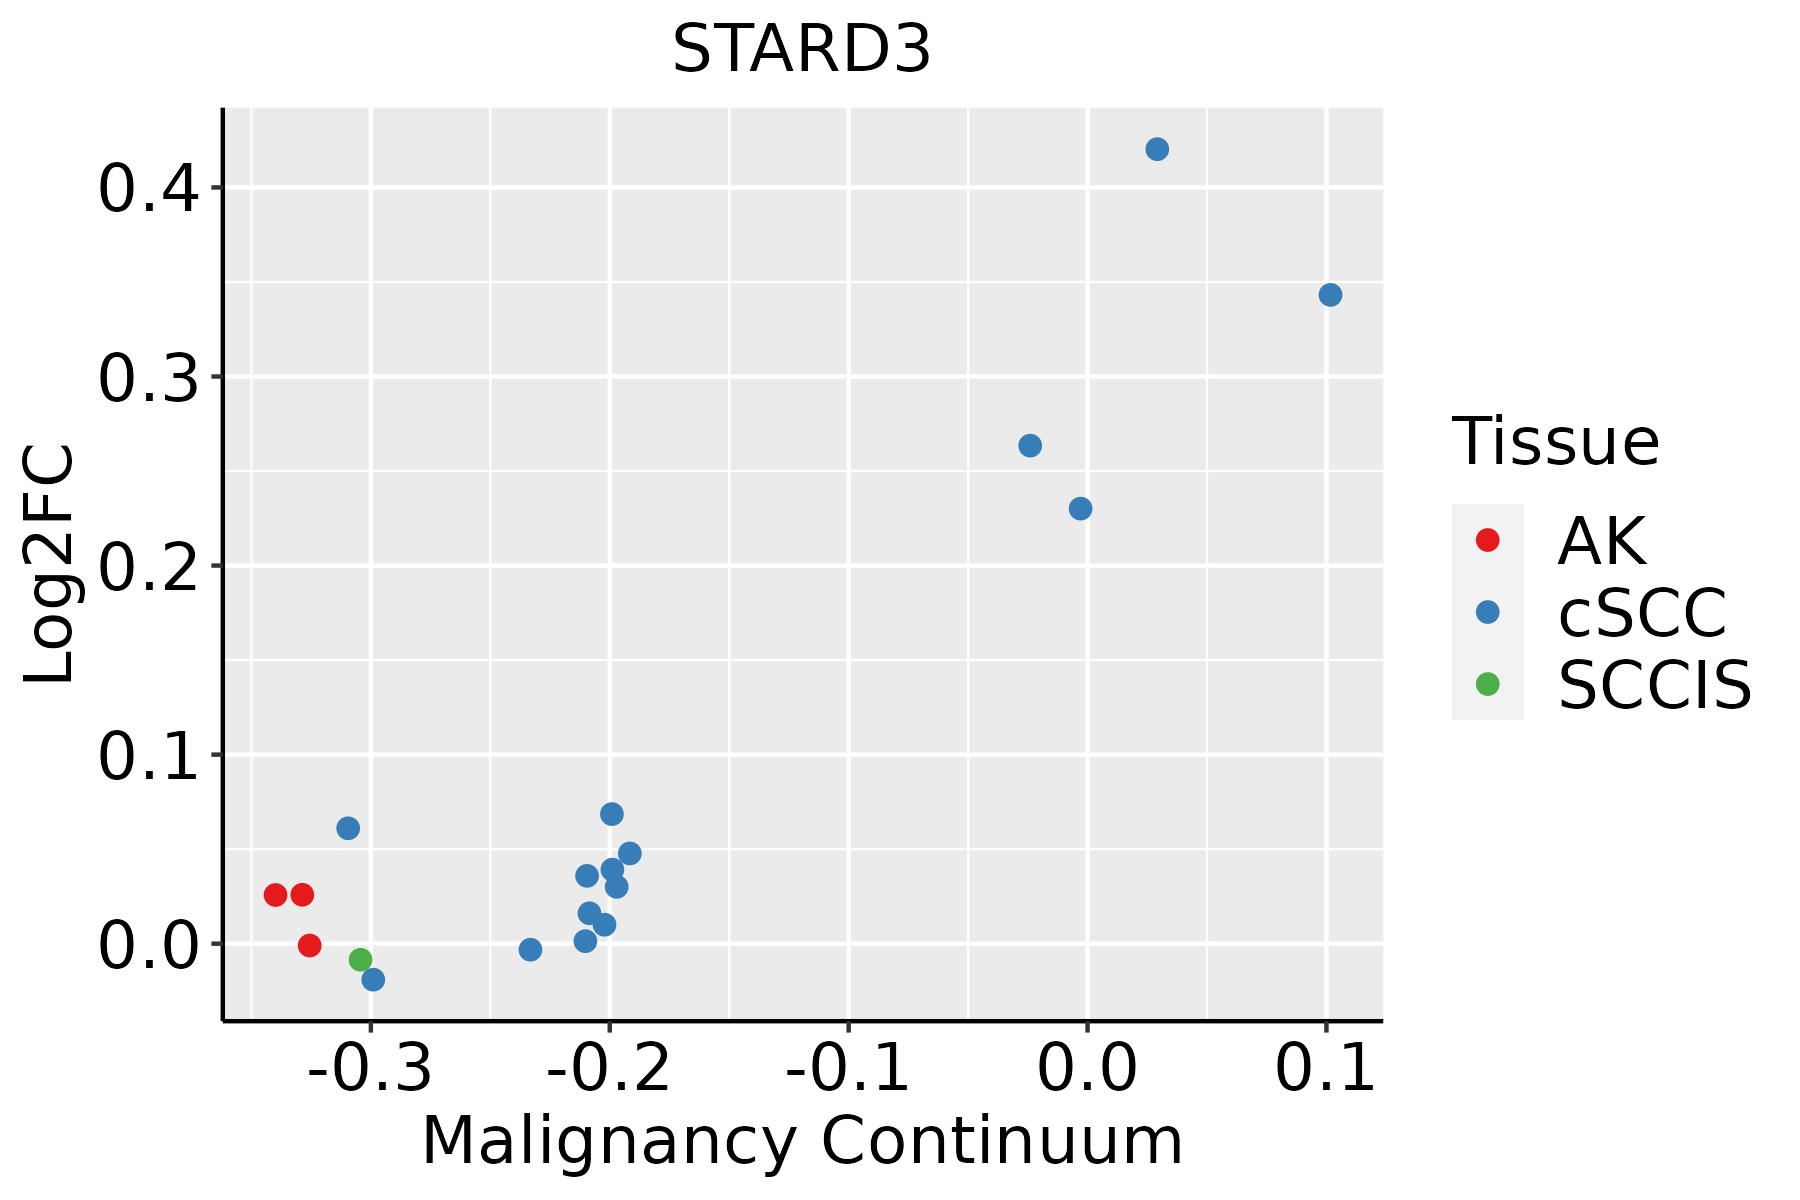 | AK: Actinic keratosis |
| cSCC: Cutaneous squamous cell carcinoma | ||
| SCCIS:squamous cell carcinoma in situ | ||
| Thyroid | 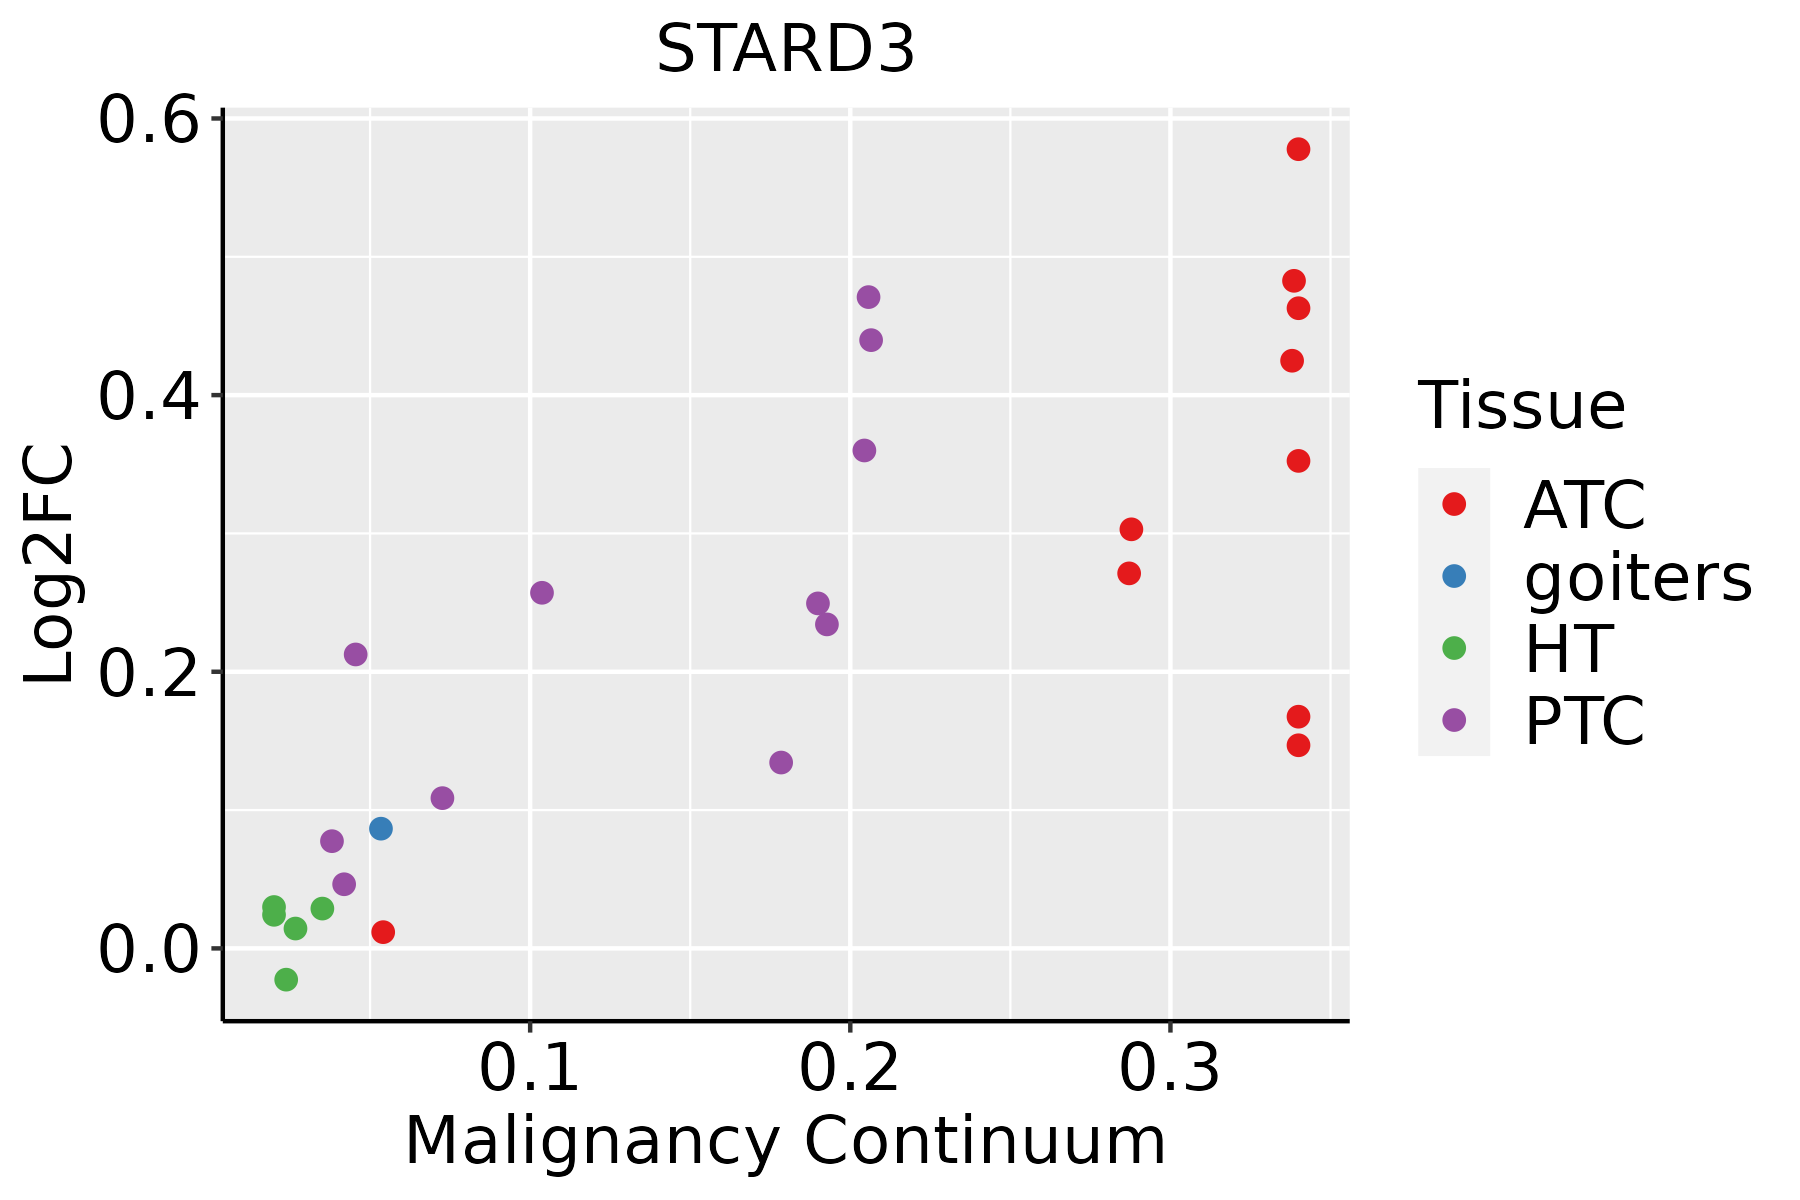 | ATC: Anaplastic thyroid cancer |
| HT: Hashimoto's thyroiditis | ||
| PTC: Papillary thyroid cancer |
| ∗log2FC in expression of this searched gene in stem-like cells from each diseased tissue sample relative to stem-like cells in normal samples in each tissue plotted against the malignancy continuum. Samples are colored based on if they are from different disease stage. |
Top |
Malignant transformation related pathway analysis |
| Find out the enriched GO biological processes and KEGG pathways involved in transition from healthy to precancer to cancer |
| Tissue | Disease Stage | Enriched GO biological Processes |
| Colorectum | AD |  |
| Colorectum | SER |  |
| Colorectum | MSS |  |
| Colorectum | MSI-H |  |
| Colorectum | FAP |  |
| ∗Top 15 enriched GO BP terms are showed in the bar plot of each disease state in each tissue. Each row represents a significant GO biological process which is colored according to the -log10(p.adjust). |
| Page: 1 2 3 4 5 6 7 8 9 |
| GO ID | Tissue | Disease Stage | Description | Gene Ratio | Bg Ratio | pvalue | p.adjust | Count |
| GO:000683913 | Breast | IDC | mitochondrial transport | 51/1434 | 254/18723 | 1.54e-10 | 1.83e-08 | 51 |
| GO:00066944 | Breast | IDC | steroid biosynthetic process | 25/1434 | 173/18723 | 1.56e-03 | 1.56e-02 | 25 |
| GO:000683923 | Breast | DCIS | mitochondrial transport | 51/1390 | 254/18723 | 5.04e-11 | 6.79e-09 | 51 |
| GO:000669411 | Breast | DCIS | steroid biosynthetic process | 23/1390 | 173/18723 | 4.63e-03 | 3.52e-02 | 23 |
| GO:005165616 | Esophagus | HGIN | establishment of organelle localization | 90/2587 | 390/18723 | 4.27e-07 | 1.94e-05 | 90 |
| GO:005165010 | Esophagus | HGIN | establishment of vesicle localization | 35/2587 | 161/18723 | 3.89e-03 | 3.54e-02 | 35 |
| GO:005164810 | Esophagus | HGIN | vesicle localization | 37/2587 | 177/18723 | 6.03e-03 | 4.87e-02 | 37 |
| GO:005165617 | Esophagus | ESCC | establishment of organelle localization | 273/8552 | 390/18723 | 9.13e-23 | 1.81e-20 | 273 |
| GO:0006839110 | Esophagus | ESCC | mitochondrial transport | 187/8552 | 254/18723 | 8.35e-20 | 9.81e-18 | 187 |
| GO:005165016 | Esophagus | ESCC | establishment of vesicle localization | 114/8552 | 161/18723 | 8.20e-11 | 2.53e-09 | 114 |
| GO:005164815 | Esophagus | ESCC | vesicle localization | 119/8552 | 177/18723 | 5.16e-09 | 1.08e-07 | 119 |
| GO:00069038 | Esophagus | ESCC | vesicle targeting | 38/8552 | 45/18723 | 8.42e-08 | 1.43e-06 | 38 |
| GO:00060668 | Esophagus | ESCC | alcohol metabolic process | 202/8552 | 353/18723 | 7.32e-06 | 7.26e-05 | 202 |
| GO:19026524 | Esophagus | ESCC | secondary alcohol metabolic process | 87/8552 | 147/18723 | 6.58e-04 | 3.50e-03 | 87 |
| GO:00421805 | Esophagus | ESCC | cellular ketone metabolic process | 120/8552 | 211/18723 | 6.70e-04 | 3.55e-03 | 120 |
| GO:00066946 | Esophagus | ESCC | steroid biosynthetic process | 98/8552 | 173/18723 | 2.34e-03 | 1.03e-02 | 98 |
| GO:00990222 | Esophagus | ESCC | vesicle tethering | 10/8552 | 11/18723 | 2.54e-03 | 1.08e-02 | 10 |
| GO:00082034 | Esophagus | ESCC | cholesterol metabolic process | 79/8552 | 137/18723 | 3.11e-03 | 1.29e-02 | 79 |
| GO:00161254 | Esophagus | ESCC | sterol metabolic process | 86/8552 | 152/18723 | 4.37e-03 | 1.73e-02 | 86 |
| GO:000683912 | Liver | HCC | mitochondrial transport | 184/7958 | 254/18723 | 2.30e-22 | 3.83e-20 | 184 |
| Page: 1 2 3 4 5 |
| Pathway ID | Tissue | Disease Stage | Description | Gene Ratio | Bg Ratio | pvalue | p.adjust | qvalue | Count |
| hsa049794 | Liver | HCC | Cholesterol metabolism | 41/4020 | 51/8465 | 1.33e-06 | 1.35e-05 | 7.49e-06 | 41 |
| hsa049795 | Liver | HCC | Cholesterol metabolism | 41/4020 | 51/8465 | 1.33e-06 | 1.35e-05 | 7.49e-06 | 41 |
| Page: 1 |
Top |
Cell-cell communication analysis |
| Identification of potential cell-cell interactions between two cell types and their ligand-receptor pairs for different disease states |
| Ligand | Receptor | LRpair | Pathway | Tissue | Disease Stage |
| Page: 1 |
Top |
Single-cell gene regulatory network inference analysis |
| Find out the significant the regulons (TFs) and the target genes of each regulon across cell types for different disease states |
| TF | Cell Type | Tissue | Disease Stage | Target Gene | RSS | Regulon Activity |
| ∗The dot plots of a searched regulon are shown for all cell subpopulations in each disease state of each tissue based on the regulon specific score inferred using pySCENIC and by calculating the average expression. |
| Page: 1 |
Top |
Somatic mutation of malignant transformation related genes |
| Annotation of somatic variants for genes involved in malignant transformation |
| Hugo Symbol | Variant Class | Variant Classification | dbSNP RS | HGVSc | HGVSp | HGVSp Short | SWISSPROT | BIOTYPE | SIFT | PolyPhen | Tumor Sample Barcode | Tissue | Histology | Sex | Age | Stage | Therapy Types | Drugs | Outcome |
| STARD3 | SNV | Missense_Mutation | novel | c.1307N>G | p.Gln436Arg | p.Q436R | Q14849 | protein_coding | deleterious(0.03) | benign(0.007) | TCGA-AC-A62Y-01 | Breast | breast invasive carcinoma | Female | >=65 | I/II | Unknown | Unknown | SD |
| STARD3 | SNV | Missense_Mutation | c.140C>T | p.Ser47Phe | p.S47F | Q14849 | protein_coding | deleterious(0) | probably_damaging(1) | TCGA-EW-A1J5-01 | Breast | breast invasive carcinoma | Female | <65 | I/II | Chemotherapy | adriamycin | SD | |
| STARD3 | insertion | Frame_Shift_Ins | novel | c.1308_1309insGGGCCTCCCCTTTGTCAGCCACCTTT | p.Arg437GlyfsTer67 | p.R437Gfs*67 | Q14849 | protein_coding | TCGA-BH-A0AW-01 | Breast | breast invasive carcinoma | Female | <65 | I/II | Chemotherapy | carboplatin | SD | ||
| STARD3 | insertion | In_Frame_Ins | novel | c.906_907insGTA | p.Leu302_Gln303insVal | p.L302_Q303insV | Q14849 | protein_coding | TCGA-BH-A0EE-01 | Breast | breast invasive carcinoma | Female | >=65 | I/II | Chemotherapy | docetaxel | SD | ||
| STARD3 | insertion | Nonsense_Mutation | novel | c.908_909insCCATTGAAGTTCCCTTTCACGGCAAGACGTTTATCCTGAA | p.Gln303HisfsTer3 | p.Q303Hfs*3 | Q14849 | protein_coding | TCGA-BH-A0EE-01 | Breast | breast invasive carcinoma | Female | >=65 | I/II | Chemotherapy | docetaxel | SD | ||
| STARD3 | deletion | Frame_Shift_Del | novel | c.12delN | p.Arg6GlyfsTer3 | p.R6Gfs*3 | Q14849 | protein_coding | TCGA-D8-A27V-01 | Breast | breast invasive carcinoma | Female | <65 | I/II | Hormone Therapy | tamoxiphen | SD | ||
| STARD3 | deletion | Frame_Shift_Del | novel | c.583delN | p.Leu196CysfsTer90 | p.L196Cfs*90 | Q14849 | protein_coding | TCGA-D8-A27V-01 | Breast | breast invasive carcinoma | Female | <65 | I/II | Hormone Therapy | tamoxiphen | SD | ||
| STARD3 | SNV | Missense_Mutation | rs143167128 | c.1168N>A | p.Val390Met | p.V390M | Q14849 | protein_coding | tolerated(0.31) | probably_damaging(0.933) | TCGA-EA-A410-01 | Cervix | cervical & endocervical cancer | Female | <65 | I/II | Unknown | Unknown | SD |
| STARD3 | SNV | Missense_Mutation | c.658N>A | p.Glu220Lys | p.E220K | Q14849 | protein_coding | deleterious(0.03) | benign(0.092) | TCGA-Q1-A73O-01 | Cervix | cervical & endocervical cancer | Female | <65 | I/II | Chemotherapy | cisplatin | CR | |
| STARD3 | SNV | Missense_Mutation | rs749828666 | c.1271N>T | p.Ala424Val | p.A424V | Q14849 | protein_coding | deleterious(0.01) | benign(0.339) | TCGA-AA-A022-01 | Colorectum | colon adenocarcinoma | Female | >=65 | I/II | Unknown | Unknown | SD |
| Page: 1 2 3 4 |
Top |
Related drugs of malignant transformation related genes |
| Identification of chemicals and drugs interact with genes involved in malignant transfromation |
| (DGIdb 4.0) |
| Entrez ID | Symbol | Category | Interaction Types | Drug Claim Name | Drug Name | PMIDs |
| Page: 1 |

Copyright 2023-Present -The University of Texas Health Science Center at Houston |