
|
|||||
|
 | |
| |
| |
| |
| |
| |
|
Gene: ST7L |
Gene summary for ST7L |
| Gene information | Species | Human | Gene symbol | ST7L | Gene ID | 54879 |
| Gene name | suppression of tumorigenicity 7 like | |
| Gene Alias | FAM4B | |
| Cytomap | 1p13.2 | |
| Gene Type | protein-coding | GO ID | GO:0001558 | UniProtAcc | Q8TDW4 |
Top |
Malignant transformation analysis |
| Identification of the aberrant gene expression in precancerous and cancerous lesions by comparing the gene expression of stem-like cells in diseased tissues with normal stem cells |
| Entrez ID | Symbol | Replicates | Species | Organ | Tissue | Adj P-value | Log2FC | Malignancy |
| 54879 | ST7L | P52T-E | Human | Esophagus | ESCC | 5.27e-15 | 3.23e-01 | 0.1555 |
| 54879 | ST7L | P54T-E | Human | Esophagus | ESCC | 3.73e-14 | 2.54e-01 | 0.0975 |
| 54879 | ST7L | P56T-E | Human | Esophagus | ESCC | 5.37e-13 | 6.85e-01 | 0.1613 |
| 54879 | ST7L | P57T-E | Human | Esophagus | ESCC | 1.29e-18 | 1.81e-01 | 0.0926 |
| 54879 | ST7L | P61T-E | Human | Esophagus | ESCC | 4.55e-16 | 1.87e-01 | 0.099 |
| 54879 | ST7L | P62T-E | Human | Esophagus | ESCC | 8.99e-27 | 4.23e-01 | 0.1302 |
| 54879 | ST7L | P65T-E | Human | Esophagus | ESCC | 8.09e-20 | 2.12e-01 | 0.0978 |
| 54879 | ST7L | P74T-E | Human | Esophagus | ESCC | 8.99e-26 | 4.80e-01 | 0.1479 |
| 54879 | ST7L | P75T-E | Human | Esophagus | ESCC | 9.05e-33 | 5.38e-01 | 0.1125 |
| 54879 | ST7L | P76T-E | Human | Esophagus | ESCC | 3.31e-29 | 2.74e-01 | 0.1207 |
| 54879 | ST7L | P79T-E | Human | Esophagus | ESCC | 3.23e-24 | 2.39e-01 | 0.1154 |
| 54879 | ST7L | P80T-E | Human | Esophagus | ESCC | 4.29e-23 | 5.58e-01 | 0.155 |
| 54879 | ST7L | P83T-E | Human | Esophagus | ESCC | 1.22e-15 | 3.91e-01 | 0.1738 |
| 54879 | ST7L | P84T-E | Human | Esophagus | ESCC | 5.59e-03 | 2.16e-01 | 0.0933 |
| 54879 | ST7L | P89T-E | Human | Esophagus | ESCC | 1.74e-14 | 5.33e-01 | 0.1752 |
| 54879 | ST7L | P91T-E | Human | Esophagus | ESCC | 3.43e-07 | 7.56e-01 | 0.1828 |
| 54879 | ST7L | P94T-E | Human | Esophagus | ESCC | 1.62e-02 | 2.96e-01 | 0.0879 |
| 54879 | ST7L | P104T-E | Human | Esophagus | ESCC | 1.40e-06 | 1.55e-01 | 0.0931 |
| 54879 | ST7L | P107T-E | Human | Esophagus | ESCC | 4.19e-19 | 3.07e-01 | 0.171 |
| 54879 | ST7L | P126T-E | Human | Esophagus | ESCC | 3.02e-03 | 1.60e-01 | 0.1125 |
| Page: 1 2 3 4 |
| Tissue | Expression Dynamics | Abbreviation |
| Esophagus | 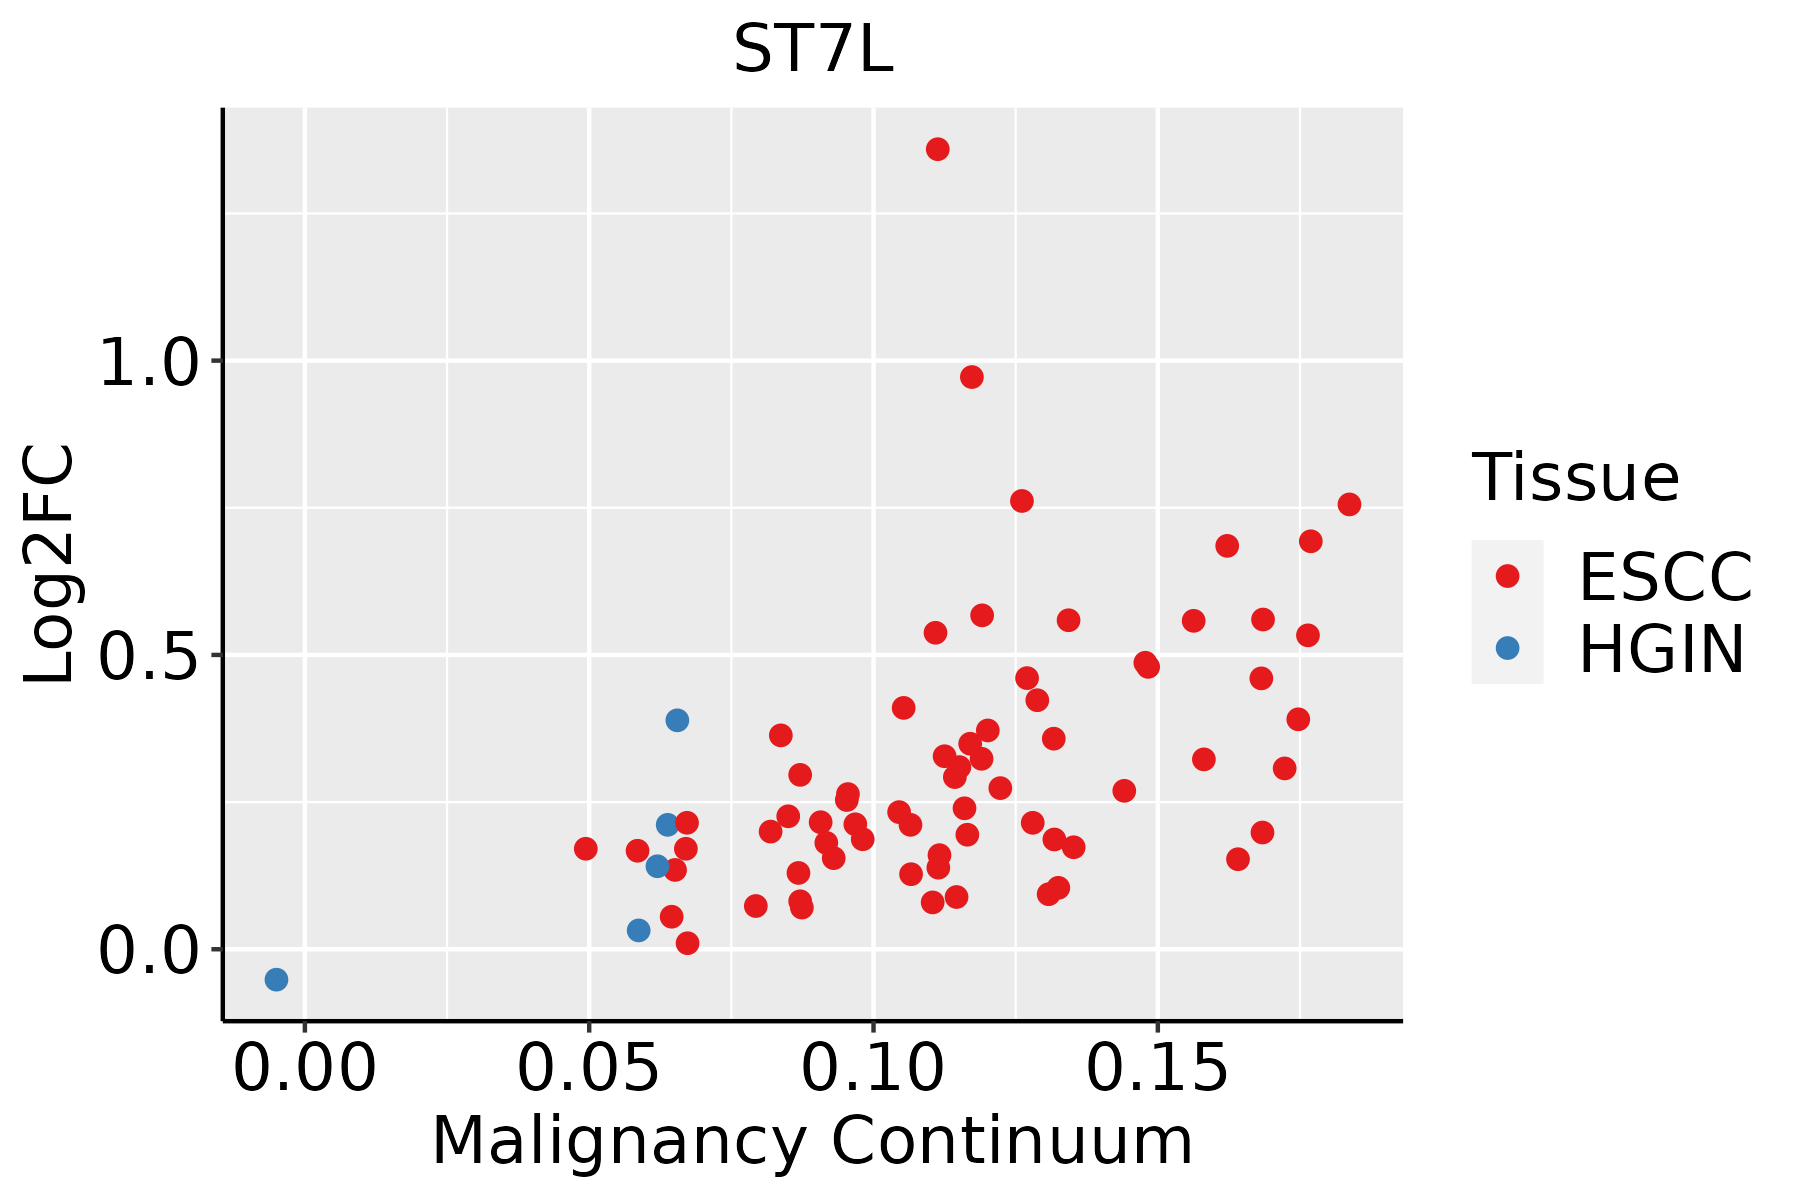 | ESCC: Esophageal squamous cell carcinoma |
| HGIN: High-grade intraepithelial neoplasias | ||
| LGIN: Low-grade intraepithelial neoplasias |
| ∗log2FC in expression of this searched gene in stem-like cells from each diseased tissue sample relative to stem-like cells in normal samples in each tissue plotted against the malignancy continuum. Samples are colored based on if they are from different disease stage. |
Top |
Malignant transformation related pathway analysis |
| Find out the enriched GO biological processes and KEGG pathways involved in transition from healthy to precancer to cancer |
| Tissue | Disease Stage | Enriched GO biological Processes |
| Colorectum | AD |  |
| Colorectum | SER |  |
| Colorectum | MSS |  |
| Colorectum | MSI-H |  |
| Colorectum | FAP |  |
| ∗Top 15 enriched GO BP terms are showed in the bar plot of each disease state in each tissue. Each row represents a significant GO biological process which is colored according to the -log10(p.adjust). |
| Page: 1 2 3 4 5 6 7 8 9 |
| GO ID | Tissue | Disease Stage | Description | Gene Ratio | Bg Ratio | pvalue | p.adjust | Count |
| GO:0016049110 | Esophagus | ESCC | cell growth | 289/8552 | 482/18723 | 1.29e-10 | 3.77e-09 | 289 |
| GO:000155819 | Esophagus | ESCC | regulation of cell growth | 248/8552 | 414/18723 | 2.97e-09 | 6.45e-08 | 248 |
| GO:00459267 | Esophagus | ESCC | negative regulation of growth | 148/8552 | 249/18723 | 7.88e-06 | 7.73e-05 | 148 |
| GO:00303085 | Esophagus | ESCC | negative regulation of cell growth | 108/8552 | 188/18723 | 7.46e-04 | 3.87e-03 | 108 |
| Page: 1 |
| Pathway ID | Tissue | Disease Stage | Description | Gene Ratio | Bg Ratio | pvalue | p.adjust | qvalue | Count |
| Page: 1 |
Top |
Cell-cell communication analysis |
| Identification of potential cell-cell interactions between two cell types and their ligand-receptor pairs for different disease states |
| Ligand | Receptor | LRpair | Pathway | Tissue | Disease Stage |
| Page: 1 |
Top |
Single-cell gene regulatory network inference analysis |
| Find out the significant the regulons (TFs) and the target genes of each regulon across cell types for different disease states |
| TF | Cell Type | Tissue | Disease Stage | Target Gene | RSS | Regulon Activity |
| ∗The dot plots of a searched regulon are shown for all cell subpopulations in each disease state of each tissue based on the regulon specific score inferred using pySCENIC and by calculating the average expression. |
| Page: 1 |
Top |
Somatic mutation of malignant transformation related genes |
| Annotation of somatic variants for genes involved in malignant transformation |
| Hugo Symbol | Variant Class | Variant Classification | dbSNP RS | HGVSc | HGVSp | HGVSp Short | SWISSPROT | BIOTYPE | SIFT | PolyPhen | Tumor Sample Barcode | Tissue | Histology | Sex | Age | Stage | Therapy Types | Drugs | Outcome |
| ST7L | SNV | Missense_Mutation | novel | c.128C>T | p.Ser43Leu | p.S43L | Q8TDW4 | protein_coding | tolerated_low_confidence(0.23) | benign(0.003) | TCGA-AC-A23H-01 | Breast | breast invasive carcinoma | Female | >=65 | I/II | Unknown | Unknown | PD |
| ST7L | SNV | Missense_Mutation | novel | c.1188A>C | p.Glu396Asp | p.E396D | Q8TDW4 | protein_coding | deleterious(0.03) | probably_damaging(0.971) | TCGA-AN-A046-01 | Breast | breast invasive carcinoma | Female | >=65 | I/II | Unknown | Unknown | SD |
| ST7L | SNV | Missense_Mutation | novel | c.1565N>G | p.Ser522Cys | p.S522C | Q8TDW4 | protein_coding | tolerated(0.06) | possibly_damaging(0.886) | TCGA-BH-A2L8-01 | Breast | breast invasive carcinoma | Female | <65 | I/II | Chemotherapy | cytoxan | CR |
| ST7L | SNV | Missense_Mutation | novel | c.1136N>T | p.Ser379Leu | p.S379L | Q8TDW4 | protein_coding | deleterious(0.03) | possibly_damaging(0.733) | TCGA-EW-A1PC-01 | Breast | breast invasive carcinoma | Female | >=65 | I/II | Hormone Therapy | tamoxiphen | SD |
| ST7L | insertion | Frame_Shift_Ins | novel | c.877_878insAGGAAATTCTTTCATCAAC | p.Val293GlufsTer10 | p.V293Efs*10 | Q8TDW4 | protein_coding | TCGA-AR-A0U0-01 | Breast | breast invasive carcinoma | Female | >=65 | I/II | Unknown | Unknown | SD | ||
| ST7L | SNV | Missense_Mutation | novel | c.241T>A | p.Tyr81Asn | p.Y81N | Q8TDW4 | protein_coding | deleterious(0) | probably_damaging(0.998) | TCGA-FU-A2QG-01 | Cervix | cervical & endocervical cancer | Female | <65 | I/II | Unknown | Unknown | SD |
| ST7L | SNV | Missense_Mutation | rs768763547 | c.1347G>C | p.Trp449Cys | p.W449C | Q8TDW4 | protein_coding | deleterious(0) | probably_damaging(1) | TCGA-GH-A9DA-01 | Cervix | cervical & endocervical cancer | Female | <65 | I/II | Unknown | Unknown | SD |
| ST7L | SNV | Missense_Mutation | novel | c.1678G>A | p.Glu560Lys | p.E560K | Q8TDW4 | protein_coding | deleterious_low_confidence(0.04) | benign(0) | TCGA-VS-A958-01 | Cervix | cervical & endocervical cancer | Female | <65 | I/II | Chemotherapy | cisplatin | CR |
| ST7L | SNV | Missense_Mutation | novel | c.547N>A | p.Asp183Asn | p.D183N | Q8TDW4 | protein_coding | deleterious(0) | possibly_damaging(0.651) | TCGA-VS-A9UJ-01 | Cervix | cervical & endocervical cancer | Female | <65 | I/II | Unknown | Unknown | PD |
| ST7L | SNV | Missense_Mutation | c.787G>A | p.Ala263Thr | p.A263T | Q8TDW4 | protein_coding | deleterious(0.02) | benign(0.196) | TCGA-A6-5661-01 | Colorectum | colon adenocarcinoma | Female | >=65 | I/II | Unknown | Unknown | SD |
| Page: 1 2 3 4 5 6 |
Top |
Related drugs of malignant transformation related genes |
| Identification of chemicals and drugs interact with genes involved in malignant transfromation |
| (DGIdb 4.0) |
| Entrez ID | Symbol | Category | Interaction Types | Drug Claim Name | Drug Name | PMIDs |
| Page: 1 |

Copyright 2023-Present -The University of Texas Health Science Center at Houston |