
|
|||||
|
 | |
| |
| |
| |
| |
| |
|
Gene: SRGAP3 |
Gene summary for SRGAP3 |
| Gene information | Species | Human | Gene symbol | SRGAP3 | Gene ID | 9901 |
| Gene name | SLIT-ROBO Rho GTPase activating protein 3 | |
| Gene Alias | ARHGAP14 | |
| Cytomap | 3p25.3 | |
| Gene Type | protein-coding | GO ID | GO:0006928 | UniProtAcc | O43295 |
Top |
Malignant transformation analysis |
| Identification of the aberrant gene expression in precancerous and cancerous lesions by comparing the gene expression of stem-like cells in diseased tissues with normal stem cells |
| Entrez ID | Symbol | Replicates | Species | Organ | Tissue | Adj P-value | Log2FC | Malignancy |
| 9901 | SRGAP3 | P22T-E | Human | Esophagus | ESCC | 1.16e-09 | 1.44e-01 | 0.1236 |
| 9901 | SRGAP3 | P23T-E | Human | Esophagus | ESCC | 9.51e-18 | 5.64e-01 | 0.108 |
| 9901 | SRGAP3 | P26T-E | Human | Esophagus | ESCC | 1.67e-28 | 5.20e-01 | 0.1276 |
| 9901 | SRGAP3 | P27T-E | Human | Esophagus | ESCC | 4.10e-35 | 5.42e-01 | 0.1055 |
| 9901 | SRGAP3 | P28T-E | Human | Esophagus | ESCC | 4.00e-13 | 2.81e-01 | 0.1149 |
| 9901 | SRGAP3 | P30T-E | Human | Esophagus | ESCC | 7.45e-27 | 8.24e-01 | 0.137 |
| 9901 | SRGAP3 | P31T-E | Human | Esophagus | ESCC | 4.33e-05 | 1.72e-01 | 0.1251 |
| 9901 | SRGAP3 | P32T-E | Human | Esophagus | ESCC | 4.89e-03 | 7.80e-02 | 0.1666 |
| 9901 | SRGAP3 | P36T-E | Human | Esophagus | ESCC | 3.41e-06 | 2.54e-01 | 0.1187 |
| 9901 | SRGAP3 | P37T-E | Human | Esophagus | ESCC | 2.09e-07 | 1.15e-01 | 0.1371 |
| 9901 | SRGAP3 | P39T-E | Human | Esophagus | ESCC | 3.46e-06 | 1.12e-01 | 0.0894 |
| 9901 | SRGAP3 | P40T-E | Human | Esophagus | ESCC | 1.54e-04 | 2.41e-01 | 0.109 |
| 9901 | SRGAP3 | P42T-E | Human | Esophagus | ESCC | 1.31e-10 | 2.21e-01 | 0.1175 |
| 9901 | SRGAP3 | P44T-E | Human | Esophagus | ESCC | 5.31e-12 | 2.27e-01 | 0.1096 |
| 9901 | SRGAP3 | P47T-E | Human | Esophagus | ESCC | 1.07e-04 | 4.63e-02 | 0.1067 |
| 9901 | SRGAP3 | P48T-E | Human | Esophagus | ESCC | 1.65e-13 | 2.71e-01 | 0.0959 |
| 9901 | SRGAP3 | P52T-E | Human | Esophagus | ESCC | 1.60e-09 | 2.20e-01 | 0.1555 |
| 9901 | SRGAP3 | P54T-E | Human | Esophagus | ESCC | 2.47e-10 | 1.88e-01 | 0.0975 |
| 9901 | SRGAP3 | P56T-E | Human | Esophagus | ESCC | 1.14e-05 | 4.25e-01 | 0.1613 |
| 9901 | SRGAP3 | P57T-E | Human | Esophagus | ESCC | 1.83e-10 | 1.96e-01 | 0.0926 |
| Page: 1 2 3 4 5 |
| Tissue | Expression Dynamics | Abbreviation |
| Cervix | 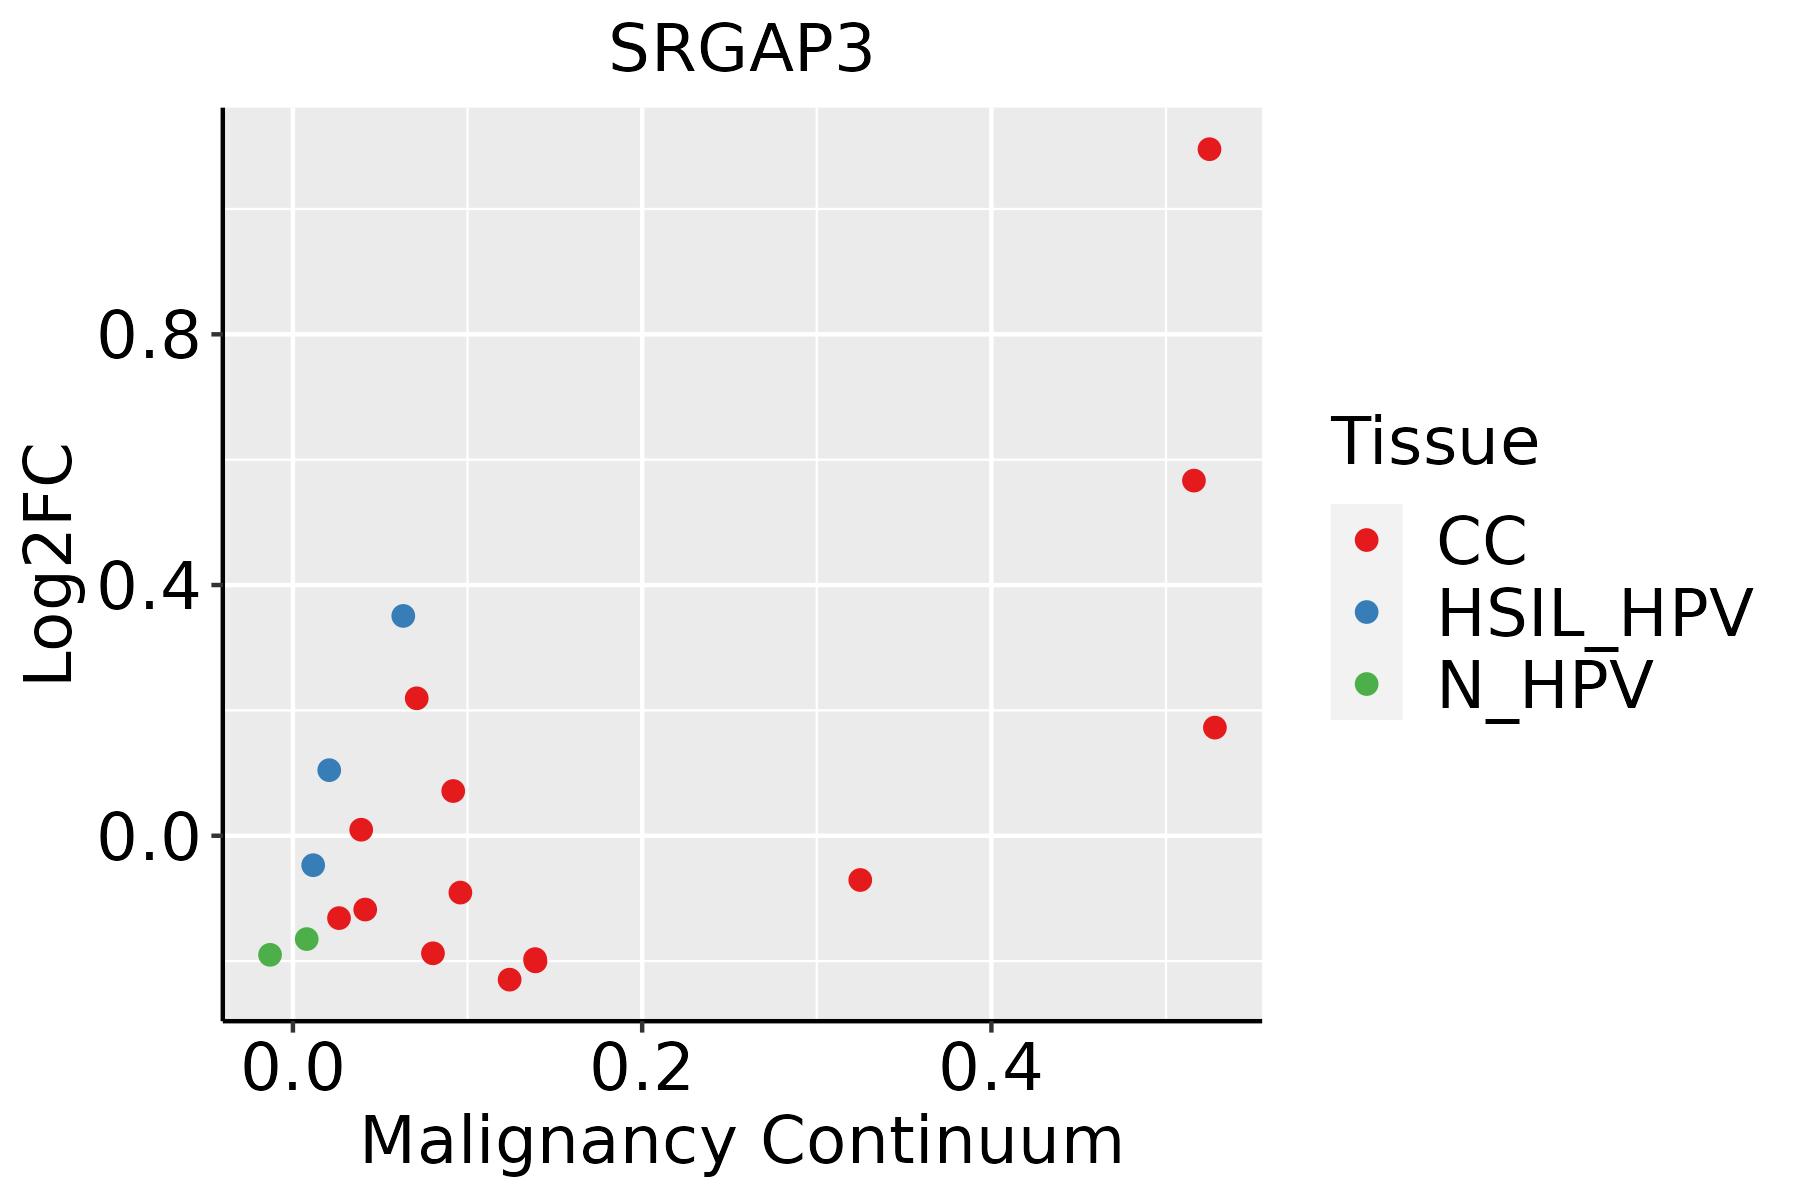 | CC: Cervix cancer |
| HSIL_HPV: HPV-infected high-grade squamous intraepithelial lesions | ||
| N_HPV: HPV-infected normal cervix | ||
| Endometrium | 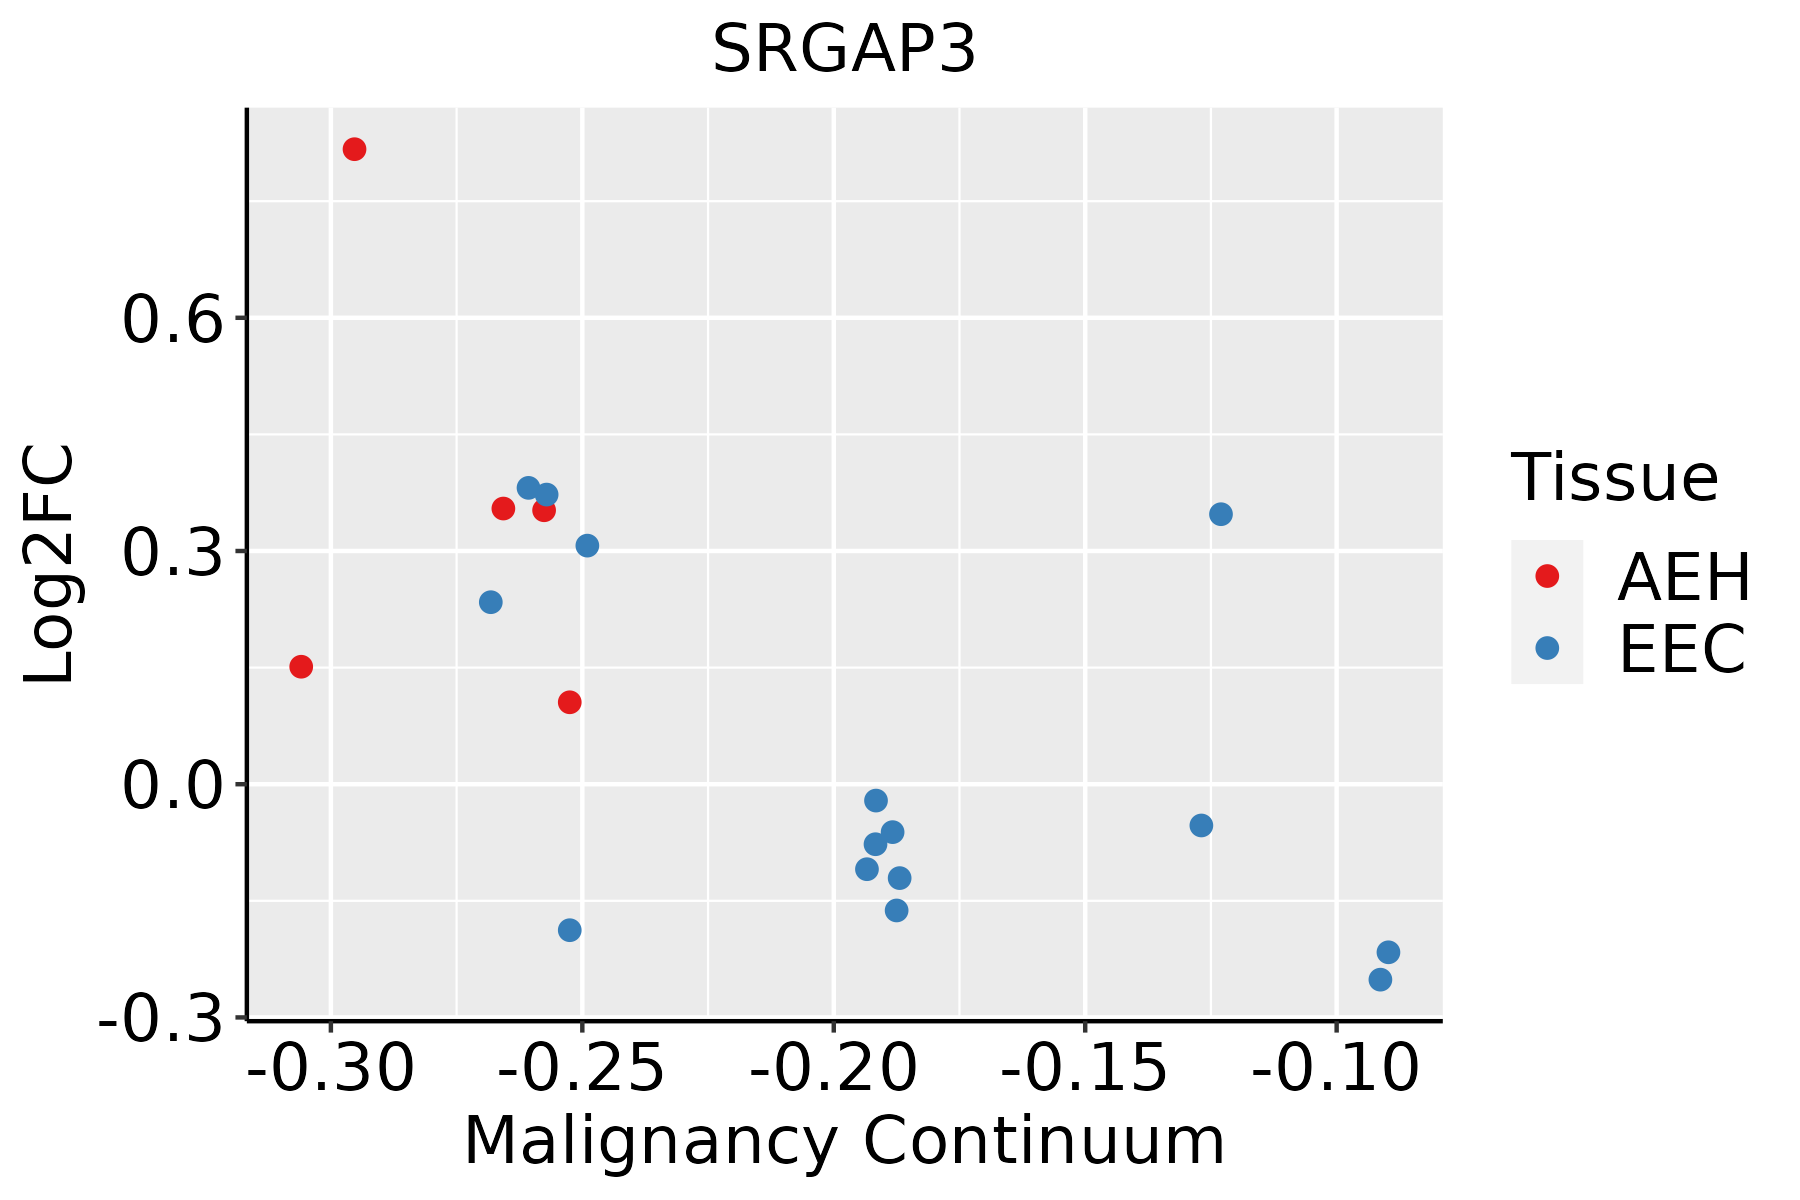 | AEH: Atypical endometrial hyperplasia |
| EEC: Endometrioid Cancer | ||
| Esophagus | 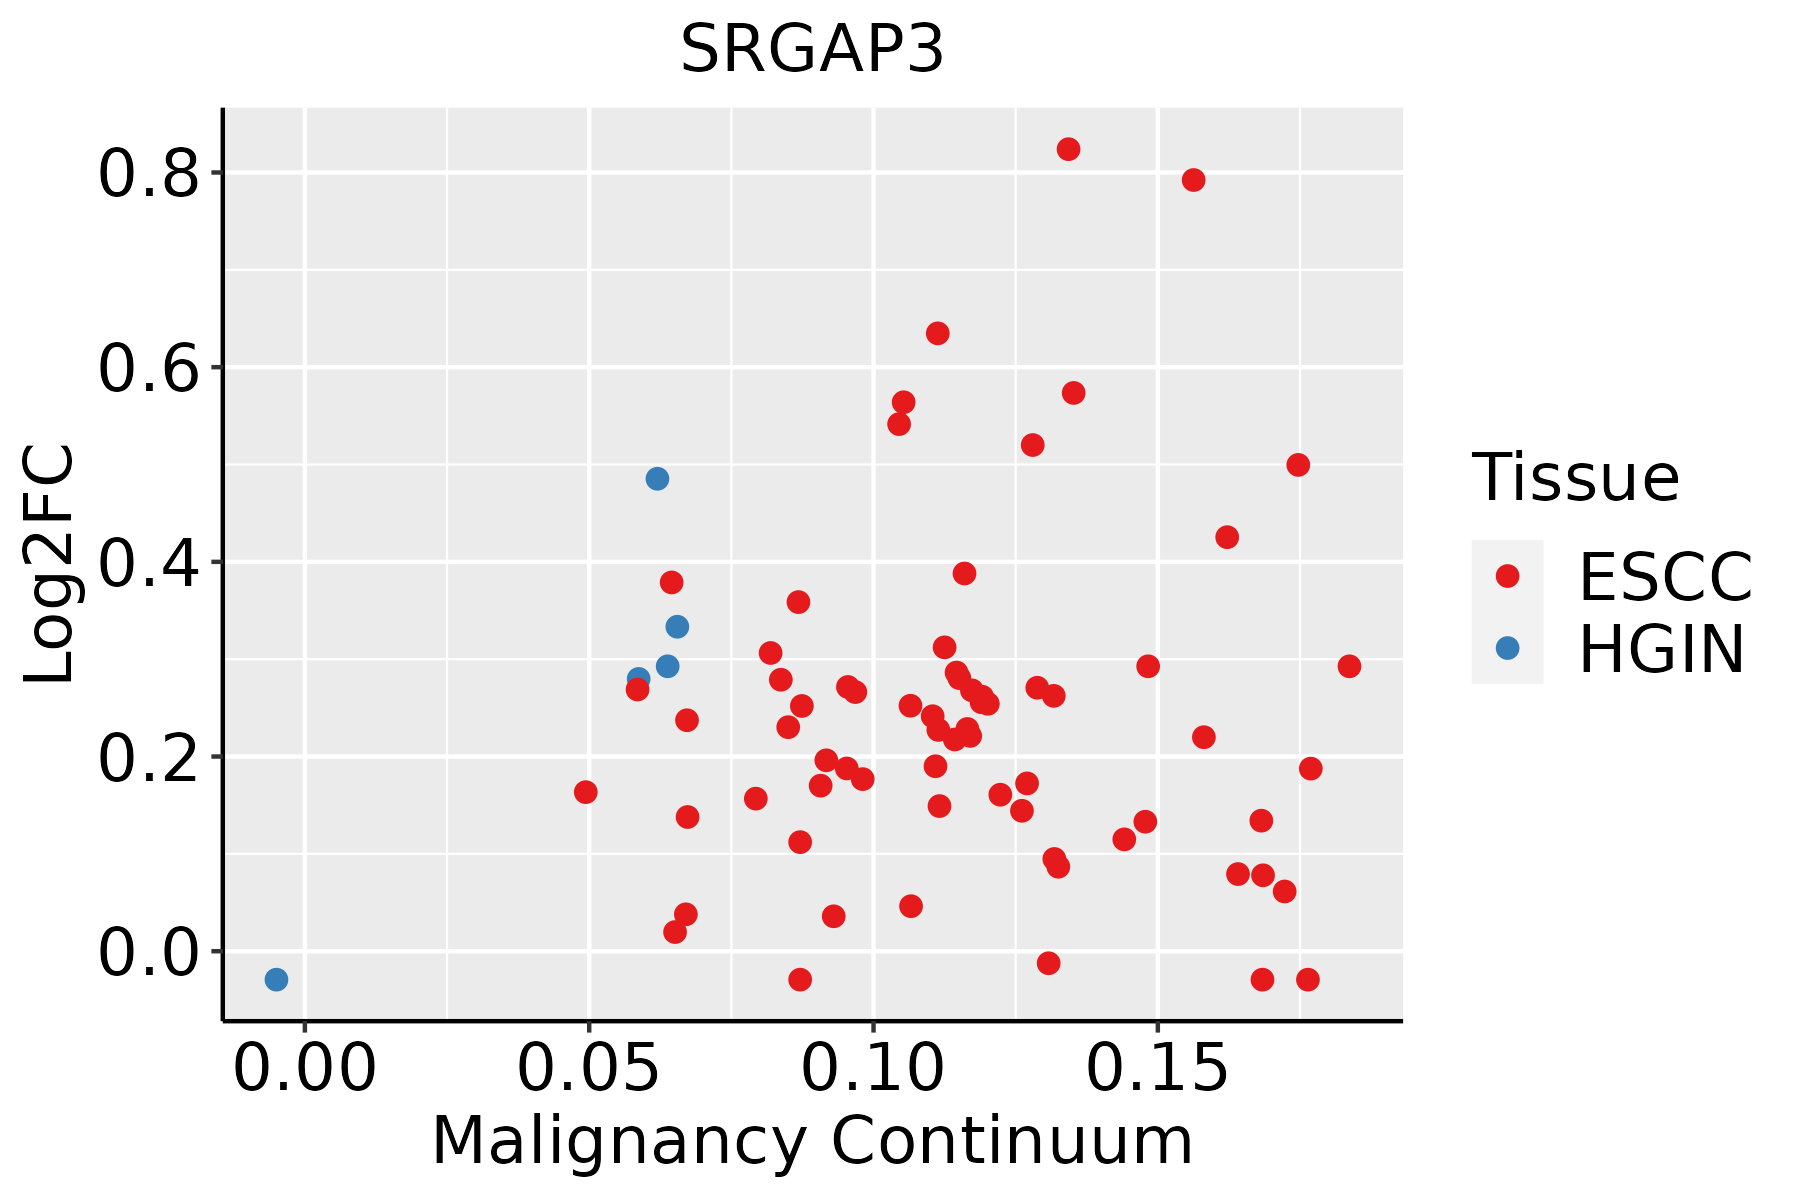 | ESCC: Esophageal squamous cell carcinoma |
| HGIN: High-grade intraepithelial neoplasias | ||
| LGIN: Low-grade intraepithelial neoplasias | ||
| Thyroid |  | ATC: Anaplastic thyroid cancer |
| HT: Hashimoto's thyroiditis | ||
| PTC: Papillary thyroid cancer |
| ∗log2FC in expression of this searched gene in stem-like cells from each diseased tissue sample relative to stem-like cells in normal samples in each tissue plotted against the malignancy continuum. Samples are colored based on if they are from different disease stage. |
Top |
Malignant transformation related pathway analysis |
| Find out the enriched GO biological processes and KEGG pathways involved in transition from healthy to precancer to cancer |
| Tissue | Disease Stage | Enriched GO biological Processes |
| Colorectum | AD |  |
| Colorectum | SER |  |
| Colorectum | MSS |  |
| Colorectum | MSI-H |  |
| Colorectum | FAP |  |
| ∗Top 15 enriched GO BP terms are showed in the bar plot of each disease state in each tissue. Each row represents a significant GO biological process which is colored according to the -log10(p.adjust). |
| Page: 1 2 3 4 5 6 7 8 9 |
| GO ID | Tissue | Disease Stage | Description | Gene Ratio | Bg Ratio | pvalue | p.adjust | Count |
| GO:00510566 | Cervix | CC | regulation of small GTPase mediated signal transduction | 75/2311 | 302/18723 | 1.54e-09 | 1.74e-07 | 75 |
| GO:00512713 | Cervix | CC | negative regulation of cellular component movement | 73/2311 | 367/18723 | 2.22e-05 | 3.95e-04 | 73 |
| GO:00400133 | Cervix | CC | negative regulation of locomotion | 76/2311 | 391/18723 | 3.47e-05 | 5.60e-04 | 76 |
| GO:20001463 | Cervix | CC | negative regulation of cell motility | 71/2311 | 359/18723 | 3.47e-05 | 5.60e-04 | 71 |
| GO:00303363 | Cervix | CC | negative regulation of cell migration | 68/2311 | 344/18723 | 5.11e-05 | 7.70e-04 | 68 |
| GO:00510567 | Endometrium | AEH | regulation of small GTPase mediated signal transduction | 59/2100 | 302/18723 | 1.43e-05 | 3.03e-04 | 59 |
| GO:00303364 | Endometrium | AEH | negative regulation of cell migration | 65/2100 | 344/18723 | 1.65e-05 | 3.42e-04 | 65 |
| GO:20001464 | Endometrium | AEH | negative regulation of cell motility | 67/2100 | 359/18723 | 1.86e-05 | 3.77e-04 | 67 |
| GO:00512714 | Endometrium | AEH | negative regulation of cellular component movement | 68/2100 | 367/18723 | 2.06e-05 | 4.11e-04 | 68 |
| GO:00400134 | Endometrium | AEH | negative regulation of locomotion | 70/2100 | 391/18723 | 4.95e-05 | 8.05e-04 | 70 |
| GO:200014613 | Endometrium | EEC | negative regulation of cell motility | 71/2168 | 359/18723 | 3.98e-06 | 1.04e-04 | 71 |
| GO:005127113 | Endometrium | EEC | negative regulation of cellular component movement | 72/2168 | 367/18723 | 4.59e-06 | 1.15e-04 | 72 |
| GO:005105612 | Endometrium | EEC | regulation of small GTPase mediated signal transduction | 61/2168 | 302/18723 | 9.42e-06 | 2.08e-04 | 61 |
| GO:003033612 | Endometrium | EEC | negative regulation of cell migration | 67/2168 | 344/18723 | 1.24e-05 | 2.54e-04 | 67 |
| GO:004001312 | Endometrium | EEC | negative regulation of locomotion | 74/2168 | 391/18723 | 1.28e-05 | 2.59e-04 | 74 |
| GO:005105610 | Esophagus | ESCC | regulation of small GTPase mediated signal transduction | 157/8552 | 302/18723 | 1.55e-02 | 4.98e-02 | 157 |
| GO:005105617 | Thyroid | PTC | regulation of small GTPase mediated signal transduction | 132/5968 | 302/18723 | 9.26e-06 | 1.04e-04 | 132 |
| GO:005105618 | Thyroid | ATC | regulation of small GTPase mediated signal transduction | 141/6293 | 302/18723 | 1.43e-06 | 1.77e-05 | 141 |
| GO:004001316 | Thyroid | ATC | negative regulation of locomotion | 160/6293 | 391/18723 | 1.36e-03 | 7.07e-03 | 160 |
| GO:003033616 | Thyroid | ATC | negative regulation of cell migration | 142/6293 | 344/18723 | 1.64e-03 | 8.22e-03 | 142 |
| Page: 1 2 |
| Pathway ID | Tissue | Disease Stage | Description | Gene Ratio | Bg Ratio | pvalue | p.adjust | qvalue | Count |
| hsa043609 | Cervix | CC | Axon guidance | 47/1267 | 182/8465 | 8.13e-05 | 5.38e-04 | 3.18e-04 | 47 |
| hsa0436012 | Cervix | CC | Axon guidance | 47/1267 | 182/8465 | 8.13e-05 | 5.38e-04 | 3.18e-04 | 47 |
| hsa0436010 | Endometrium | AEH | Axon guidance | 39/1197 | 182/8465 | 4.47e-03 | 2.46e-02 | 1.80e-02 | 39 |
| hsa0436013 | Endometrium | AEH | Axon guidance | 39/1197 | 182/8465 | 4.47e-03 | 2.46e-02 | 1.80e-02 | 39 |
| hsa0436022 | Endometrium | EEC | Axon guidance | 39/1237 | 182/8465 | 7.78e-03 | 3.66e-02 | 2.73e-02 | 39 |
| hsa0436032 | Endometrium | EEC | Axon guidance | 39/1237 | 182/8465 | 7.78e-03 | 3.66e-02 | 2.73e-02 | 39 |
| hsa0436016 | Esophagus | ESCC | Axon guidance | 108/4205 | 182/8465 | 5.13e-03 | 1.30e-02 | 6.67e-03 | 108 |
| hsa0436017 | Esophagus | ESCC | Axon guidance | 108/4205 | 182/8465 | 5.13e-03 | 1.30e-02 | 6.67e-03 | 108 |
| Page: 1 |
Top |
Cell-cell communication analysis |
| Identification of potential cell-cell interactions between two cell types and their ligand-receptor pairs for different disease states |
| Ligand | Receptor | LRpair | Pathway | Tissue | Disease Stage |
| Page: 1 |
Top |
Single-cell gene regulatory network inference analysis |
| Find out the significant the regulons (TFs) and the target genes of each regulon across cell types for different disease states |
| TF | Cell Type | Tissue | Disease Stage | Target Gene | RSS | Regulon Activity |
| ∗The dot plots of a searched regulon are shown for all cell subpopulations in each disease state of each tissue based on the regulon specific score inferred using pySCENIC and by calculating the average expression. |
| Page: 1 |
Top |
Somatic mutation of malignant transformation related genes |
| Annotation of somatic variants for genes involved in malignant transformation |
| Hugo Symbol | Variant Class | Variant Classification | dbSNP RS | HGVSc | HGVSp | HGVSp Short | SWISSPROT | BIOTYPE | SIFT | PolyPhen | Tumor Sample Barcode | Tissue | Histology | Sex | Age | Stage | Therapy Types | Drugs | Outcome |
| SRGAP3 | SNV | Missense_Mutation | novel | c.2990N>T | p.Pro997Leu | p.P997L | O43295 | protein_coding | tolerated(0.14) | benign(0) | TCGA-B6-A0RE-01 | Breast | breast invasive carcinoma | Female | <65 | I/II | Unknown | Unknown | SD |
| SRGAP3 | SNV | Missense_Mutation | rs771570436 | c.2209N>T | p.Pro737Ser | p.P737S | O43295 | protein_coding | tolerated(0.27) | benign(0.011) | TCGA-D8-A27V-01 | Breast | breast invasive carcinoma | Female | <65 | I/II | Hormone Therapy | tamoxiphen | SD |
| SRGAP3 | SNV | Missense_Mutation | c.3257A>G | p.Lys1086Arg | p.K1086R | O43295 | protein_coding | tolerated_low_confidence(0.18) | benign(0.003) | TCGA-E2-A15G-01 | Breast | breast invasive carcinoma | Female | >=65 | I/II | Hormone Therapy | arimidex | SD | |
| SRGAP3 | SNV | Missense_Mutation | c.2935N>C | p.Glu979Gln | p.E979Q | O43295 | protein_coding | deleterious(0.05) | probably_damaging(0.989) | TCGA-E2-A1LG-01 | Breast | breast invasive carcinoma | Female | <65 | I/II | Chemotherapy | doxorubicin | SD | |
| SRGAP3 | SNV | Missense_Mutation | c.2476G>A | p.Asp826Asn | p.D826N | O43295 | protein_coding | deleterious(0.04) | benign(0.135) | TCGA-GM-A2D9-01 | Breast | breast invasive carcinoma | Female | >=65 | I/II | Hormone Therapy | arimidex | SD | |
| SRGAP3 | SNV | Missense_Mutation | c.454G>A | p.Glu152Lys | p.E152K | O43295 | protein_coding | deleterious(0) | possibly_damaging(0.899) | TCGA-LD-A74U-01 | Breast | breast invasive carcinoma | Female | >=65 | III/IV | Chemotherapy | taxotere | SD | |
| SRGAP3 | insertion | Nonsense_Mutation | novel | c.2087_2088insGAAGCAGGGGAGTGACTAGT | p.Ser696ArgfsTer7 | p.S696Rfs*7 | O43295 | protein_coding | TCGA-AO-A0JB-01 | Breast | breast invasive carcinoma | Female | <65 | III/IV | Chemotherapy | cyclophosphamide | SD | ||
| SRGAP3 | insertion | Frame_Shift_Ins | novel | c.290_291insTAAGAGCCTGCTGAATGGGGAAAGGAGGTTGGGAGTTCAGGGT | p.Cys98LysfsTer35 | p.C98Kfs*35 | O43295 | protein_coding | TCGA-BH-A0HF-01 | Breast | breast invasive carcinoma | Female | >=65 | I/II | Hormone Therapy | arimidex | SD | ||
| SRGAP3 | insertion | Frame_Shift_Ins | novel | c.2659_2660insAAAGGACAAAG | p.Pro887GlnfsTer55 | p.P887Qfs*55 | O43295 | protein_coding | TCGA-E2-A158-01 | Breast | breast invasive carcinoma | Female | <65 | I/II | Chemotherapy | arimidex | SD | ||
| SRGAP3 | SNV | Missense_Mutation | novel | c.2558G>A | p.Arg853Gln | p.R853Q | O43295 | protein_coding | deleterious(0.02) | possibly_damaging(0.885) | TCGA-2W-A8YY-01 | Cervix | cervical & endocervical cancer | Female | <65 | I/II | Chemotherapy | cisplatin | CR |
| Page: 1 2 3 4 5 6 7 8 9 10 11 12 |
Top |
Related drugs of malignant transformation related genes |
| Identification of chemicals and drugs interact with genes involved in malignant transfromation |
| (DGIdb 4.0) |
| Entrez ID | Symbol | Category | Interaction Types | Drug Claim Name | Drug Name | PMIDs |
| Page: 1 |

Copyright 2023-Present -The University of Texas Health Science Center at Houston |