
|
|||||
|
 | |
| |
| |
| |
| |
| |
|
Gene: SPG21 |
Gene summary for SPG21 |
| Gene information | Species | Human | Gene symbol | SPG21 | Gene ID | 51324 |
| Gene name | SPG21 abhydrolase domain containing, maspardin | |
| Gene Alias | ABHD21 | |
| Cytomap | 15q22.31 | |
| Gene Type | protein-coding | GO ID | GO:0002253 | UniProtAcc | A0A024R5Y1 |
Top |
Malignant transformation analysis |
| Identification of the aberrant gene expression in precancerous and cancerous lesions by comparing the gene expression of stem-like cells in diseased tissues with normal stem cells |
| Entrez ID | Symbol | Replicates | Species | Organ | Tissue | Adj P-value | Log2FC | Malignancy |
| 51324 | SPG21 | P30T-E | Human | Esophagus | ESCC | 7.22e-41 | 1.79e+00 | 0.137 |
| 51324 | SPG21 | P31T-E | Human | Esophagus | ESCC | 6.07e-45 | 9.96e-01 | 0.1251 |
| 51324 | SPG21 | P32T-E | Human | Esophagus | ESCC | 3.08e-35 | 9.28e-01 | 0.1666 |
| 51324 | SPG21 | P36T-E | Human | Esophagus | ESCC | 2.51e-32 | 9.28e-01 | 0.1187 |
| 51324 | SPG21 | P37T-E | Human | Esophagus | ESCC | 2.08e-40 | 9.76e-01 | 0.1371 |
| 51324 | SPG21 | P39T-E | Human | Esophagus | ESCC | 1.55e-21 | 5.81e-01 | 0.0894 |
| 51324 | SPG21 | P40T-E | Human | Esophagus | ESCC | 6.95e-04 | 1.86e-01 | 0.109 |
| 51324 | SPG21 | P42T-E | Human | Esophagus | ESCC | 2.08e-25 | 9.14e-01 | 0.1175 |
| 51324 | SPG21 | P44T-E | Human | Esophagus | ESCC | 1.34e-12 | 6.10e-01 | 0.1096 |
| 51324 | SPG21 | P47T-E | Human | Esophagus | ESCC | 6.00e-29 | 6.60e-01 | 0.1067 |
| 51324 | SPG21 | P48T-E | Human | Esophagus | ESCC | 1.65e-19 | 5.53e-01 | 0.0959 |
| 51324 | SPG21 | P49T-E | Human | Esophagus | ESCC | 9.18e-19 | 2.08e+00 | 0.1768 |
| 51324 | SPG21 | P52T-E | Human | Esophagus | ESCC | 1.11e-41 | 1.32e+00 | 0.1555 |
| 51324 | SPG21 | P54T-E | Human | Esophagus | ESCC | 5.05e-32 | 8.09e-01 | 0.0975 |
| 51324 | SPG21 | P56T-E | Human | Esophagus | ESCC | 3.47e-07 | 1.35e+00 | 0.1613 |
| 51324 | SPG21 | P57T-E | Human | Esophagus | ESCC | 3.27e-26 | 6.06e-01 | 0.0926 |
| 51324 | SPG21 | P61T-E | Human | Esophagus | ESCC | 1.10e-14 | 5.05e-01 | 0.099 |
| 51324 | SPG21 | P62T-E | Human | Esophagus | ESCC | 1.22e-50 | 8.66e-01 | 0.1302 |
| 51324 | SPG21 | P65T-E | Human | Esophagus | ESCC | 2.83e-22 | 4.96e-01 | 0.0978 |
| 51324 | SPG21 | P74T-E | Human | Esophagus | ESCC | 3.03e-40 | 1.18e+00 | 0.1479 |
| Page: 1 2 3 4 5 6 7 |
| Tissue | Expression Dynamics | Abbreviation |
| Colorectum (GSE201348) | 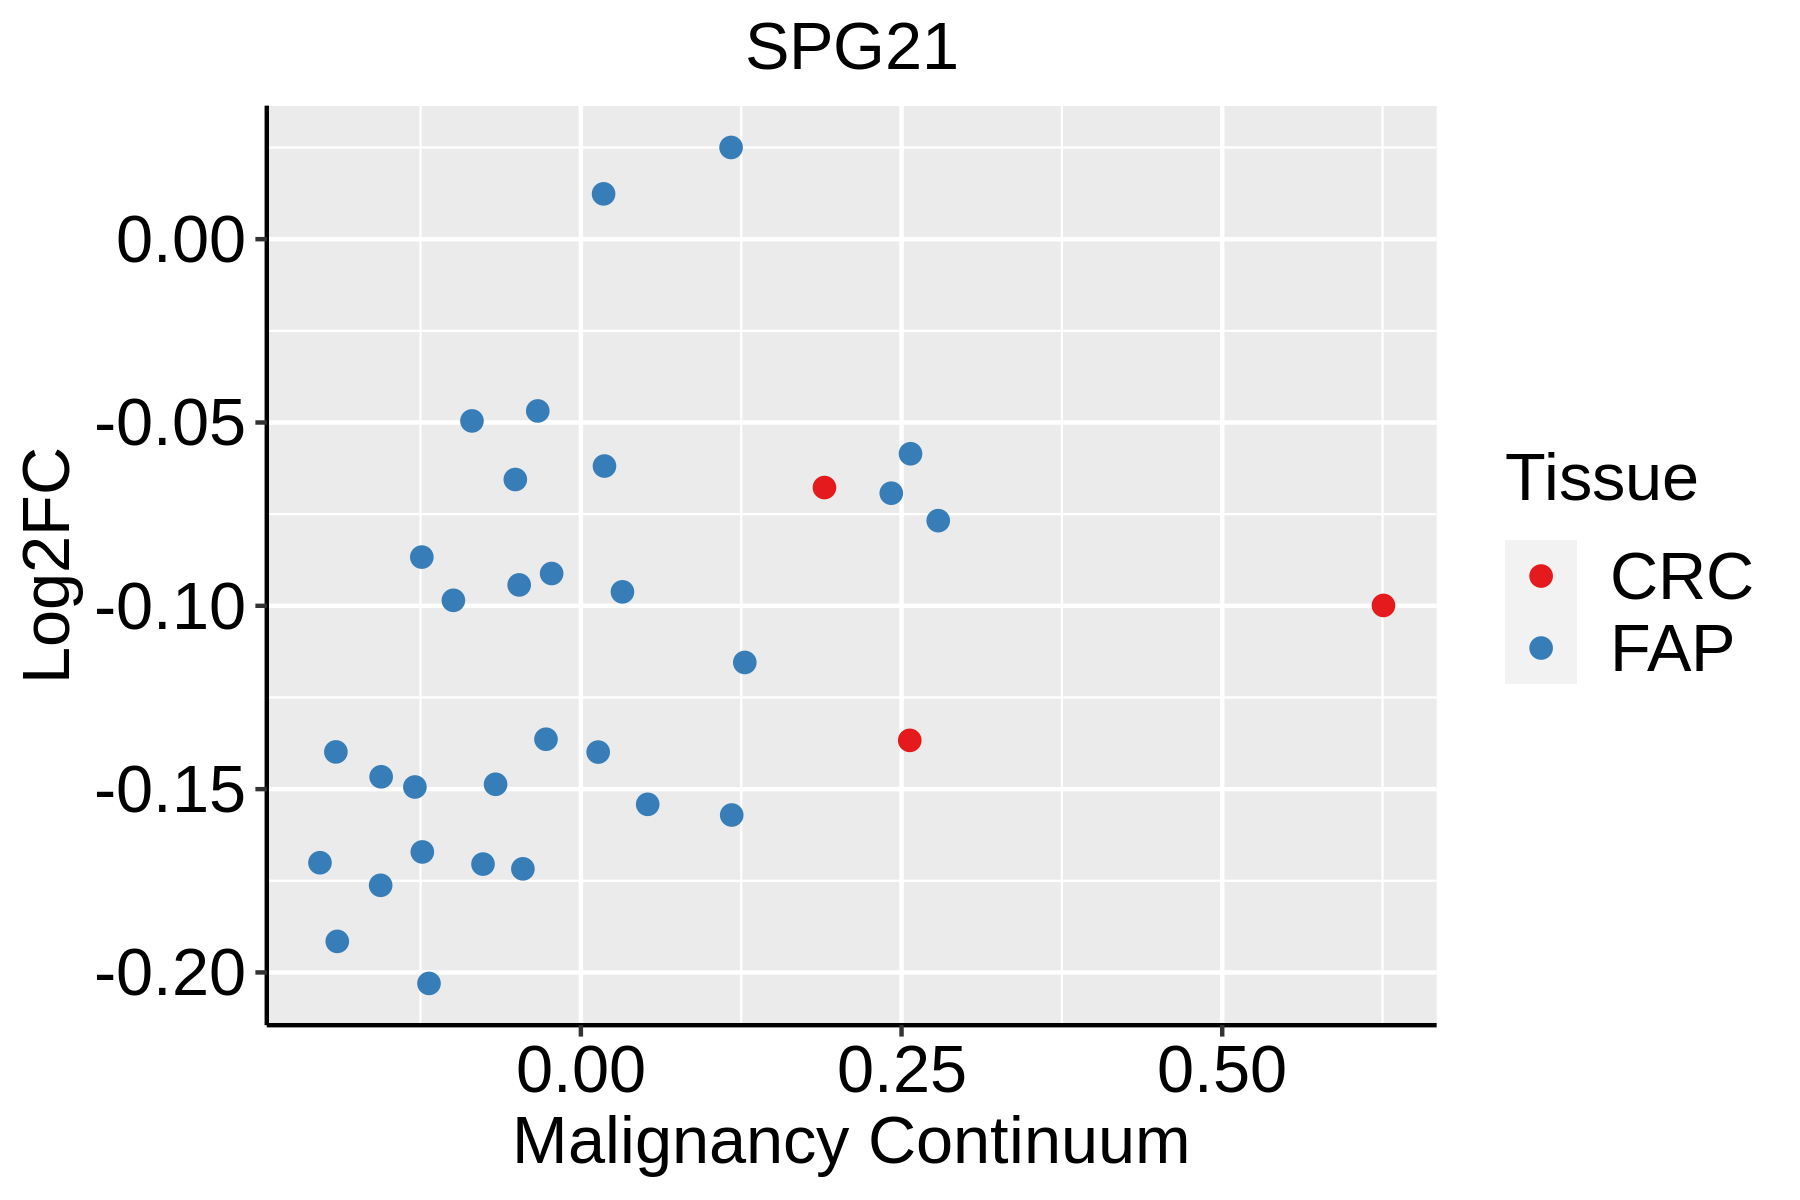 | FAP: Familial adenomatous polyposis |
| CRC: Colorectal cancer | ||
| Colorectum (HTA11) |  | AD: Adenomas |
| SER: Sessile serrated lesions | ||
| MSI-H: Microsatellite-high colorectal cancer | ||
| MSS: Microsatellite stable colorectal cancer | ||
| Esophagus |  | ESCC: Esophageal squamous cell carcinoma |
| HGIN: High-grade intraepithelial neoplasias | ||
| LGIN: Low-grade intraepithelial neoplasias | ||
| Liver |  | HCC: Hepatocellular carcinoma |
| NAFLD: Non-alcoholic fatty liver disease | ||
| Oral Cavity |  | EOLP: Erosive Oral lichen planus |
| LP: leukoplakia | ||
| NEOLP: Non-erosive oral lichen planus | ||
| OSCC: Oral squamous cell carcinoma | ||
| Prostate | 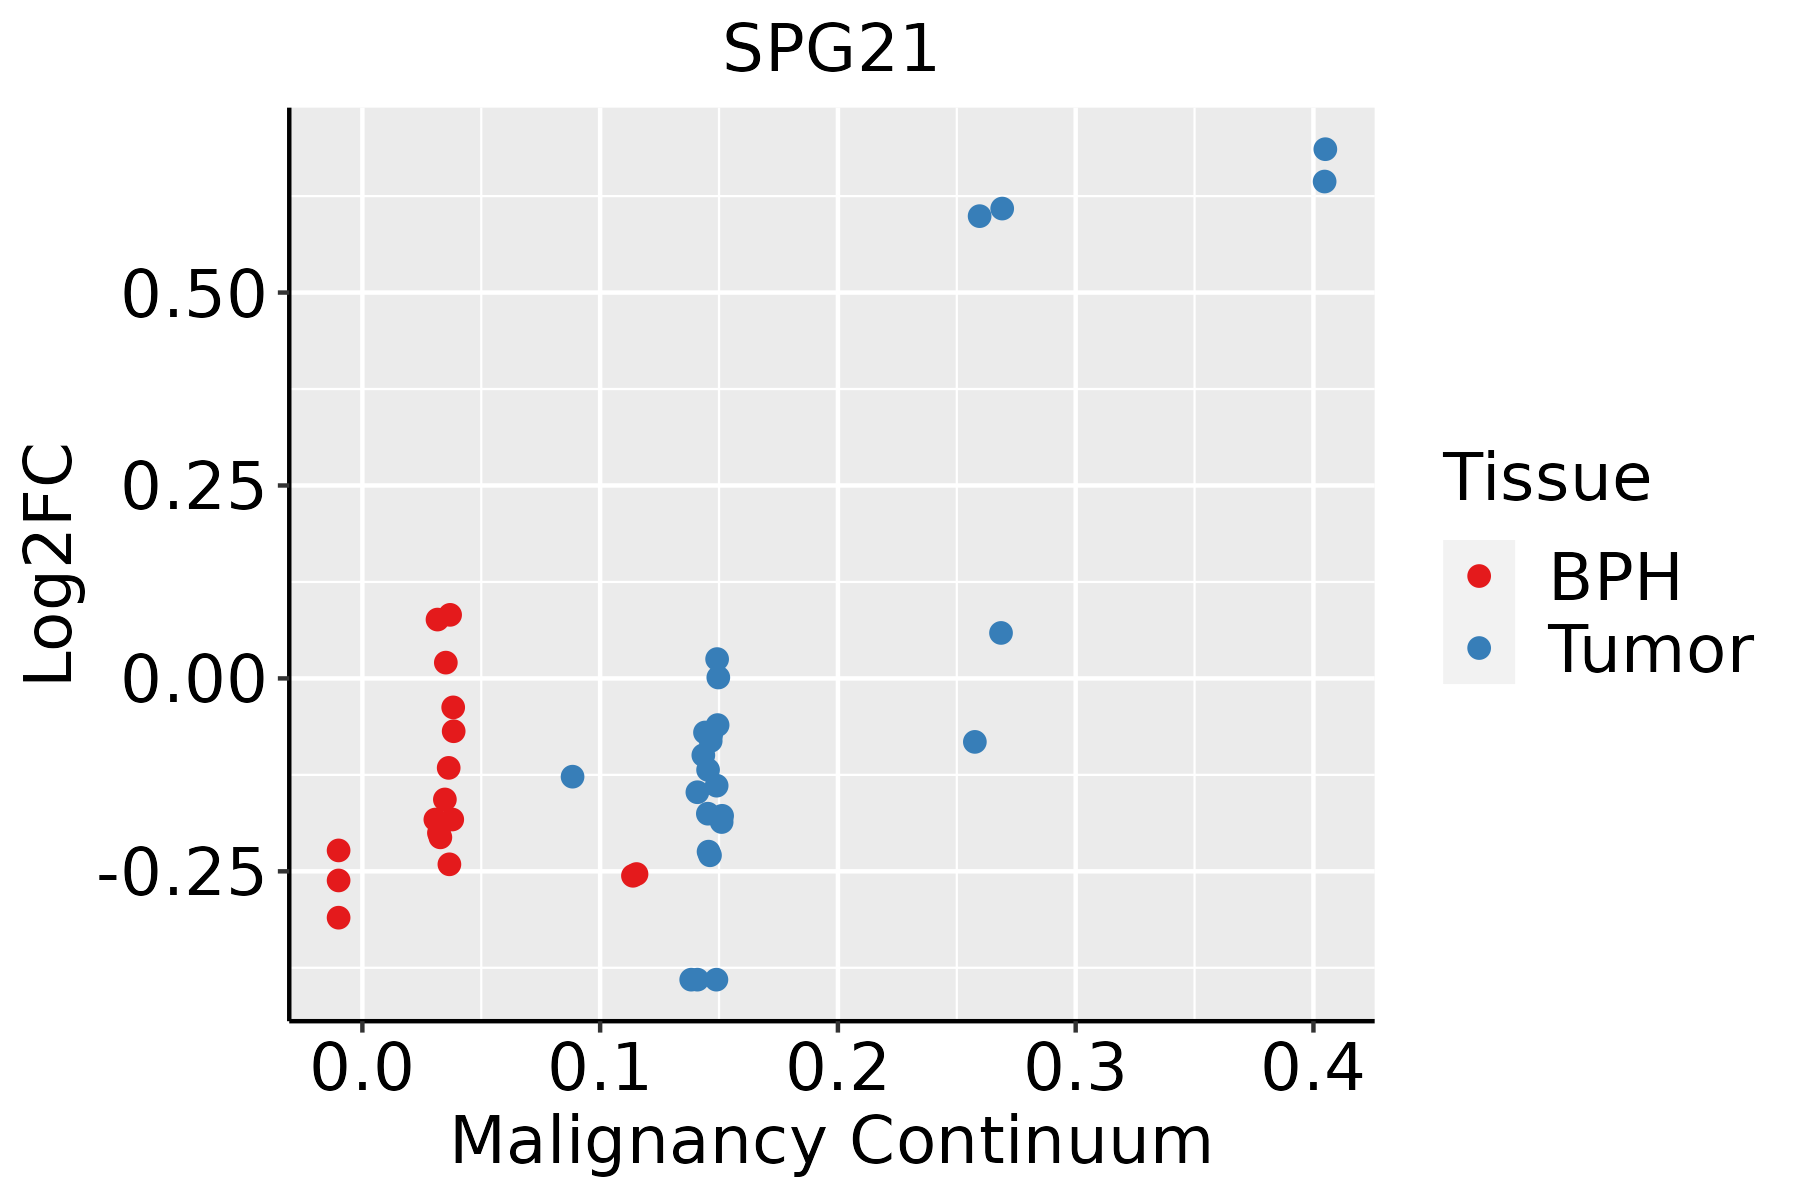 | BPH: Benign Prostatic Hyperplasia |
| Skin | 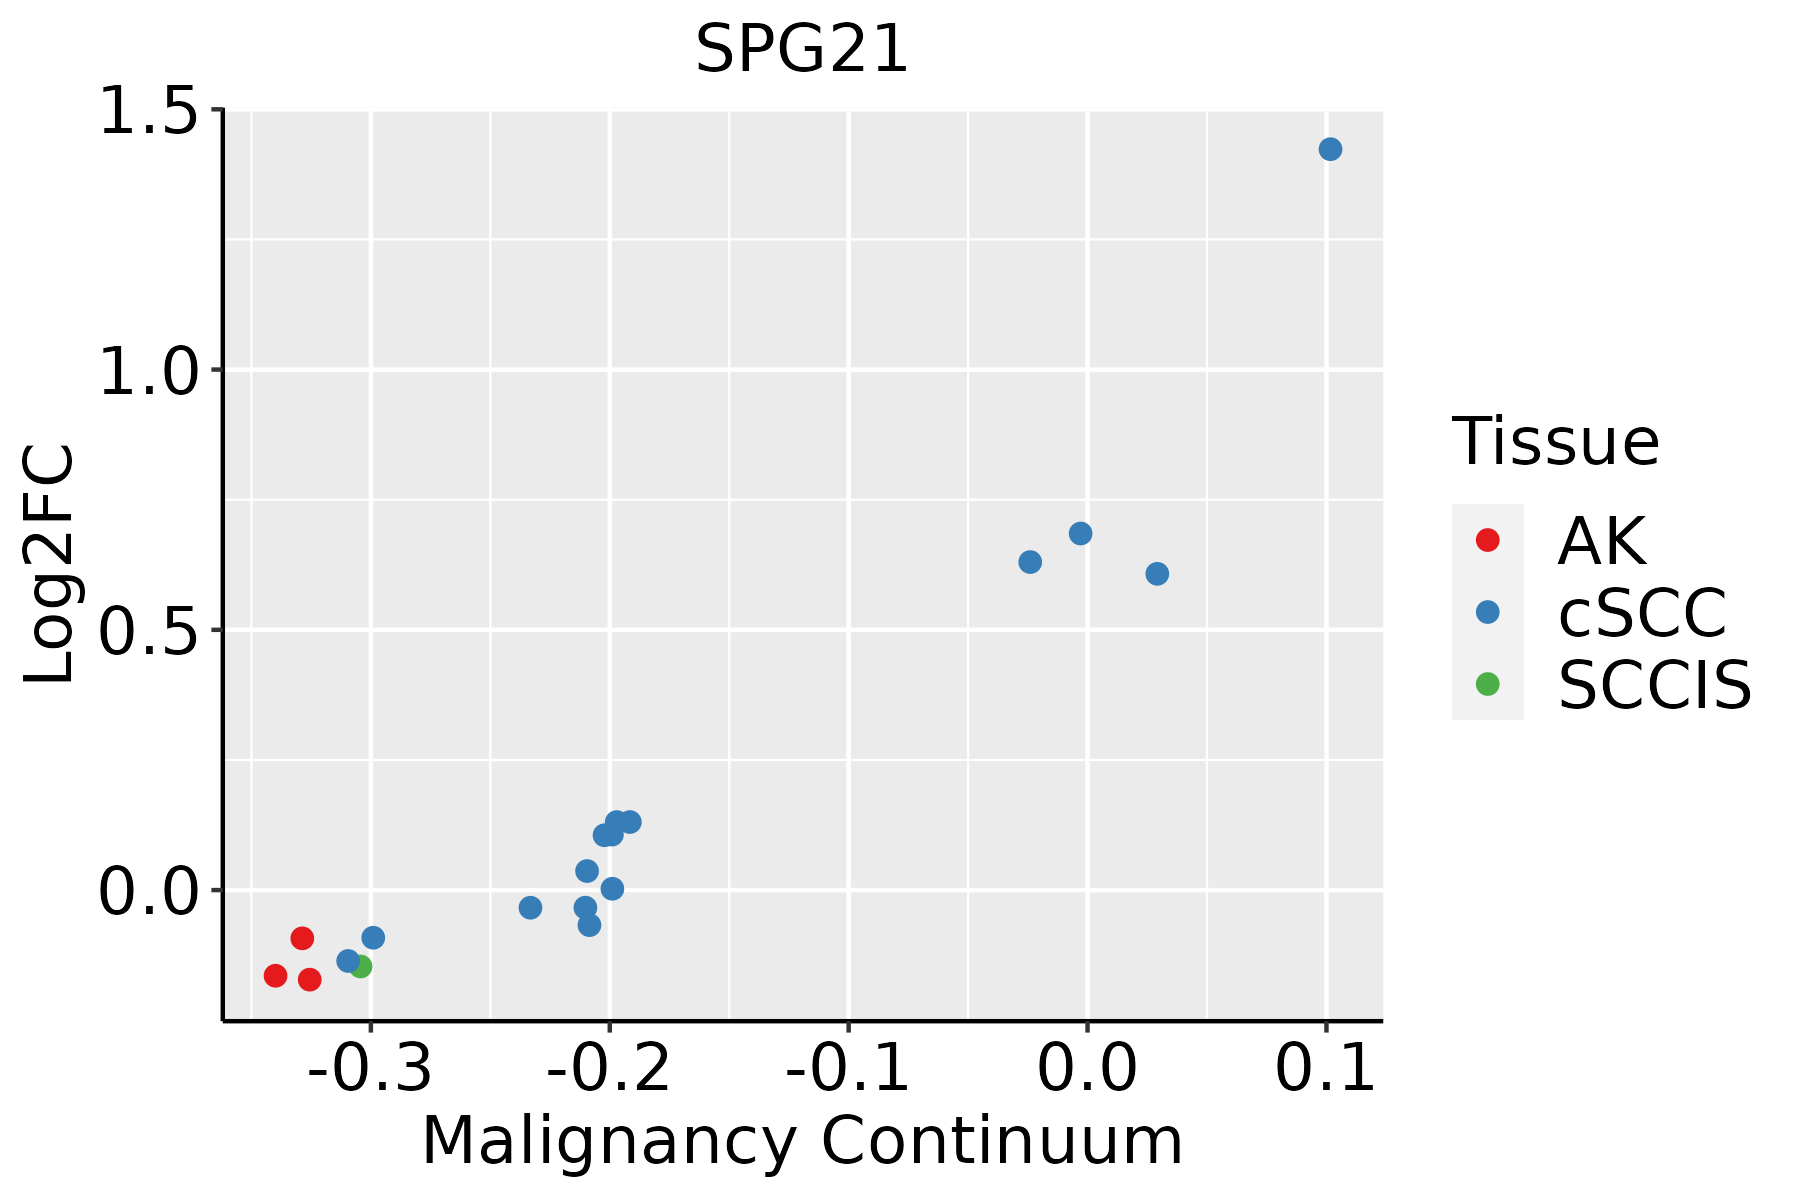 | AK: Actinic keratosis |
| cSCC: Cutaneous squamous cell carcinoma | ||
| SCCIS:squamous cell carcinoma in situ | ||
| Thyroid | 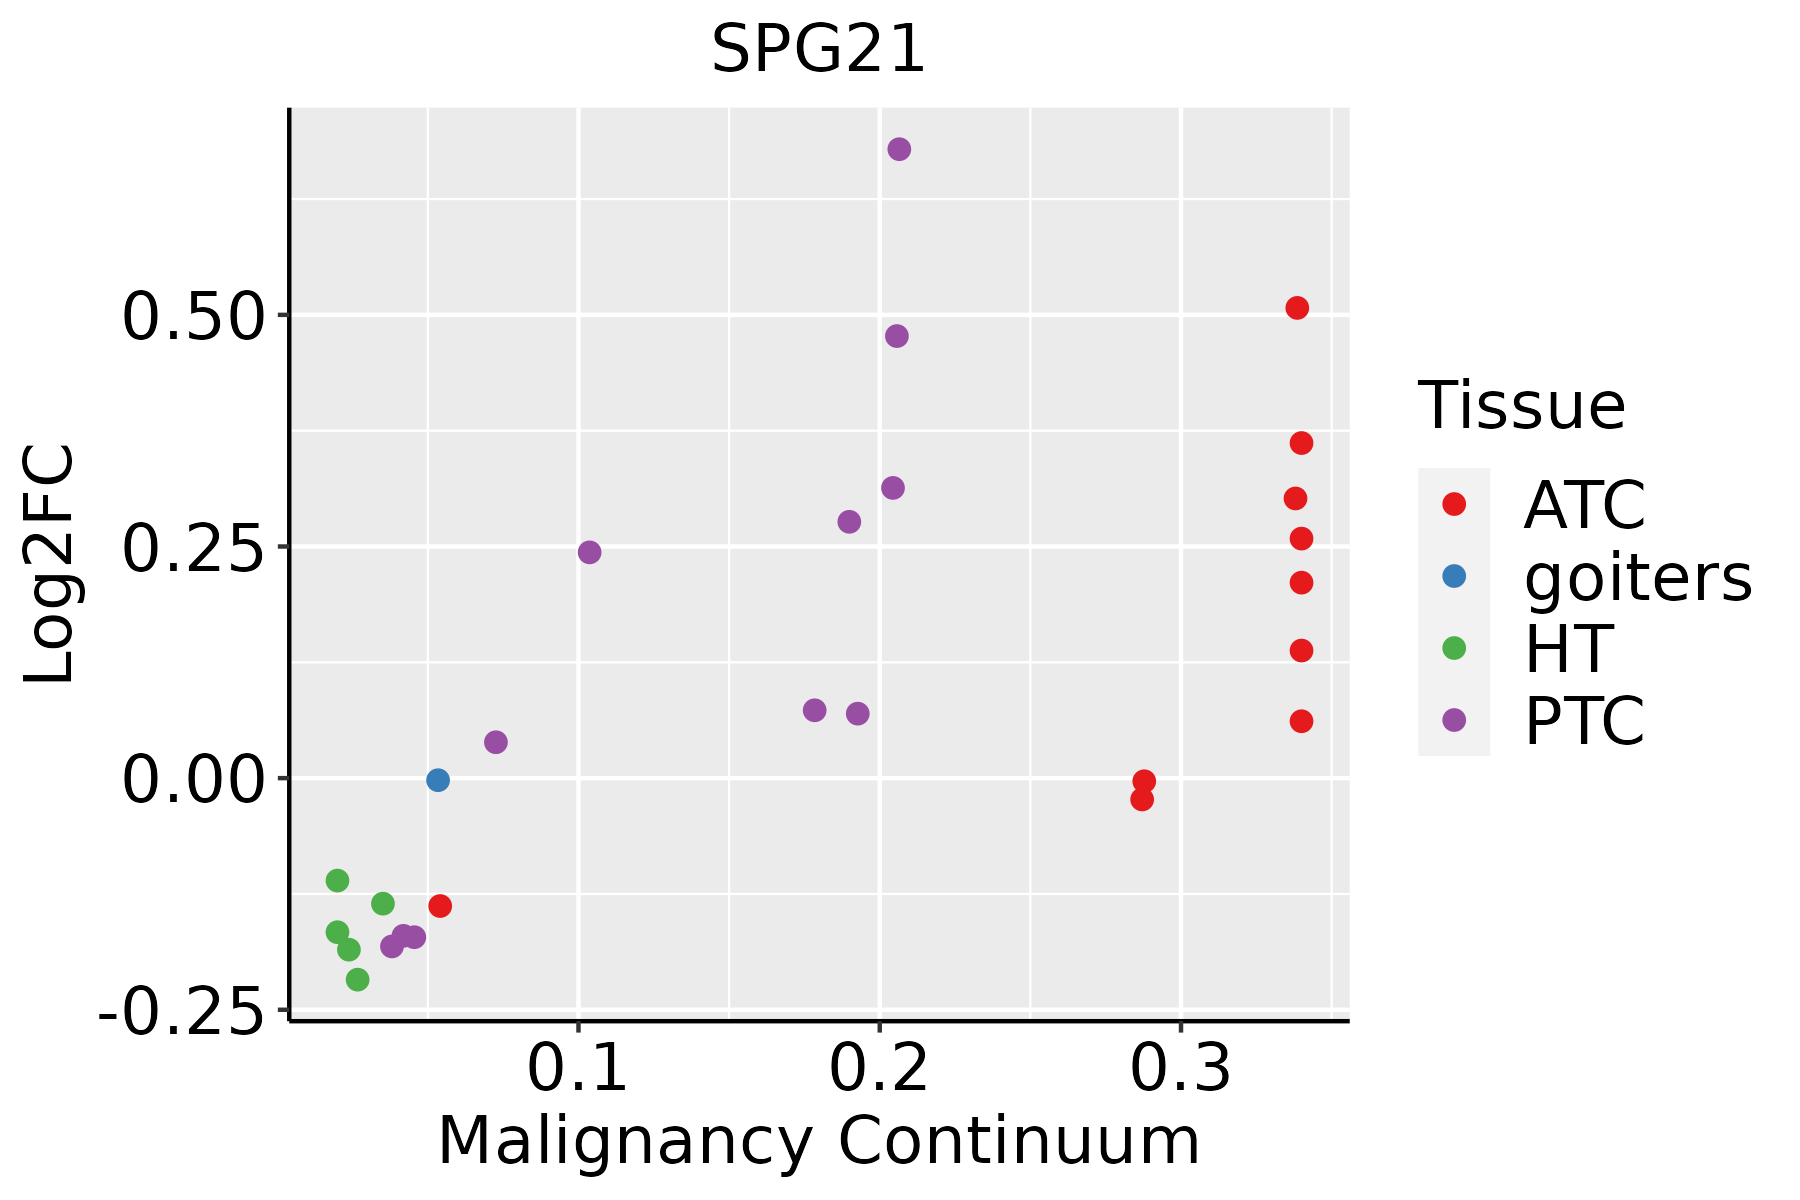 | ATC: Anaplastic thyroid cancer |
| HT: Hashimoto's thyroiditis | ||
| PTC: Papillary thyroid cancer |
| ∗log2FC in expression of this searched gene in stem-like cells from each diseased tissue sample relative to stem-like cells in normal samples in each tissue plotted against the malignancy continuum. Samples are colored based on if they are from different disease stage. |
Top |
Malignant transformation related pathway analysis |
| Find out the enriched GO biological processes and KEGG pathways involved in transition from healthy to precancer to cancer |
| Tissue | Disease Stage | Enriched GO biological Processes |
| Colorectum | AD |  |
| Colorectum | SER |  |
| Colorectum | MSS |  |
| Colorectum | MSI-H |  |
| Colorectum | FAP |  |
| ∗Top 15 enriched GO BP terms are showed in the bar plot of each disease state in each tissue. Each row represents a significant GO biological process which is colored according to the -log10(p.adjust). |
| Page: 1 2 3 4 5 6 7 8 9 |
| GO ID | Tissue | Disease Stage | Description | Gene Ratio | Bg Ratio | pvalue | p.adjust | Count |
| GO:00027646 | Oral cavity | OSCC | immune response-regulating signaling pathway | 212/7305 | 468/18723 | 2.93e-03 | 1.27e-02 | 212 |
| GO:00022536 | Thyroid | HT | activation of immune response | 47/1272 | 375/18723 | 3.55e-05 | 7.40e-04 | 47 |
| GO:00027648 | Thyroid | HT | immune response-regulating signaling pathway | 50/1272 | 468/18723 | 9.96e-04 | 1.02e-02 | 50 |
| GO:00508515 | Thyroid | HT | antigen receptor-mediated signaling pathway | 27/1272 | 240/18723 | 6.87e-03 | 4.20e-02 | 27 |
| GO:00024293 | Thyroid | HT | immune response-activating cell surface receptor signaling pathway | 31/1272 | 291/18723 | 8.69e-03 | 4.92e-02 | 31 |
| GO:00027573 | Thyroid | HT | immune response-activating signal transduction | 31/1272 | 291/18723 | 8.69e-03 | 4.92e-02 | 31 |
| Page: 1 |
| Pathway ID | Tissue | Disease Stage | Description | Gene Ratio | Bg Ratio | pvalue | p.adjust | qvalue | Count |
| hsa04144 | Colorectum | AD | Endocytosis | 111/2092 | 251/8465 | 5.95e-12 | 1.42e-10 | 9.08e-11 | 111 |
| hsa041441 | Colorectum | AD | Endocytosis | 111/2092 | 251/8465 | 5.95e-12 | 1.42e-10 | 9.08e-11 | 111 |
| hsa041444 | Colorectum | MSS | Endocytosis | 102/1875 | 251/8465 | 1.85e-11 | 4.43e-10 | 2.71e-10 | 102 |
| hsa041445 | Colorectum | MSS | Endocytosis | 102/1875 | 251/8465 | 1.85e-11 | 4.43e-10 | 2.71e-10 | 102 |
| hsa041446 | Colorectum | FAP | Endocytosis | 78/1404 | 251/8465 | 6.20e-09 | 2.96e-07 | 1.80e-07 | 78 |
| hsa041447 | Colorectum | FAP | Endocytosis | 78/1404 | 251/8465 | 6.20e-09 | 2.96e-07 | 1.80e-07 | 78 |
| hsa04144210 | Esophagus | ESCC | Endocytosis | 186/4205 | 251/8465 | 9.74e-16 | 4.66e-14 | 2.39e-14 | 186 |
| hsa0414437 | Esophagus | ESCC | Endocytosis | 186/4205 | 251/8465 | 9.74e-16 | 4.66e-14 | 2.39e-14 | 186 |
| hsa0414412 | Liver | Cirrhotic | Endocytosis | 119/2530 | 251/8465 | 2.33e-09 | 4.56e-08 | 2.81e-08 | 119 |
| hsa0414413 | Liver | Cirrhotic | Endocytosis | 119/2530 | 251/8465 | 2.33e-09 | 4.56e-08 | 2.81e-08 | 119 |
| hsa0414422 | Liver | HCC | Endocytosis | 178/4020 | 251/8465 | 2.03e-14 | 5.22e-13 | 2.91e-13 | 178 |
| hsa0414432 | Liver | HCC | Endocytosis | 178/4020 | 251/8465 | 2.03e-14 | 5.22e-13 | 2.91e-13 | 178 |
| hsa0414427 | Oral cavity | OSCC | Endocytosis | 174/3704 | 251/8465 | 9.42e-17 | 4.51e-15 | 2.29e-15 | 174 |
| hsa04144112 | Oral cavity | OSCC | Endocytosis | 174/3704 | 251/8465 | 9.42e-17 | 4.51e-15 | 2.29e-15 | 174 |
| hsa0414428 | Oral cavity | LP | Endocytosis | 121/2418 | 251/8465 | 1.89e-11 | 3.70e-10 | 2.38e-10 | 121 |
| hsa0414436 | Oral cavity | LP | Endocytosis | 121/2418 | 251/8465 | 1.89e-11 | 3.70e-10 | 2.38e-10 | 121 |
| hsa0414425 | Prostate | BPH | Endocytosis | 89/1718 | 251/8465 | 1.06e-08 | 1.29e-07 | 7.99e-08 | 89 |
| hsa04144111 | Prostate | BPH | Endocytosis | 89/1718 | 251/8465 | 1.06e-08 | 1.29e-07 | 7.99e-08 | 89 |
| hsa0414426 | Prostate | Tumor | Endocytosis | 92/1791 | 251/8465 | 7.83e-09 | 1.04e-07 | 6.43e-08 | 92 |
| hsa0414435 | Prostate | Tumor | Endocytosis | 92/1791 | 251/8465 | 7.83e-09 | 1.04e-07 | 6.43e-08 | 92 |
| Page: 1 |
Top |
Cell-cell communication analysis |
| Identification of potential cell-cell interactions between two cell types and their ligand-receptor pairs for different disease states |
| Ligand | Receptor | LRpair | Pathway | Tissue | Disease Stage |
| Page: 1 |
Top |
Single-cell gene regulatory network inference analysis |
| Find out the significant the regulons (TFs) and the target genes of each regulon across cell types for different disease states |
| TF | Cell Type | Tissue | Disease Stage | Target Gene | RSS | Regulon Activity |
| ∗The dot plots of a searched regulon are shown for all cell subpopulations in each disease state of each tissue based on the regulon specific score inferred using pySCENIC and by calculating the average expression. |
| Page: 1 |
Top |
Somatic mutation of malignant transformation related genes |
| Annotation of somatic variants for genes involved in malignant transformation |
| Hugo Symbol | Variant Class | Variant Classification | dbSNP RS | HGVSc | HGVSp | HGVSp Short | SWISSPROT | BIOTYPE | SIFT | PolyPhen | Tumor Sample Barcode | Tissue | Histology | Sex | Age | Stage | Therapy Types | Drugs | Outcome |
| SPG21 | SNV | Missense_Mutation | c.244T>C | p.Trp82Arg | p.W82R | Q9NZD8 | protein_coding | deleterious(0) | possibly_damaging(0.89) | TCGA-AN-A0AK-01 | Breast | breast invasive carcinoma | Female | >=65 | I/II | Unknown | Unknown | SD | |
| SPG21 | SNV | Missense_Mutation | c.596G>A | p.Arg199Lys | p.R199K | Q9NZD8 | protein_coding | deleterious(0) | probably_damaging(1) | TCGA-BH-A0HF-01 | Breast | breast invasive carcinoma | Female | >=65 | I/II | Hormone Therapy | arimidex | SD | |
| SPG21 | SNV | Missense_Mutation | c.173N>G | p.Val58Gly | p.V58G | Q9NZD8 | protein_coding | deleterious(0) | possibly_damaging(0.88) | TCGA-CM-4746-01 | Colorectum | colon adenocarcinoma | Male | <65 | I/II | Unknown | Unknown | SD | |
| SPG21 | SNV | Missense_Mutation | rs756437687 | c.644N>A | p.Arg215Gln | p.R215Q | Q9NZD8 | protein_coding | tolerated(0.64) | benign(0.006) | TCGA-AG-A02N-01 | Colorectum | rectum adenocarcinoma | Male | >=65 | I/II | Chemotherapy | folinic | CR |
| SPG21 | SNV | Missense_Mutation | c.499A>C | p.Asn167His | p.N167H | Q9NZD8 | protein_coding | deleterious(0.02) | possibly_damaging(0.63) | TCGA-CI-6620-01 | Colorectum | rectum adenocarcinoma | Female | <65 | I/II | Ancillary | leucovorin | PD | |
| SPG21 | insertion | Frame_Shift_Ins | c.487dupA | p.Ile163AsnfsTer17 | p.I163Nfs*17 | Q9NZD8 | protein_coding | TCGA-AD-6964-01 | Colorectum | colon adenocarcinoma | Male | <65 | III/IV | Chemotherapy | folfox | PD | |||
| SPG21 | deletion | Frame_Shift_Del | c.487delA | p.Ile163Ter | p.I163* | Q9NZD8 | protein_coding | TCGA-G4-6628-01 | Colorectum | colon adenocarcinoma | Male | >=65 | I/II | Unknown | Unknown | SD | |||
| SPG21 | SNV | Missense_Mutation | novel | c.320N>A | p.Gly107Asp | p.G107D | Q9NZD8 | protein_coding | deleterious(0) | probably_damaging(0.995) | TCGA-A5-A0G2-01 | Endometrium | uterine corpus endometrioid carcinoma | Female | <65 | III/IV | Unknown | Unknown | SD |
| SPG21 | SNV | Missense_Mutation | c.760G>A | p.Gly254Ser | p.G254S | Q9NZD8 | protein_coding | deleterious(0.02) | probably_damaging(1) | TCGA-AP-A0LM-01 | Endometrium | uterine corpus endometrioid carcinoma | Female | <65 | III/IV | Chemotherapy | cisplatin | SD | |
| SPG21 | SNV | Missense_Mutation | rs755420818 | c.193N>A | p.Ala65Thr | p.A65T | Q9NZD8 | protein_coding | tolerated(0.22) | benign(0.015) | TCGA-AP-A1DK-01 | Endometrium | uterine corpus endometrioid carcinoma | Female | <65 | I/II | Unknown | Unknown | SD |
| Page: 1 2 3 |
Top |
Related drugs of malignant transformation related genes |
| Identification of chemicals and drugs interact with genes involved in malignant transfromation |
| (DGIdb 4.0) |
| Entrez ID | Symbol | Category | Interaction Types | Drug Claim Name | Drug Name | PMIDs |
| Page: 1 |

Copyright 2023-Present -The University of Texas Health Science Center at Houston |