
|
|||||
|
 | |
| |
| |
| |
| |
| |
|
Gene: SOX6 |
Gene summary for SOX6 |
| Gene information | Species | Human | Gene symbol | SOX6 | Gene ID | 55553 |
| Gene name | SRY-box transcription factor 6 | |
| Gene Alias | HSSOX6 | |
| Cytomap | 11p15.2 | |
| Gene Type | protein-coding | GO ID | GO:0001501 | UniProtAcc | P35712 |
Top |
Malignant transformation analysis |
| Identification of the aberrant gene expression in precancerous and cancerous lesions by comparing the gene expression of stem-like cells in diseased tissues with normal stem cells |
| Entrez ID | Symbol | Replicates | Species | Organ | Tissue | Adj P-value | Log2FC | Malignancy |
| 55553 | SOX6 | P30T-E | Human | Esophagus | ESCC | 3.82e-18 | 6.17e-01 | 0.137 |
| 55553 | SOX6 | P31T-E | Human | Esophagus | ESCC | 7.99e-08 | 3.89e-02 | 0.1251 |
| 55553 | SOX6 | P32T-E | Human | Esophagus | ESCC | 3.64e-04 | 1.31e-01 | 0.1666 |
| 55553 | SOX6 | P36T-E | Human | Esophagus | ESCC | 1.81e-05 | 2.74e-01 | 0.1187 |
| 55553 | SOX6 | P37T-E | Human | Esophagus | ESCC | 3.14e-04 | 6.66e-02 | 0.1371 |
| 55553 | SOX6 | P39T-E | Human | Esophagus | ESCC | 5.82e-15 | 2.83e-01 | 0.0894 |
| 55553 | SOX6 | P40T-E | Human | Esophagus | ESCC | 5.55e-05 | 1.79e-01 | 0.109 |
| 55553 | SOX6 | P42T-E | Human | Esophagus | ESCC | 5.59e-06 | 1.86e-01 | 0.1175 |
| 55553 | SOX6 | P47T-E | Human | Esophagus | ESCC | 3.41e-05 | -2.65e-03 | 0.1067 |
| 55553 | SOX6 | P48T-E | Human | Esophagus | ESCC | 1.41e-18 | 3.46e-01 | 0.0959 |
| 55553 | SOX6 | P49T-E | Human | Esophagus | ESCC | 5.31e-04 | 3.91e-01 | 0.1768 |
| 55553 | SOX6 | P52T-E | Human | Esophagus | ESCC | 2.54e-08 | 2.95e-01 | 0.1555 |
| 55553 | SOX6 | P54T-E | Human | Esophagus | ESCC | 3.47e-12 | 1.70e-01 | 0.0975 |
| 55553 | SOX6 | P56T-E | Human | Esophagus | ESCC | 4.35e-02 | 4.21e-01 | 0.1613 |
| 55553 | SOX6 | P61T-E | Human | Esophagus | ESCC | 2.53e-09 | 2.24e-01 | 0.099 |
| 55553 | SOX6 | P62T-E | Human | Esophagus | ESCC | 2.49e-26 | 4.82e-01 | 0.1302 |
| 55553 | SOX6 | P65T-E | Human | Esophagus | ESCC | 1.75e-07 | 2.01e-01 | 0.0978 |
| 55553 | SOX6 | P74T-E | Human | Esophagus | ESCC | 5.12e-20 | 6.07e-01 | 0.1479 |
| 55553 | SOX6 | P76T-E | Human | Esophagus | ESCC | 5.85e-09 | 7.43e-02 | 0.1207 |
| 55553 | SOX6 | P83T-E | Human | Esophagus | ESCC | 1.37e-11 | 4.02e-01 | 0.1738 |
| Page: 1 2 3 4 5 6 |
| Tissue | Expression Dynamics | Abbreviation |
| Cervix |  | CC: Cervix cancer |
| HSIL_HPV: HPV-infected high-grade squamous intraepithelial lesions | ||
| N_HPV: HPV-infected normal cervix | ||
| Colorectum (GSE201348) |  | FAP: Familial adenomatous polyposis |
| CRC: Colorectal cancer | ||
| Colorectum (HTA11) |  | AD: Adenomas |
| SER: Sessile serrated lesions | ||
| MSI-H: Microsatellite-high colorectal cancer | ||
| MSS: Microsatellite stable colorectal cancer | ||
| Endometrium | 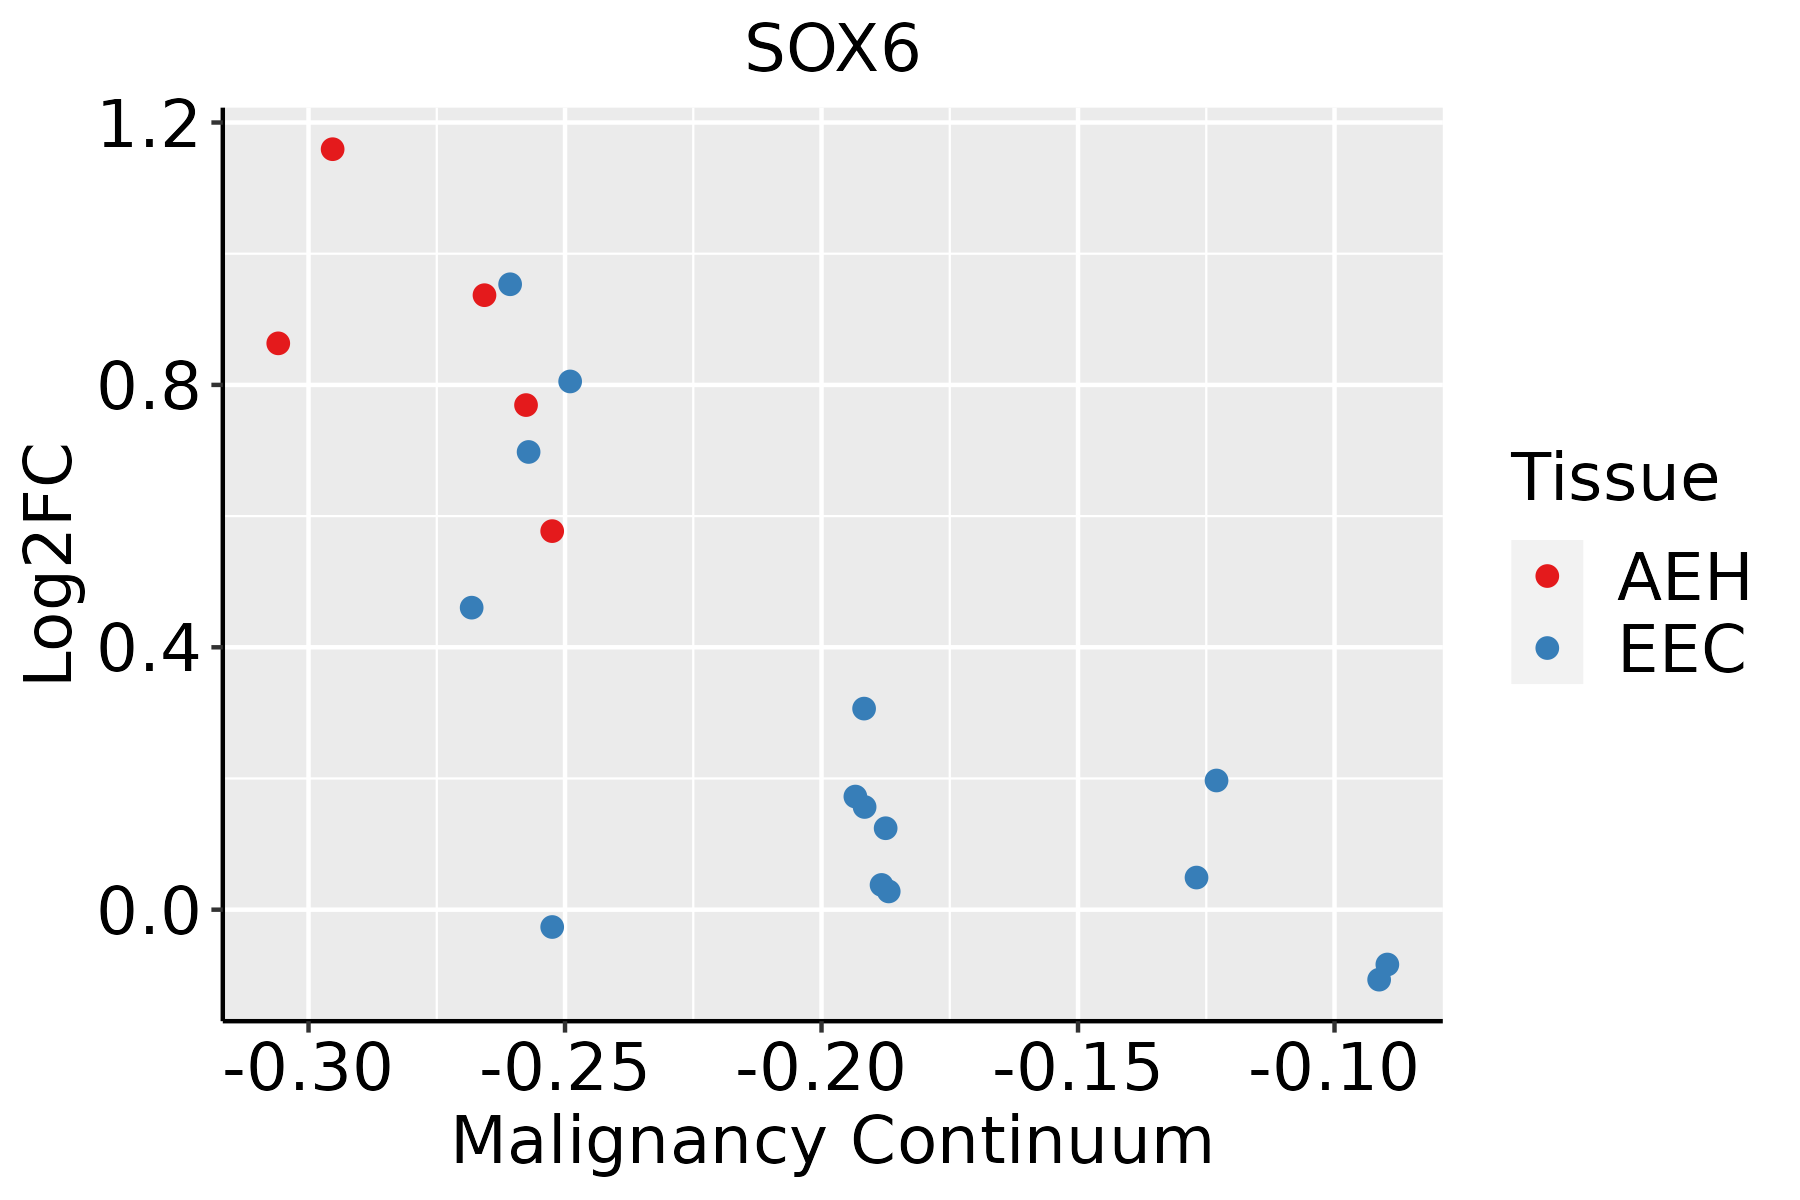 | AEH: Atypical endometrial hyperplasia |
| EEC: Endometrioid Cancer | ||
| Esophagus | 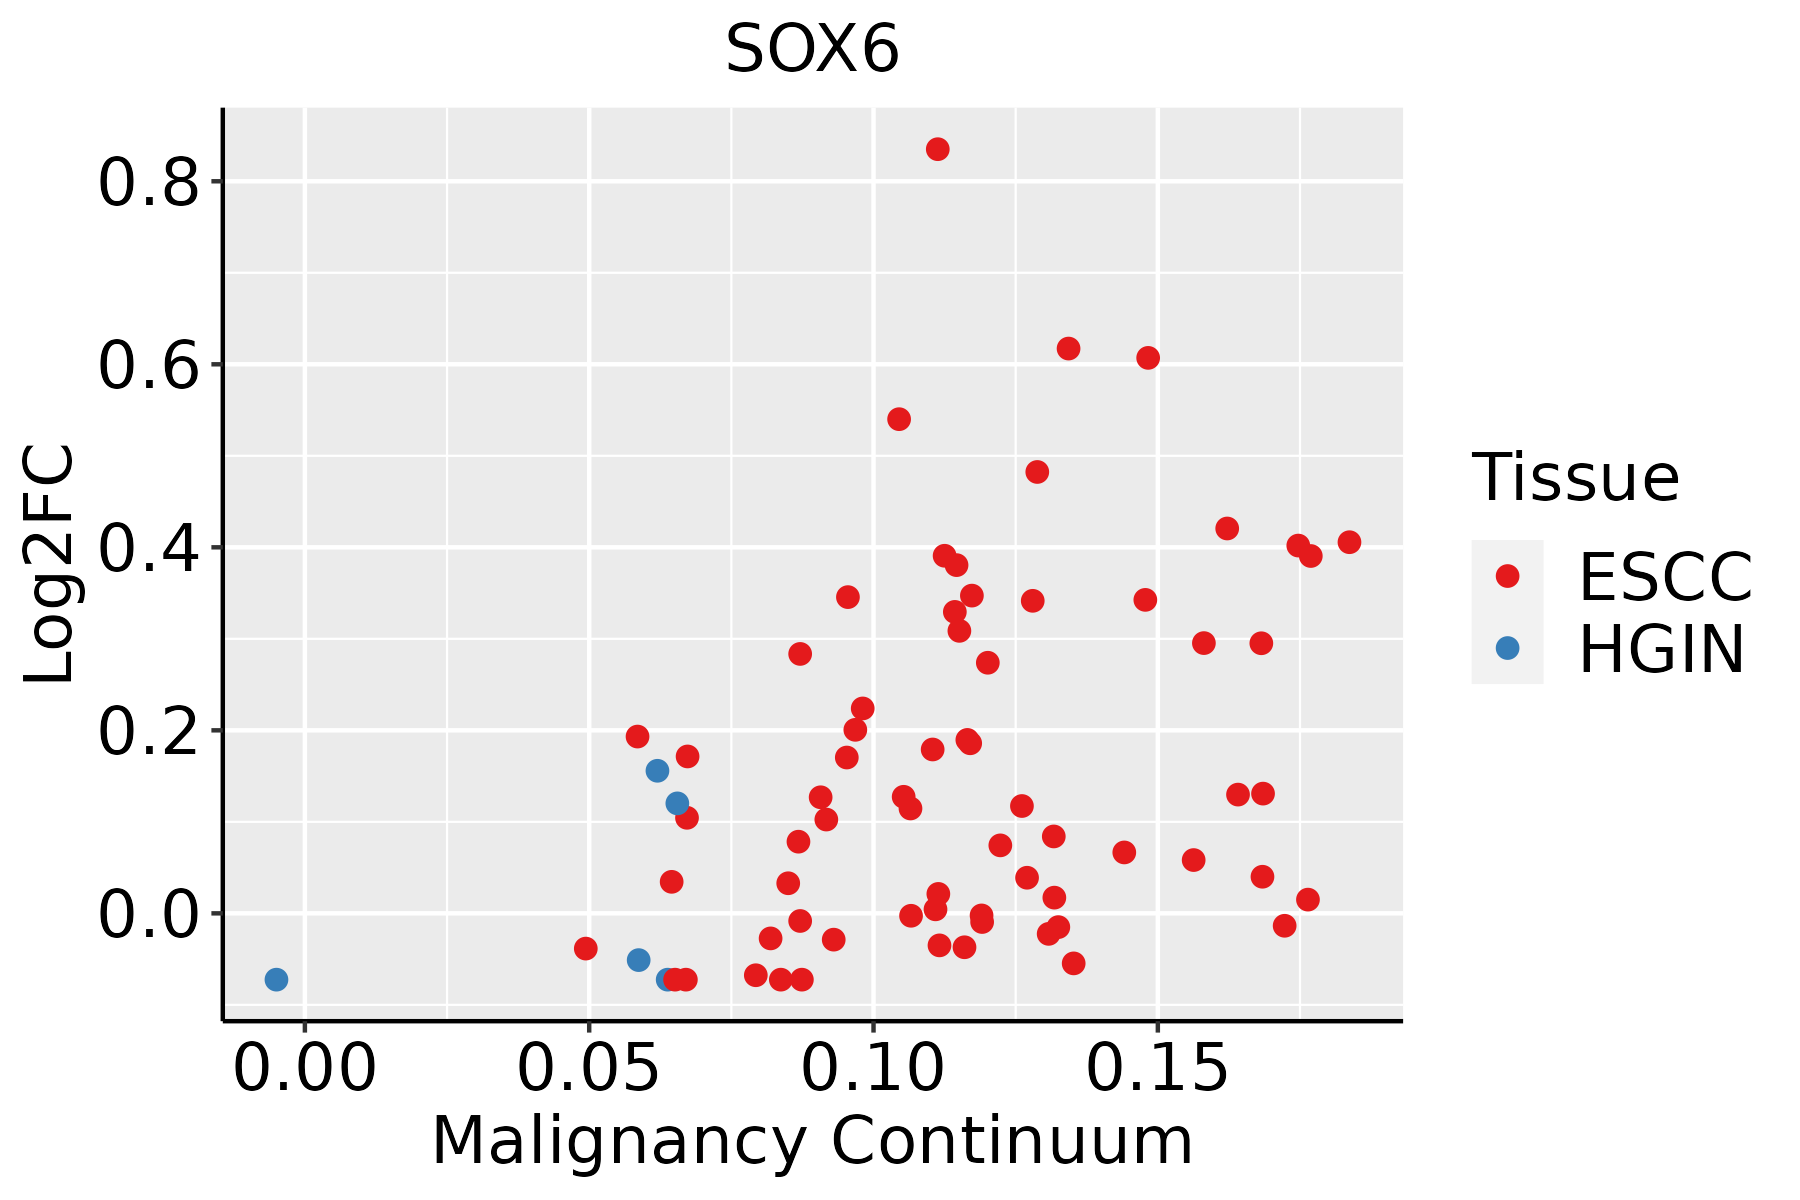 | ESCC: Esophageal squamous cell carcinoma |
| HGIN: High-grade intraepithelial neoplasias | ||
| LGIN: Low-grade intraepithelial neoplasias | ||
| Liver |  | HCC: Hepatocellular carcinoma |
| NAFLD: Non-alcoholic fatty liver disease | ||
| Lung |  | AAH: Atypical adenomatous hyperplasia |
| AIS: Adenocarcinoma in situ | ||
| IAC: Invasive lung adenocarcinoma | ||
| MIA: Minimally invasive adenocarcinoma | ||
| Skin |  | AK: Actinic keratosis |
| cSCC: Cutaneous squamous cell carcinoma | ||
| SCCIS:squamous cell carcinoma in situ |
| ∗log2FC in expression of this searched gene in stem-like cells from each diseased tissue sample relative to stem-like cells in normal samples in each tissue plotted against the malignancy continuum. Samples are colored based on if they are from different disease stage. |
Top |
Malignant transformation related pathway analysis |
| Find out the enriched GO biological processes and KEGG pathways involved in transition from healthy to precancer to cancer |
| Tissue | Disease Stage | Enriched GO biological Processes |
| Colorectum | AD |  |
| Colorectum | SER |  |
| Colorectum | MSS |  |
| Colorectum | MSI-H |  |
| Colorectum | FAP |  |
| ∗Top 15 enriched GO BP terms are showed in the bar plot of each disease state in each tissue. Each row represents a significant GO biological process which is colored according to the -log10(p.adjust). |
| Page: 1 2 3 4 5 6 7 8 9 |
| GO ID | Tissue | Disease Stage | Description | Gene Ratio | Bg Ratio | pvalue | p.adjust | Count |
| GO:20007362 | Cervix | CC | regulation of stem cell differentiation | 19/2311 | 58/18723 | 4.01e-05 | 6.21e-04 | 19 |
| GO:00488634 | Cervix | CC | stem cell differentiation | 46/2311 | 206/18723 | 4.11e-05 | 6.36e-04 | 46 |
| GO:00605375 | Cervix | CC | muscle tissue development | 76/2311 | 403/18723 | 9.76e-05 | 1.27e-03 | 76 |
| GO:00147064 | Cervix | CC | striated muscle tissue development | 72/2311 | 384/18723 | 1.76e-04 | 2.07e-03 | 72 |
| GO:00715595 | Cervix | CC | response to transforming growth factor beta | 50/2311 | 256/18723 | 6.31e-04 | 5.91e-03 | 50 |
| GO:00715605 | Cervix | CC | cellular response to transforming growth factor beta stimulus | 49/2311 | 250/18723 | 6.55e-04 | 6.05e-03 | 49 |
| GO:00426924 | Cervix | CC | muscle cell differentiation | 69/2311 | 384/18723 | 8.12e-04 | 7.09e-03 | 69 |
| GO:00075173 | Cervix | CC | muscle organ development | 58/2311 | 327/18723 | 2.73e-03 | 1.85e-02 | 58 |
| GO:00511464 | Cervix | CC | striated muscle cell differentiation | 50/2311 | 283/18723 | 5.53e-03 | 3.19e-02 | 50 |
| GO:0071559 | Colorectum | AD | response to transforming growth factor beta | 74/3918 | 256/18723 | 1.45e-03 | 1.23e-02 | 74 |
| GO:0071560 | Colorectum | AD | cellular response to transforming growth factor beta stimulus | 72/3918 | 250/18723 | 1.85e-03 | 1.52e-02 | 72 |
| GO:00715592 | Colorectum | CRC | response to transforming growth factor beta | 51/2078 | 256/18723 | 2.33e-05 | 6.65e-04 | 51 |
| GO:00715602 | Colorectum | CRC | cellular response to transforming growth factor beta stimulus | 49/2078 | 250/18723 | 5.17e-05 | 1.19e-03 | 49 |
| GO:00488631 | Colorectum | CRC | stem cell differentiation | 39/2078 | 206/18723 | 5.89e-04 | 7.89e-03 | 39 |
| GO:0060537 | Colorectum | CRC | muscle tissue development | 63/2078 | 403/18723 | 3.17e-03 | 2.78e-02 | 63 |
| GO:0002062 | Colorectum | CRC | chondrocyte differentiation | 21/2078 | 106/18723 | 5.87e-03 | 4.33e-02 | 21 |
| GO:0014706 | Colorectum | CRC | striated muscle tissue development | 59/2078 | 384/18723 | 6.11e-03 | 4.47e-02 | 59 |
| GO:0048705 | Colorectum | CRC | skeletal system morphogenesis | 37/2078 | 220/18723 | 6.58e-03 | 4.71e-02 | 37 |
| GO:00605376 | Endometrium | AEH | muscle tissue development | 83/2100 | 403/18723 | 2.57e-08 | 1.50e-06 | 83 |
| GO:00147065 | Endometrium | AEH | striated muscle tissue development | 75/2100 | 384/18723 | 1.06e-06 | 3.62e-05 | 75 |
| Page: 1 2 3 4 5 |
| Pathway ID | Tissue | Disease Stage | Description | Gene Ratio | Bg Ratio | pvalue | p.adjust | qvalue | Count |
| Page: 1 |
Top |
Cell-cell communication analysis |
| Identification of potential cell-cell interactions between two cell types and their ligand-receptor pairs for different disease states |
| Ligand | Receptor | LRpair | Pathway | Tissue | Disease Stage |
| Page: 1 |
Top |
Single-cell gene regulatory network inference analysis |
| Find out the significant the regulons (TFs) and the target genes of each regulon across cell types for different disease states |
| TF | Cell Type | Tissue | Disease Stage | Target Gene | RSS | Regulon Activity |
| SOX6 | BAS | Cervix | CC | NFIB,MAML2,TCF12, etc. | 9.01e-04 |  |
| SOX6 | COL | Cervix | CC | NFIB,MAML2,TCF12, etc. | 3.88e-03 | |
| SOX6 | COL | Cervix | N_HPV | NFIB,MAML2,TCF12, etc. | 3.48e-01 |  |
| SOX6 | IMGOB | Colorectum | MSS | SDK1,ST6GALNAC5,ITPR2, etc. | 5.34e-02 |  |
| SOX6 | CT | Colorectum | SER | SDK1,ST6GALNAC5,ITPR2, etc. | 5.68e-02 |  |
| SOX6 | CD8TEREX | Colorectum | FAP | ADGRL3,DMD,PTCH1, etc. | 1.39e-01 |  |
| SOX6 | VFIB | Colorectum | AD | MCTP2,WNT5B,FENDRR, etc. | 2.73e-01 |  |
| SOX6 | VFIB | Colorectum | ADJ | MCTP2,WNT5B,FENDRR, etc. | 1.69e-01 |  |
| SOX6 | VFIB | Colorectum | CRC | MCTP2,WNT5B,FENDRR, etc. | 1.51e-01 |  |
| SOX6 | VFIB | Colorectum | FAP | MCTP2,WNT5B,FENDRR, etc. | 3.37e-01 | |
| ∗The dot plots of a searched regulon are shown for all cell subpopulations in each disease state of each tissue based on the regulon specific score inferred using pySCENIC and by calculating the average expression. |
| Page: 1 2 3 4 5 |
Top |
Somatic mutation of malignant transformation related genes |
| Annotation of somatic variants for genes involved in malignant transformation |
| Hugo Symbol | Variant Class | Variant Classification | dbSNP RS | HGVSc | HGVSp | HGVSp Short | SWISSPROT | BIOTYPE | SIFT | PolyPhen | Tumor Sample Barcode | Tissue | Histology | Sex | Age | Stage | Therapy Types | Drugs | Outcome |
| SOX6 | SNV | Missense_Mutation | c.1907N>A | p.Gly636Glu | p.G636E | P35712 | protein_coding | deleterious(0) | probably_damaging(1) | TCGA-A2-A04Y-01 | Breast | breast invasive carcinoma | Female | <65 | I/II | Chemotherapy | cytoxan | SD | |
| SOX6 | SNV | Missense_Mutation | novel | c.1099N>C | p.Glu367Gln | p.E367Q | P35712 | protein_coding | tolerated(0.95) | benign(0) | TCGA-A2-A0YD-01 | Breast | breast invasive carcinoma | Female | <65 | I/II | Chemotherapy | cytoxan | SD |
| SOX6 | SNV | Missense_Mutation | novel | c.1818N>A | p.Asn606Lys | p.N606K | P35712 | protein_coding | deleterious(0) | probably_damaging(0.999) | TCGA-AC-A4ZE-01 | Breast | breast invasive carcinoma | Female | <65 | I/II | Unknown | Unknown | SD |
| SOX6 | SNV | Missense_Mutation | novel | c.1501N>G | p.Gln501Glu | p.Q501E | P35712 | protein_coding | deleterious(0.01) | benign(0.341) | TCGA-BH-A0B6-01 | Breast | breast invasive carcinoma | Female | <65 | I/II | Unknown | Unknown | SD |
| SOX6 | SNV | Missense_Mutation | c.1963N>A | p.Ala655Thr | p.A655T | P35712 | protein_coding | deleterious(0) | probably_damaging(0.967) | TCGA-D8-A1X9-01 | Breast | breast invasive carcinoma | Female | >=65 | I/II | Chemotherapy | adriamycin+cyclophosphamide | SD | |
| SOX6 | SNV | Missense_Mutation | c.137N>C | p.Ile46Thr | p.I46T | P35712 | protein_coding | tolerated_low_confidence(0.16) | benign(0.047) | TCGA-D8-A1XK-01 | Breast | breast invasive carcinoma | Female | <65 | I/II | Chemotherapy | doxorubicine+cyclophosphamide | SD | |
| SOX6 | SNV | Missense_Mutation | novel | c.1567N>A | p.Asp523Asn | p.D523N | P35712 | protein_coding | tolerated(0.08) | possibly_damaging(0.466) | TCGA-GM-A5PV-01 | Breast | breast invasive carcinoma | Female | <65 | I/II | Chemotherapy | taxotere | CR |
| SOX6 | SNV | Missense_Mutation | novel | c.747N>G | p.His249Gln | p.H249Q | P35712 | protein_coding | deleterious(0.02) | benign(0.012) | TCGA-OL-A5D7-01 | Breast | breast invasive carcinoma | Female | >=65 | I/II | Chemotherapy | cytoxan | CR |
| SOX6 | SNV | Missense_Mutation | c.1781N>T | p.Arg594Leu | p.R594L | P35712 | protein_coding | deleterious(0.01) | probably_damaging(0.992) | TCGA-UU-A93S-01 | Breast | breast invasive carcinoma | Female | <65 | III/IV | Unknown | Unknown | PD | |
| SOX6 | insertion | Frame_Shift_Ins | novel | c.1470_1471insT | p.Gly491TrpfsTer33 | p.G491Wfs*33 | P35712 | protein_coding | TCGA-AN-A0AK-01 | Breast | breast invasive carcinoma | Female | >=65 | I/II | Unknown | Unknown | SD |
| Page: 1 2 3 4 5 6 7 8 9 10 11 |
Top |
Related drugs of malignant transformation related genes |
| Identification of chemicals and drugs interact with genes involved in malignant transfromation |
| (DGIdb 4.0) |
| Entrez ID | Symbol | Category | Interaction Types | Drug Claim Name | Drug Name | PMIDs |
| Page: 1 |

Copyright 2023-Present -The University of Texas Health Science Center at Houston |