
|
|||||
|
 | |
| |
| |
| |
| |
| |
|
Gene: SNX27 |
Gene summary for SNX27 |
| Gene information | Species | Human | Gene symbol | SNX27 | Gene ID | 81609 |
| Gene name | sorting nexin 27 | |
| Gene Alias | MRT1 | |
| Cytomap | 1q21.3 | |
| Gene Type | protein-coding | GO ID | GO:0001767 | UniProtAcc | Q96L92 |
Top |
Malignant transformation analysis |
| Identification of the aberrant gene expression in precancerous and cancerous lesions by comparing the gene expression of stem-like cells in diseased tissues with normal stem cells |
| Entrez ID | Symbol | Replicates | Species | Organ | Tissue | Adj P-value | Log2FC | Malignancy |
| 81609 | SNX27 | P52T-E | Human | Esophagus | ESCC | 1.17e-25 | 4.12e-01 | 0.1555 |
| 81609 | SNX27 | P54T-E | Human | Esophagus | ESCC | 2.34e-09 | 2.76e-01 | 0.0975 |
| 81609 | SNX27 | P56T-E | Human | Esophagus | ESCC | 2.82e-05 | 6.42e-01 | 0.1613 |
| 81609 | SNX27 | P57T-E | Human | Esophagus | ESCC | 6.79e-11 | 2.41e-01 | 0.0926 |
| 81609 | SNX27 | P61T-E | Human | Esophagus | ESCC | 1.06e-13 | 2.93e-01 | 0.099 |
| 81609 | SNX27 | P62T-E | Human | Esophagus | ESCC | 2.04e-20 | 3.83e-01 | 0.1302 |
| 81609 | SNX27 | P65T-E | Human | Esophagus | ESCC | 3.44e-14 | 2.48e-01 | 0.0978 |
| 81609 | SNX27 | P74T-E | Human | Esophagus | ESCC | 2.07e-13 | 3.97e-01 | 0.1479 |
| 81609 | SNX27 | P75T-E | Human | Esophagus | ESCC | 4.51e-20 | 3.60e-01 | 0.1125 |
| 81609 | SNX27 | P76T-E | Human | Esophagus | ESCC | 7.69e-11 | 2.53e-01 | 0.1207 |
| 81609 | SNX27 | P79T-E | Human | Esophagus | ESCC | 9.74e-09 | 1.48e-01 | 0.1154 |
| 81609 | SNX27 | P80T-E | Human | Esophagus | ESCC | 9.10e-18 | 4.79e-01 | 0.155 |
| 81609 | SNX27 | P82T-E | Human | Esophagus | ESCC | 4.79e-03 | 3.41e-01 | 0.1072 |
| 81609 | SNX27 | P83T-E | Human | Esophagus | ESCC | 1.12e-19 | 5.30e-01 | 0.1738 |
| 81609 | SNX27 | P89T-E | Human | Esophagus | ESCC | 6.28e-08 | 6.14e-01 | 0.1752 |
| 81609 | SNX27 | P91T-E | Human | Esophagus | ESCC | 2.32e-12 | 9.71e-01 | 0.1828 |
| 81609 | SNX27 | P107T-E | Human | Esophagus | ESCC | 5.13e-22 | 5.82e-01 | 0.171 |
| 81609 | SNX27 | P126T-E | Human | Esophagus | ESCC | 1.22e-07 | 6.53e-01 | 0.1125 |
| 81609 | SNX27 | P127T-E | Human | Esophagus | ESCC | 1.42e-22 | 4.06e-01 | 0.0826 |
| 81609 | SNX27 | P128T-E | Human | Esophagus | ESCC | 5.63e-26 | 6.71e-01 | 0.1241 |
| Page: 1 2 3 4 5 6 |
| Tissue | Expression Dynamics | Abbreviation |
| Esophagus | 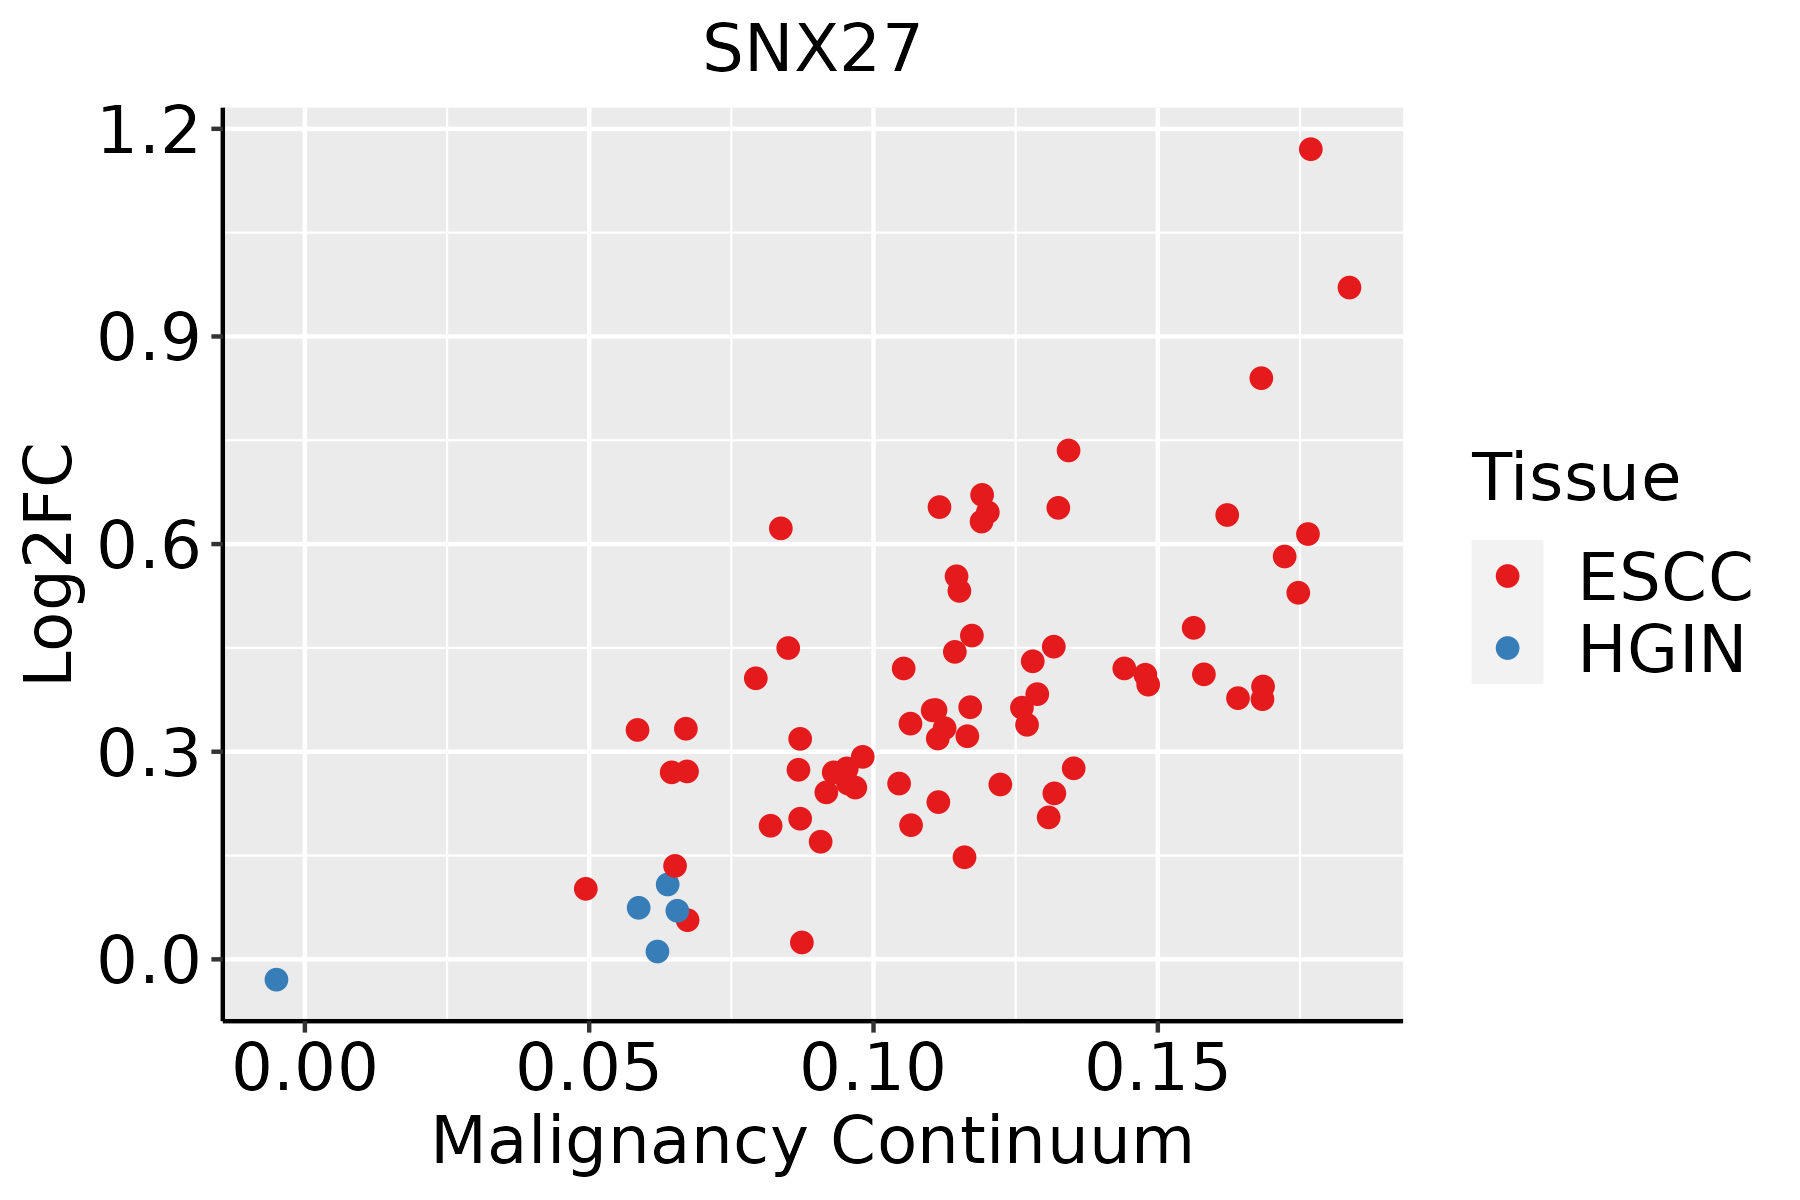 | ESCC: Esophageal squamous cell carcinoma |
| HGIN: High-grade intraepithelial neoplasias | ||
| LGIN: Low-grade intraepithelial neoplasias | ||
| Liver | 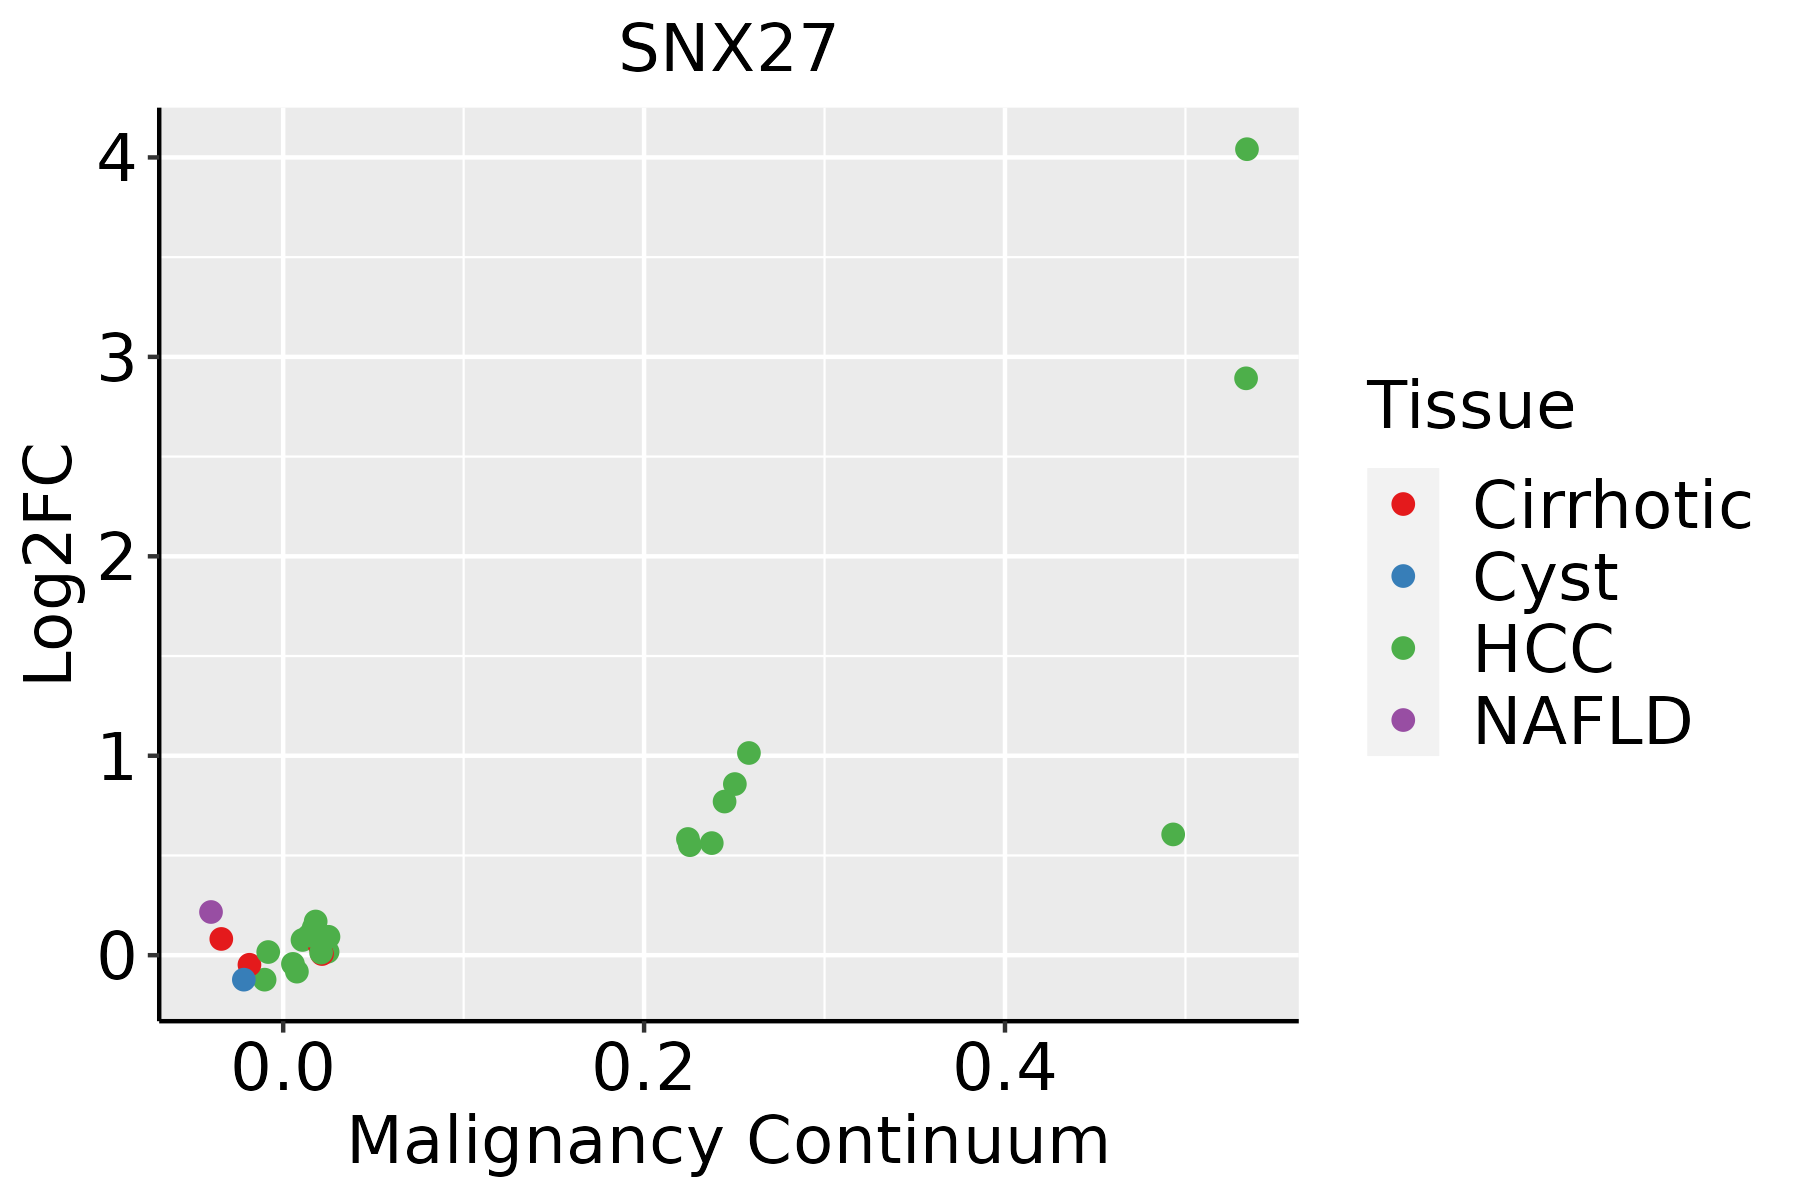 | HCC: Hepatocellular carcinoma |
| NAFLD: Non-alcoholic fatty liver disease | ||
| Oral Cavity |  | EOLP: Erosive Oral lichen planus |
| LP: leukoplakia | ||
| NEOLP: Non-erosive oral lichen planus | ||
| OSCC: Oral squamous cell carcinoma | ||
| Skin | 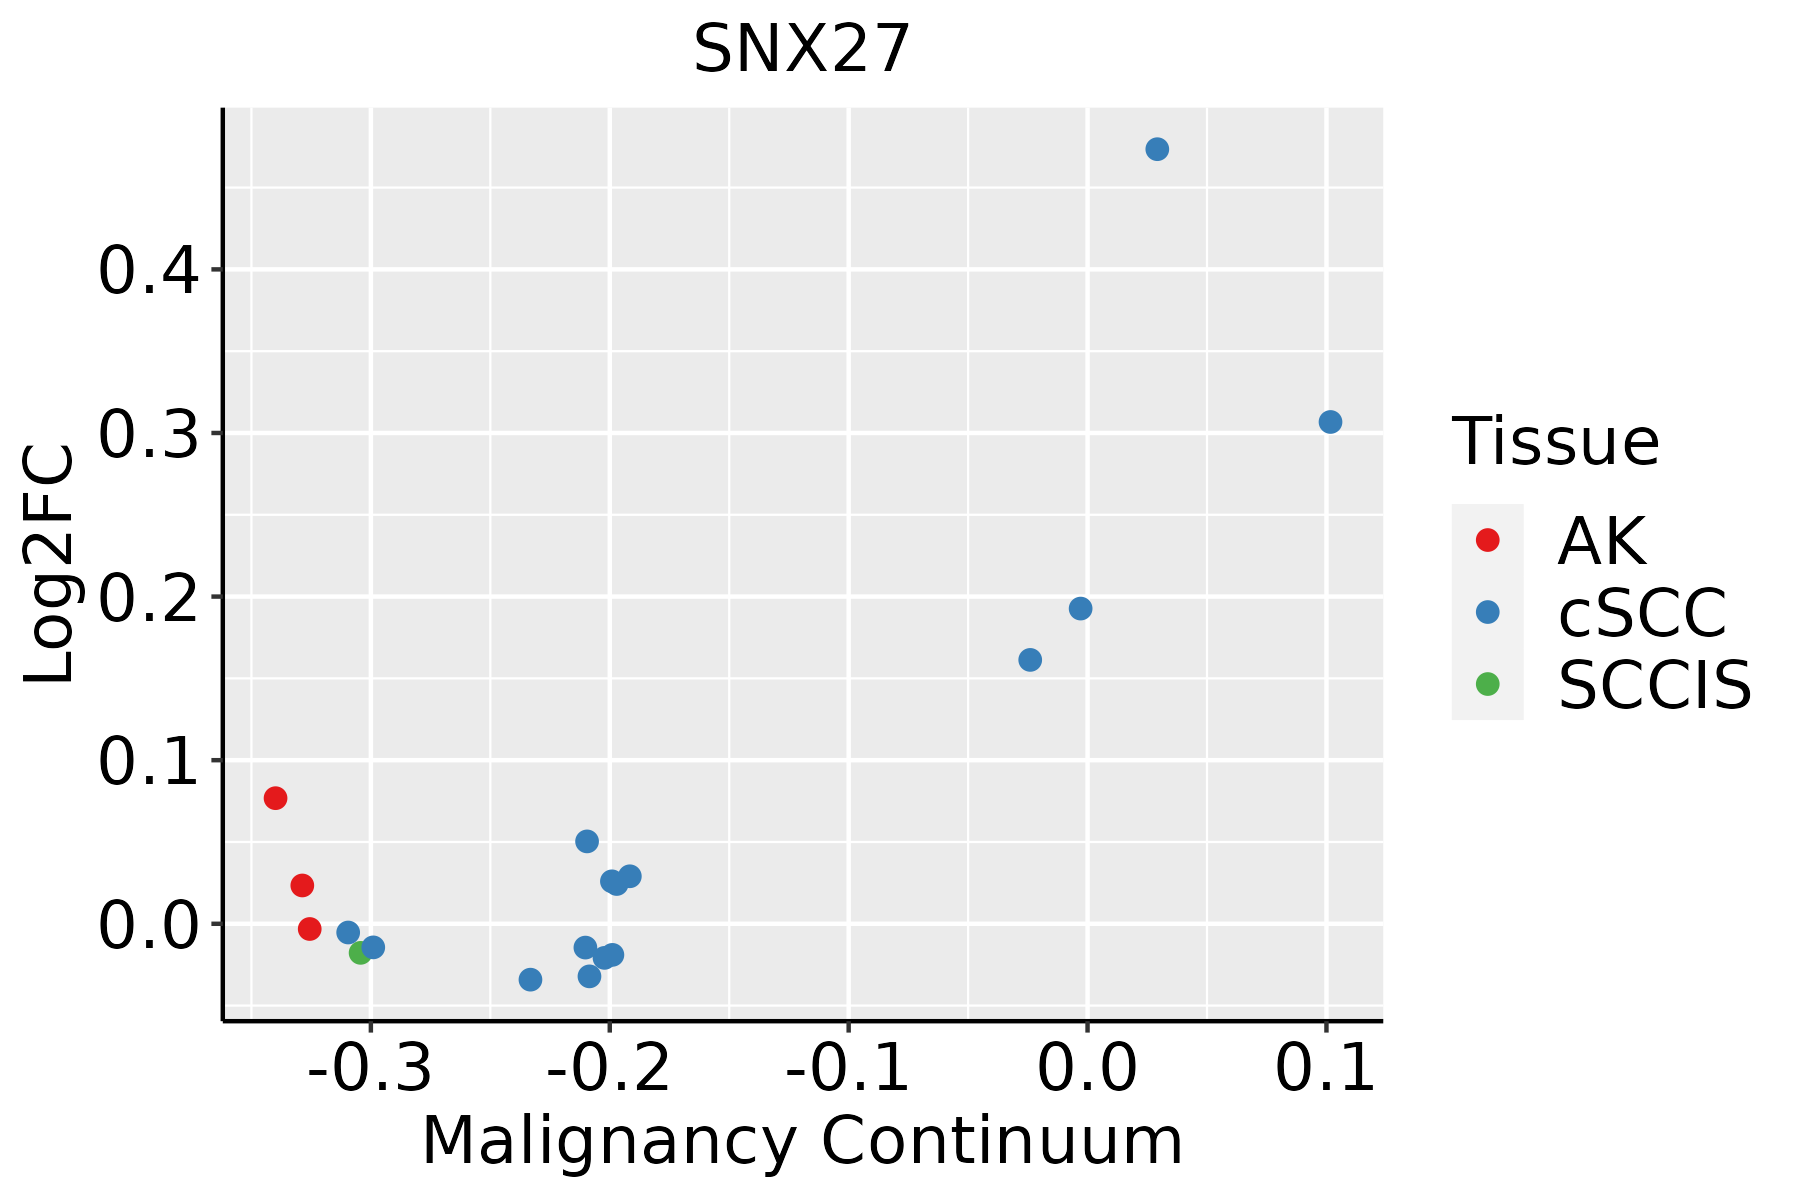 | AK: Actinic keratosis |
| cSCC: Cutaneous squamous cell carcinoma | ||
| SCCIS:squamous cell carcinoma in situ | ||
| Thyroid | 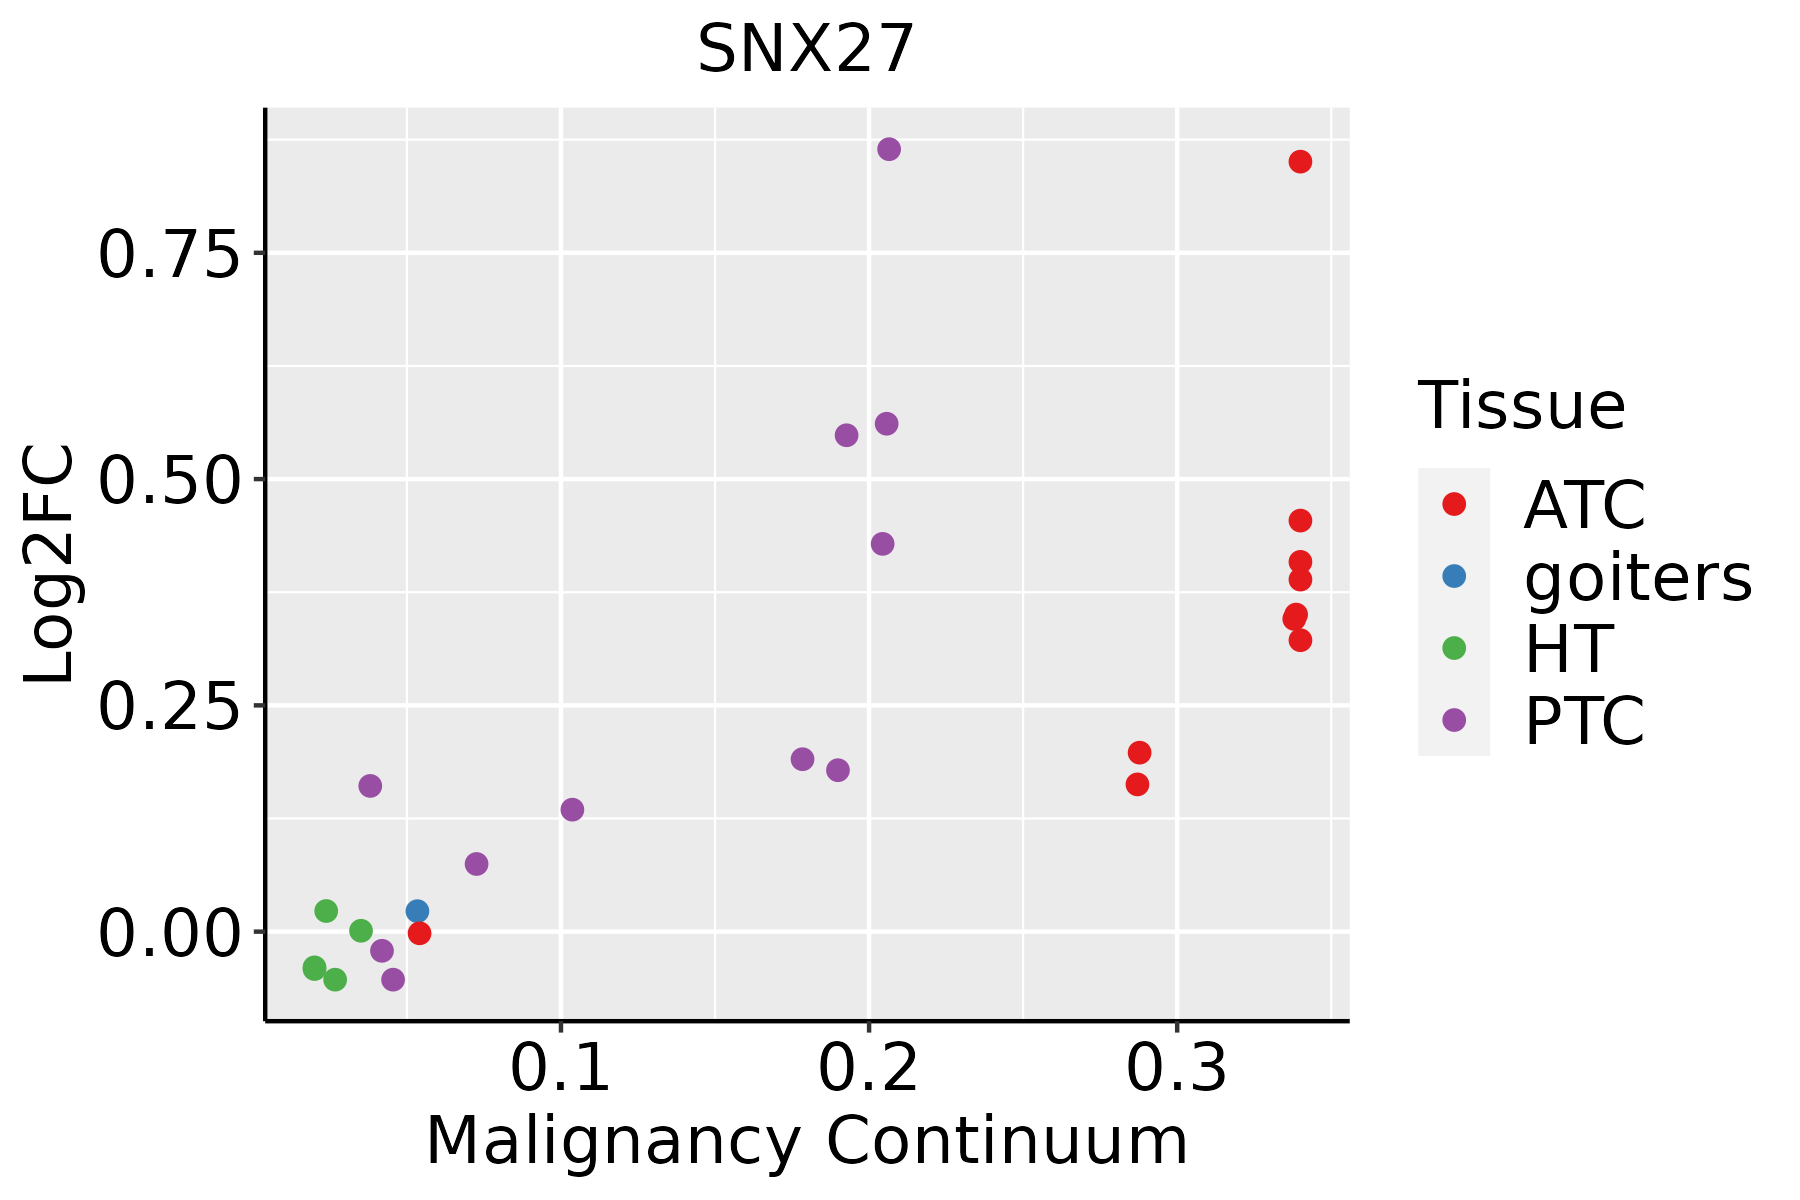 | ATC: Anaplastic thyroid cancer |
| HT: Hashimoto's thyroiditis | ||
| PTC: Papillary thyroid cancer |
| ∗log2FC in expression of this searched gene in stem-like cells from each diseased tissue sample relative to stem-like cells in normal samples in each tissue plotted against the malignancy continuum. Samples are colored based on if they are from different disease stage. |
Top |
Malignant transformation related pathway analysis |
| Find out the enriched GO biological processes and KEGG pathways involved in transition from healthy to precancer to cancer |
| Tissue | Disease Stage | Enriched GO biological Processes |
| Colorectum | AD |  |
| Colorectum | SER |  |
| Colorectum | MSS |  |
| Colorectum | MSI-H |  |
| Colorectum | FAP |  |
| ∗Top 15 enriched GO BP terms are showed in the bar plot of each disease state in each tissue. Each row represents a significant GO biological process which is colored according to the -log10(p.adjust). |
| Page: 1 2 3 4 5 6 7 8 9 |
| GO ID | Tissue | Disease Stage | Description | Gene Ratio | Bg Ratio | pvalue | p.adjust | Count |
| GO:001619715 | Esophagus | ESCC | endosomal transport | 168/8552 | 230/18723 | 2.28e-17 | 1.93e-15 | 168 |
| GO:000703417 | Esophagus | ESCC | vacuolar transport | 119/8552 | 157/18723 | 1.16e-14 | 6.30e-13 | 119 |
| GO:009887615 | Esophagus | ESCC | vesicle-mediated transport to the plasma membrane | 99/8552 | 136/18723 | 1.13e-10 | 3.39e-09 | 99 |
| GO:000716320 | Esophagus | ESCC | establishment or maintenance of cell polarity | 143/8552 | 218/18723 | 2.05e-09 | 4.65e-08 | 143 |
| GO:00070419 | Esophagus | ESCC | lysosomal transport | 83/8552 | 114/18723 | 3.52e-09 | 7.41e-08 | 83 |
| GO:003001018 | Esophagus | ESCC | establishment of cell polarity | 96/8552 | 143/18723 | 1.69e-07 | 2.67e-06 | 96 |
| GO:00324565 | Esophagus | ESCC | endocytic recycling | 51/8552 | 73/18723 | 2.47e-05 | 2.10e-04 | 51 |
| GO:00083333 | Esophagus | ESCC | endosome to lysosome transport | 40/8552 | 55/18723 | 4.27e-05 | 3.42e-04 | 40 |
| GO:001619721 | Liver | HCC | endosomal transport | 154/7958 | 230/18723 | 4.74e-14 | 2.95e-12 | 154 |
| GO:000703421 | Liver | HCC | vacuolar transport | 108/7958 | 157/18723 | 2.22e-11 | 8.69e-10 | 108 |
| GO:009887621 | Liver | HCC | vesicle-mediated transport to the plasma membrane | 92/7958 | 136/18723 | 2.57e-09 | 7.07e-08 | 92 |
| GO:000716322 | Liver | HCC | establishment or maintenance of cell polarity | 133/7958 | 218/18723 | 2.48e-08 | 5.73e-07 | 133 |
| GO:000704121 | Liver | HCC | lysosomal transport | 76/7958 | 114/18723 | 1.56e-07 | 2.88e-06 | 76 |
| GO:00324562 | Liver | HCC | endocytic recycling | 48/7958 | 73/18723 | 5.07e-05 | 4.83e-04 | 48 |
| GO:003001022 | Liver | HCC | establishment of cell polarity | 82/7958 | 143/18723 | 2.38e-04 | 1.79e-03 | 82 |
| GO:00083331 | Liver | HCC | endosome to lysosome transport | 35/7958 | 55/18723 | 1.26e-03 | 6.92e-03 | 35 |
| GO:00161979 | Oral cavity | OSCC | endosomal transport | 141/7305 | 230/18723 | 5.40e-12 | 2.06e-10 | 141 |
| GO:000703410 | Oral cavity | OSCC | vacuolar transport | 103/7305 | 157/18723 | 1.25e-11 | 4.44e-10 | 103 |
| GO:000716318 | Oral cavity | OSCC | establishment or maintenance of cell polarity | 129/7305 | 218/18723 | 1.16e-09 | 2.86e-08 | 129 |
| GO:00070418 | Oral cavity | OSCC | lysosomal transport | 69/7305 | 114/18723 | 2.62e-06 | 3.26e-05 | 69 |
| Page: 1 2 3 |
| Pathway ID | Tissue | Disease Stage | Description | Gene Ratio | Bg Ratio | pvalue | p.adjust | qvalue | Count |
| Page: 1 |
Top |
Cell-cell communication analysis |
| Identification of potential cell-cell interactions between two cell types and their ligand-receptor pairs for different disease states |
| Ligand | Receptor | LRpair | Pathway | Tissue | Disease Stage |
| Page: 1 |
Top |
Single-cell gene regulatory network inference analysis |
| Find out the significant the regulons (TFs) and the target genes of each regulon across cell types for different disease states |
| TF | Cell Type | Tissue | Disease Stage | Target Gene | RSS | Regulon Activity |
| ∗The dot plots of a searched regulon are shown for all cell subpopulations in each disease state of each tissue based on the regulon specific score inferred using pySCENIC and by calculating the average expression. |
| Page: 1 |
Top |
Somatic mutation of malignant transformation related genes |
| Annotation of somatic variants for genes involved in malignant transformation |
| Hugo Symbol | Variant Class | Variant Classification | dbSNP RS | HGVSc | HGVSp | HGVSp Short | SWISSPROT | BIOTYPE | SIFT | PolyPhen | Tumor Sample Barcode | Tissue | Histology | Sex | Age | Stage | Therapy Types | Drugs | Outcome |
| SNX27 | SNV | Missense_Mutation | novel | c.1045N>T | p.Ala349Ser | p.A349S | Q96L92 | protein_coding | tolerated(0.1) | possibly_damaging(0.802) | TCGA-A2-A0YK-01 | Breast | breast invasive carcinoma | Female | <65 | I/II | Chemotherapy | cytoxan | SD |
| SNX27 | SNV | Missense_Mutation | novel | c.320N>G | p.Val107Gly | p.V107G | Q96L92 | protein_coding | deleterious(0.01) | benign(0.188) | TCGA-OL-A97C-01 | Breast | breast invasive carcinoma | Female | >=65 | I/II | Unknown | Unknown | PD |
| SNX27 | SNV | Missense_Mutation | novel | c.1095A>C | p.Glu365Asp | p.E365D | Q96L92 | protein_coding | tolerated(0.55) | benign(0) | TCGA-2W-A8YY-01 | Cervix | cervical & endocervical cancer | Female | <65 | I/II | Chemotherapy | cisplatin | CR |
| SNX27 | SNV | Missense_Mutation | c.1303N>C | p.Asp435His | p.D435H | Q96L92 | protein_coding | deleterious(0) | probably_damaging(0.969) | TCGA-C5-A1MH-01 | Cervix | cervical & endocervical cancer | Female | >=65 | III/IV | Chemotherapy | cisplatin | PD | |
| SNX27 | SNV | Missense_Mutation | novel | c.707N>A | p.Arg236His | p.R236H | Q96L92 | protein_coding | deleterious(0) | probably_damaging(0.999) | TCGA-EA-A410-01 | Cervix | cervical & endocervical cancer | Female | <65 | I/II | Unknown | Unknown | SD |
| SNX27 | SNV | Missense_Mutation | c.1043N>T | p.Ser348Leu | p.S348L | Q96L92 | protein_coding | deleterious(0) | benign(0.331) | TCGA-EA-A43B-01 | Cervix | cervical & endocervical cancer | Female | <65 | I/II | Chemotherapy | cisplatin | CR | |
| SNX27 | SNV | Missense_Mutation | c.466N>A | p.Asp156Asn | p.D156N | Q96L92 | protein_coding | deleterious(0) | possibly_damaging(0.614) | TCGA-JW-A852-01 | Cervix | cervical & endocervical cancer | Female | <65 | I/II | Unknown | Unknown | PD | |
| SNX27 | SNV | Missense_Mutation | c.418N>A | p.Ala140Thr | p.A140T | Q96L92 | protein_coding | deleterious(0.03) | benign(0.072) | TCGA-AA-3833-01 | Colorectum | colon adenocarcinoma | Female | <65 | I/II | Unknown | Unknown | SD | |
| SNX27 | SNV | Missense_Mutation | rs752336635 | c.373G>A | p.Glu125Lys | p.E125K | Q96L92 | protein_coding | tolerated(0.13) | benign(0.017) | TCGA-AA-3977-01 | Colorectum | colon adenocarcinoma | Male | >=65 | I/II | Unknown | Unknown | SD |
| SNX27 | SNV | Missense_Mutation | c.1524N>A | p.Asn508Lys | p.N508K | Q96L92 | protein_coding | tolerated(0.85) | benign(0.003) | TCGA-AD-6895-01 | Colorectum | colon adenocarcinoma | Male | >=65 | III/IV | Unknown | Unknown | SD |
| Page: 1 2 3 4 5 6 |
Top |
Related drugs of malignant transformation related genes |
| Identification of chemicals and drugs interact with genes involved in malignant transfromation |
| (DGIdb 4.0) |
| Entrez ID | Symbol | Category | Interaction Types | Drug Claim Name | Drug Name | PMIDs |
| Page: 1 |

Copyright 2023-Present -The University of Texas Health Science Center at Houston |