
|
|||||
|
 | |
| |
| |
| |
| |
| |
|
Gene: SMIM22 |
Gene summary for SMIM22 |
| Gene information | Species | Human | Gene symbol | SMIM22 | Gene ID | 440335 |
| Gene name | small integral membrane protein 22 | |
| Gene Alias | CASIMO1 | |
| Cytomap | 16p13.3 | |
| Gene Type | protein-coding | GO ID | GO:0006928 | UniProtAcc | A0A1U9AC72 |
Top |
Malignant transformation analysis |
| Identification of the aberrant gene expression in precancerous and cancerous lesions by comparing the gene expression of stem-like cells in diseased tissues with normal stem cells |
| Entrez ID | Symbol | Replicates | Species | Organ | Tissue | Adj P-value | Log2FC | Malignancy |
| 440335 | SMIM22 | L1 | Human | Cervix | CC | 4.46e-02 | 3.24e-01 | 0.0802 |
| 440335 | SMIM22 | T1 | Human | Cervix | CC | 5.31e-14 | 4.89e-01 | 0.0918 |
| 440335 | SMIM22 | T2 | Human | Cervix | CC | 4.16e-10 | 5.72e-01 | 0.0709 |
| 440335 | SMIM22 | T3 | Human | Cervix | CC | 4.01e-29 | 5.75e-01 | 0.1389 |
| 440335 | SMIM22 | HTA11_3410_2000001011 | Human | Colorectum | AD | 5.48e-04 | 2.05e-01 | 0.0155 |
| 440335 | SMIM22 | HTA11_2487_2000001011 | Human | Colorectum | SER | 5.01e-32 | 1.17e+00 | -0.1808 |
| 440335 | SMIM22 | HTA11_1938_2000001011 | Human | Colorectum | AD | 3.34e-09 | 5.47e-01 | -0.0811 |
| 440335 | SMIM22 | HTA11_78_2000001011 | Human | Colorectum | AD | 2.67e-02 | 1.21e-01 | -0.1088 |
| 440335 | SMIM22 | HTA11_347_2000001011 | Human | Colorectum | AD | 2.00e-30 | 6.96e-01 | -0.1954 |
| 440335 | SMIM22 | HTA11_411_2000001011 | Human | Colorectum | SER | 3.34e-13 | 1.71e+00 | -0.2602 |
| 440335 | SMIM22 | HTA11_2112_2000001011 | Human | Colorectum | SER | 3.63e-21 | 1.78e+00 | -0.2196 |
| 440335 | SMIM22 | HTA11_3361_2000001011 | Human | Colorectum | AD | 6.94e-16 | 7.64e-01 | -0.1207 |
| 440335 | SMIM22 | HTA11_83_2000001011 | Human | Colorectum | SER | 1.52e-14 | 8.08e-01 | -0.1526 |
| 440335 | SMIM22 | HTA11_696_2000001011 | Human | Colorectum | AD | 1.01e-39 | 9.98e-01 | -0.1464 |
| 440335 | SMIM22 | HTA11_866_2000001011 | Human | Colorectum | AD | 1.29e-10 | 4.71e-01 | -0.1001 |
| 440335 | SMIM22 | HTA11_1391_2000001011 | Human | Colorectum | AD | 3.65e-30 | 9.16e-01 | -0.059 |
| 440335 | SMIM22 | HTA11_2992_2000001011 | Human | Colorectum | SER | 1.35e-14 | 1.08e+00 | -0.1706 |
| 440335 | SMIM22 | HTA11_5212_2000001011 | Human | Colorectum | AD | 7.01e-11 | 8.03e-01 | -0.2061 |
| 440335 | SMIM22 | HTA11_5216_2000001011 | Human | Colorectum | SER | 1.28e-03 | 5.53e-01 | -0.1462 |
| 440335 | SMIM22 | HTA11_546_2000001011 | Human | Colorectum | AD | 7.00e-07 | 4.87e-01 | -0.0842 |
| Page: 1 2 3 4 5 6 7 8 |
| Tissue | Expression Dynamics | Abbreviation |
| Breast |  | IDC: Invasive ductal carcinoma |
| DCIS: Ductal carcinoma in situ | ||
| Precancer(BRCA1-mut): Precancerous lesion from BRCA1 mutation carriers | ||
| Cervix |  | CC: Cervix cancer |
| HSIL_HPV: HPV-infected high-grade squamous intraepithelial lesions | ||
| N_HPV: HPV-infected normal cervix | ||
| Colorectum (GSE201348) |  | FAP: Familial adenomatous polyposis |
| CRC: Colorectal cancer | ||
| Colorectum (HTA11) |  | AD: Adenomas |
| SER: Sessile serrated lesions | ||
| MSI-H: Microsatellite-high colorectal cancer | ||
| MSS: Microsatellite stable colorectal cancer | ||
| Endometrium | 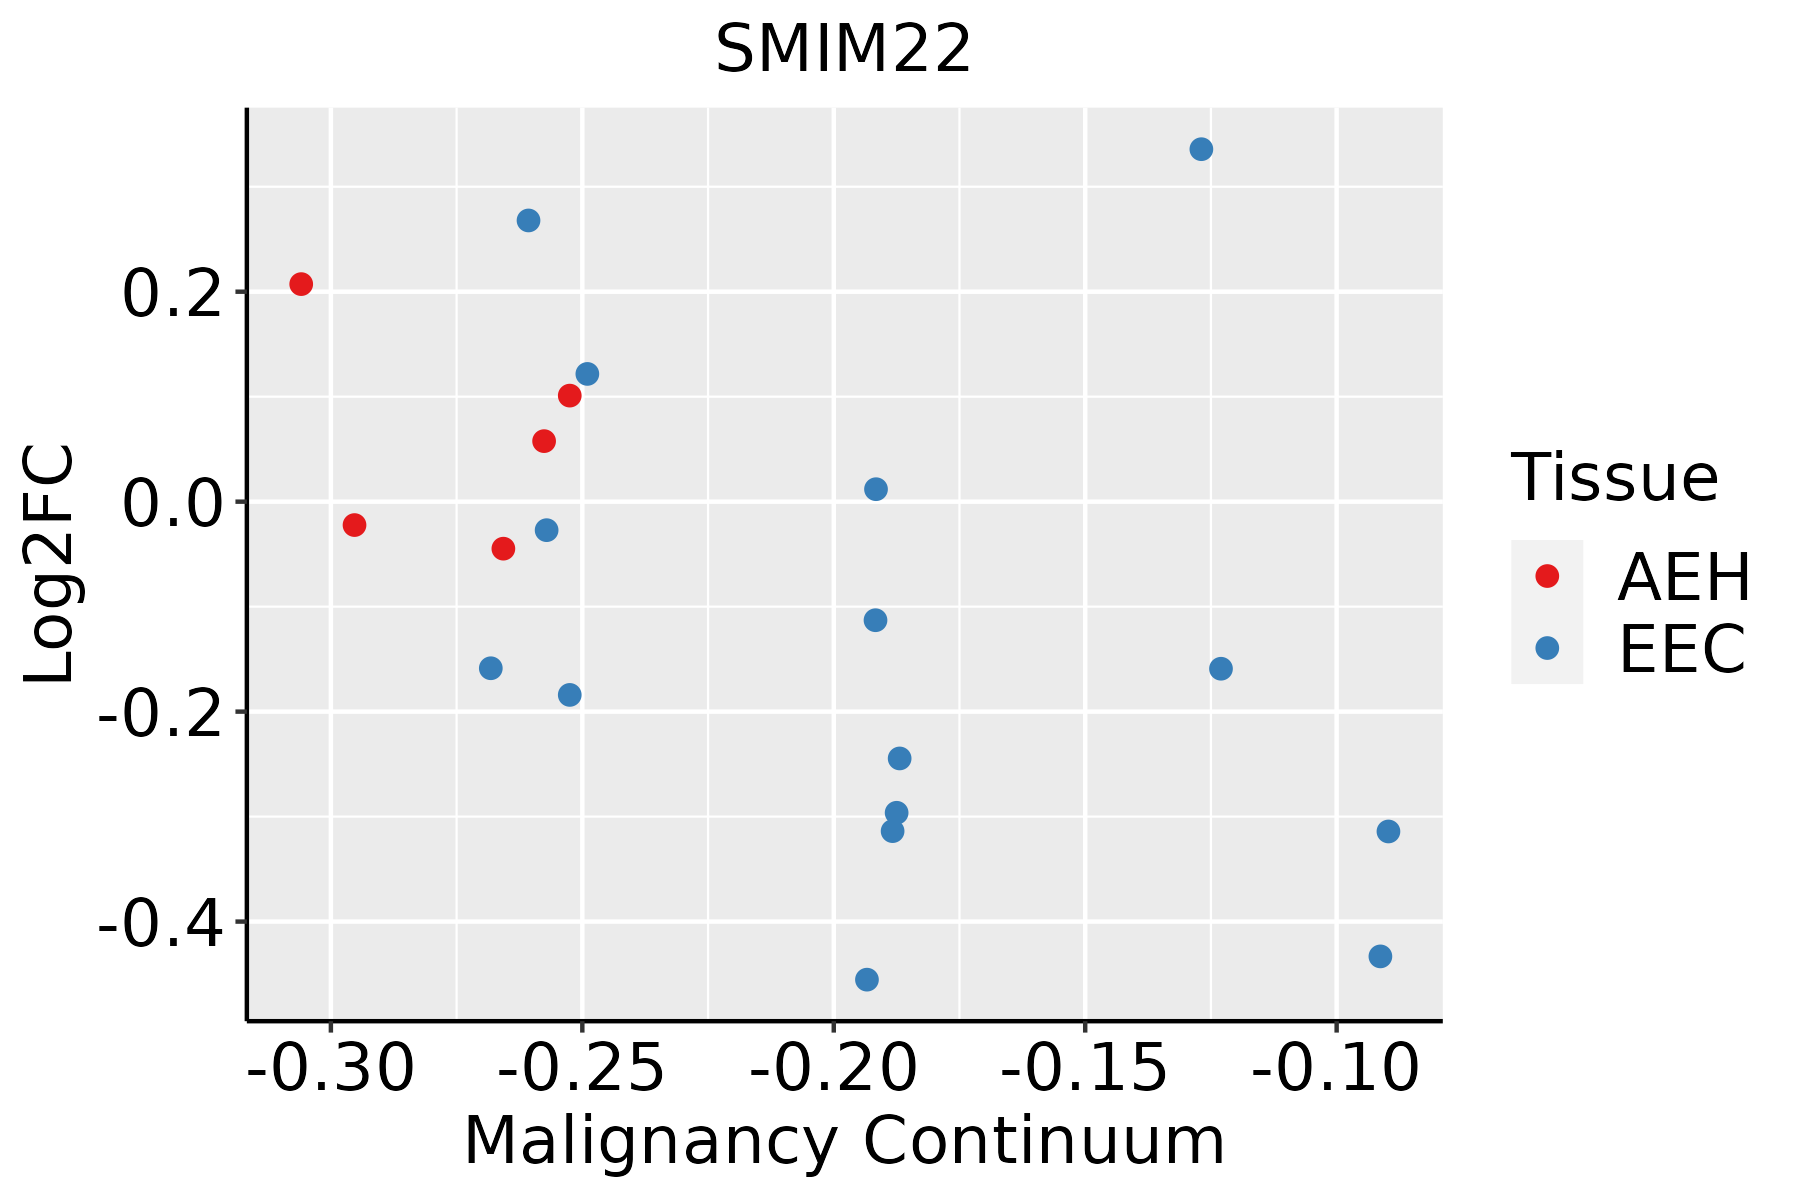 | AEH: Atypical endometrial hyperplasia |
| EEC: Endometrioid Cancer | ||
| Esophagus | 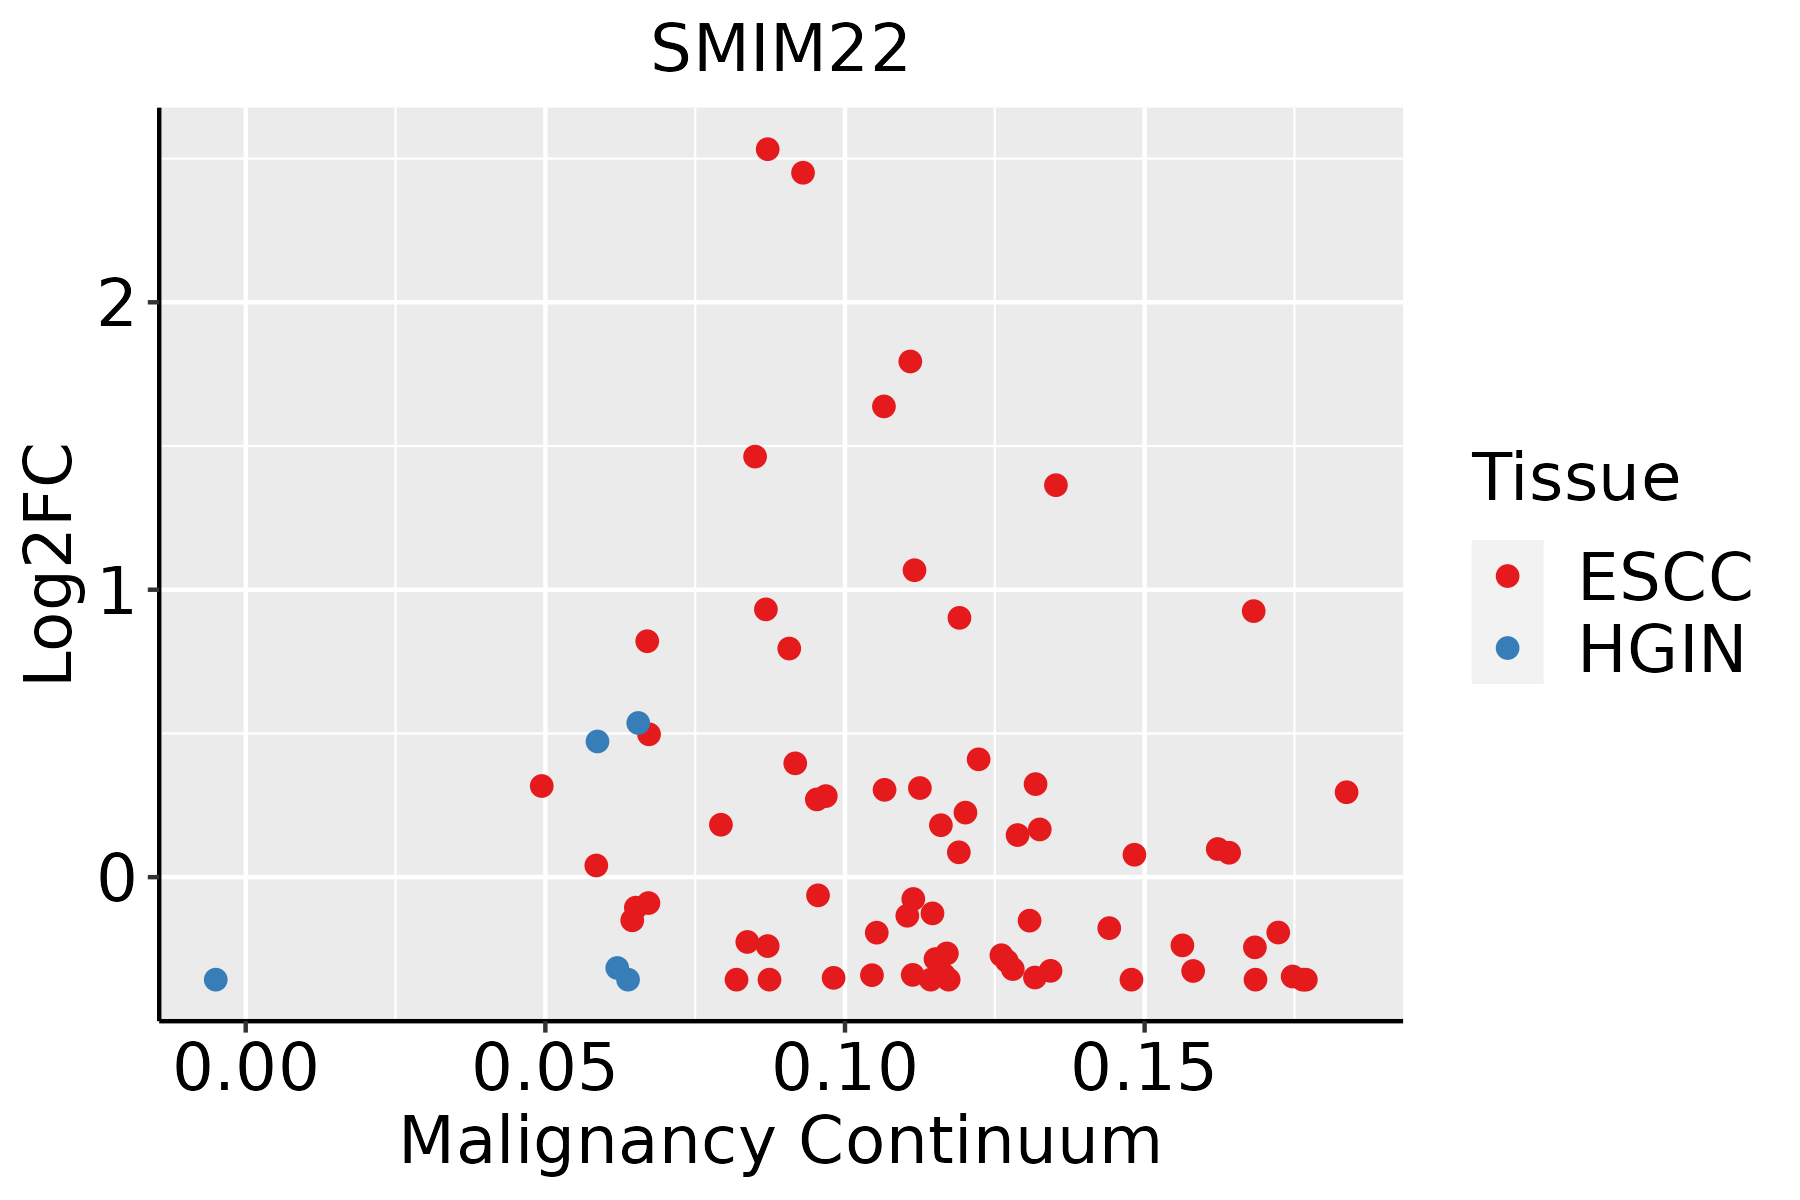 | ESCC: Esophageal squamous cell carcinoma |
| HGIN: High-grade intraepithelial neoplasias | ||
| LGIN: Low-grade intraepithelial neoplasias | ||
| GC | 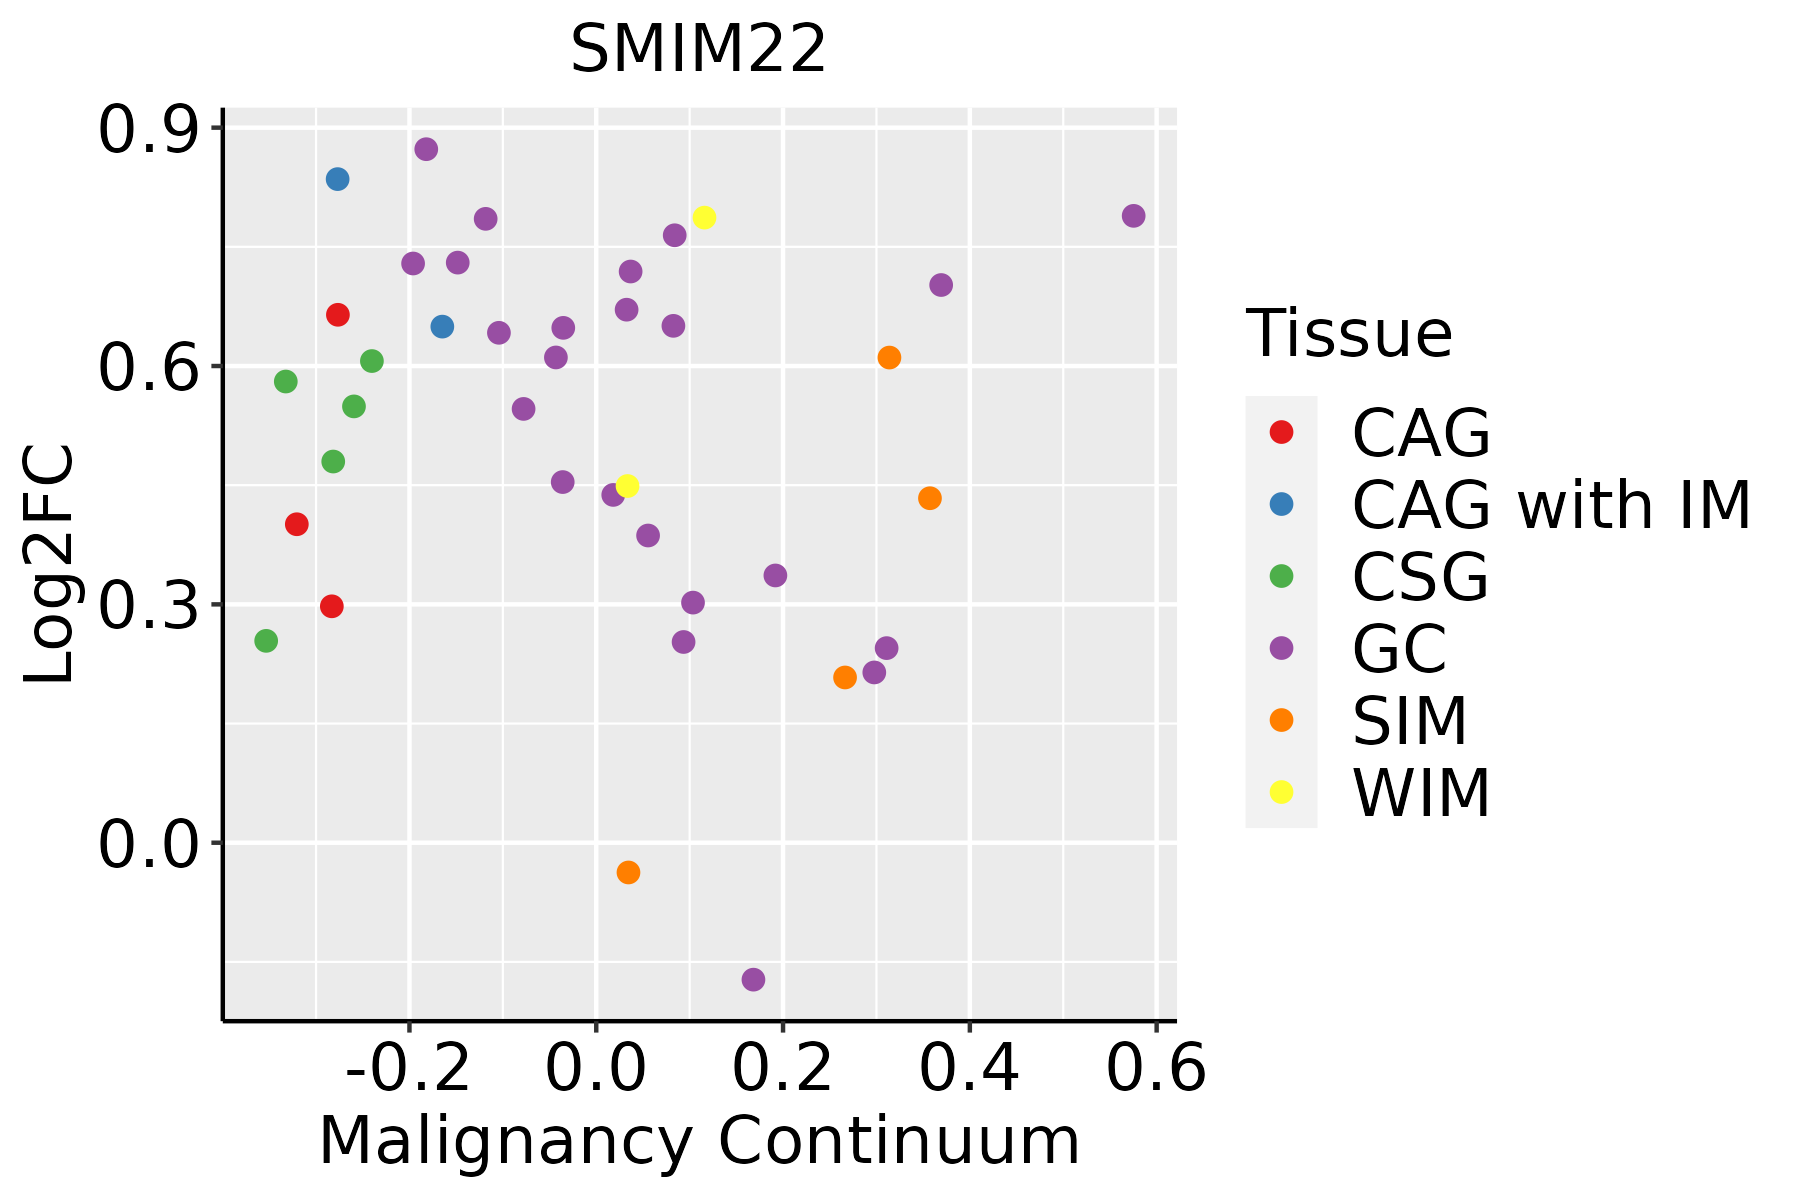 | CAG: Chronic atrophic gastritis |
| CAG with IM: Chronic atrophic gastritis with intestinal metaplasia | ||
| CSG: Chronic superficial gastritis | ||
| GC: Gastric cancer | ||
| SIM: Severe intestinal metaplasia | ||
| WIM: Wild intestinal metaplasia | ||
| Oral Cavity |  | EOLP: Erosive Oral lichen planus |
| LP: leukoplakia | ||
| NEOLP: Non-erosive oral lichen planus | ||
| OSCC: Oral squamous cell carcinoma | ||
| Prostate | 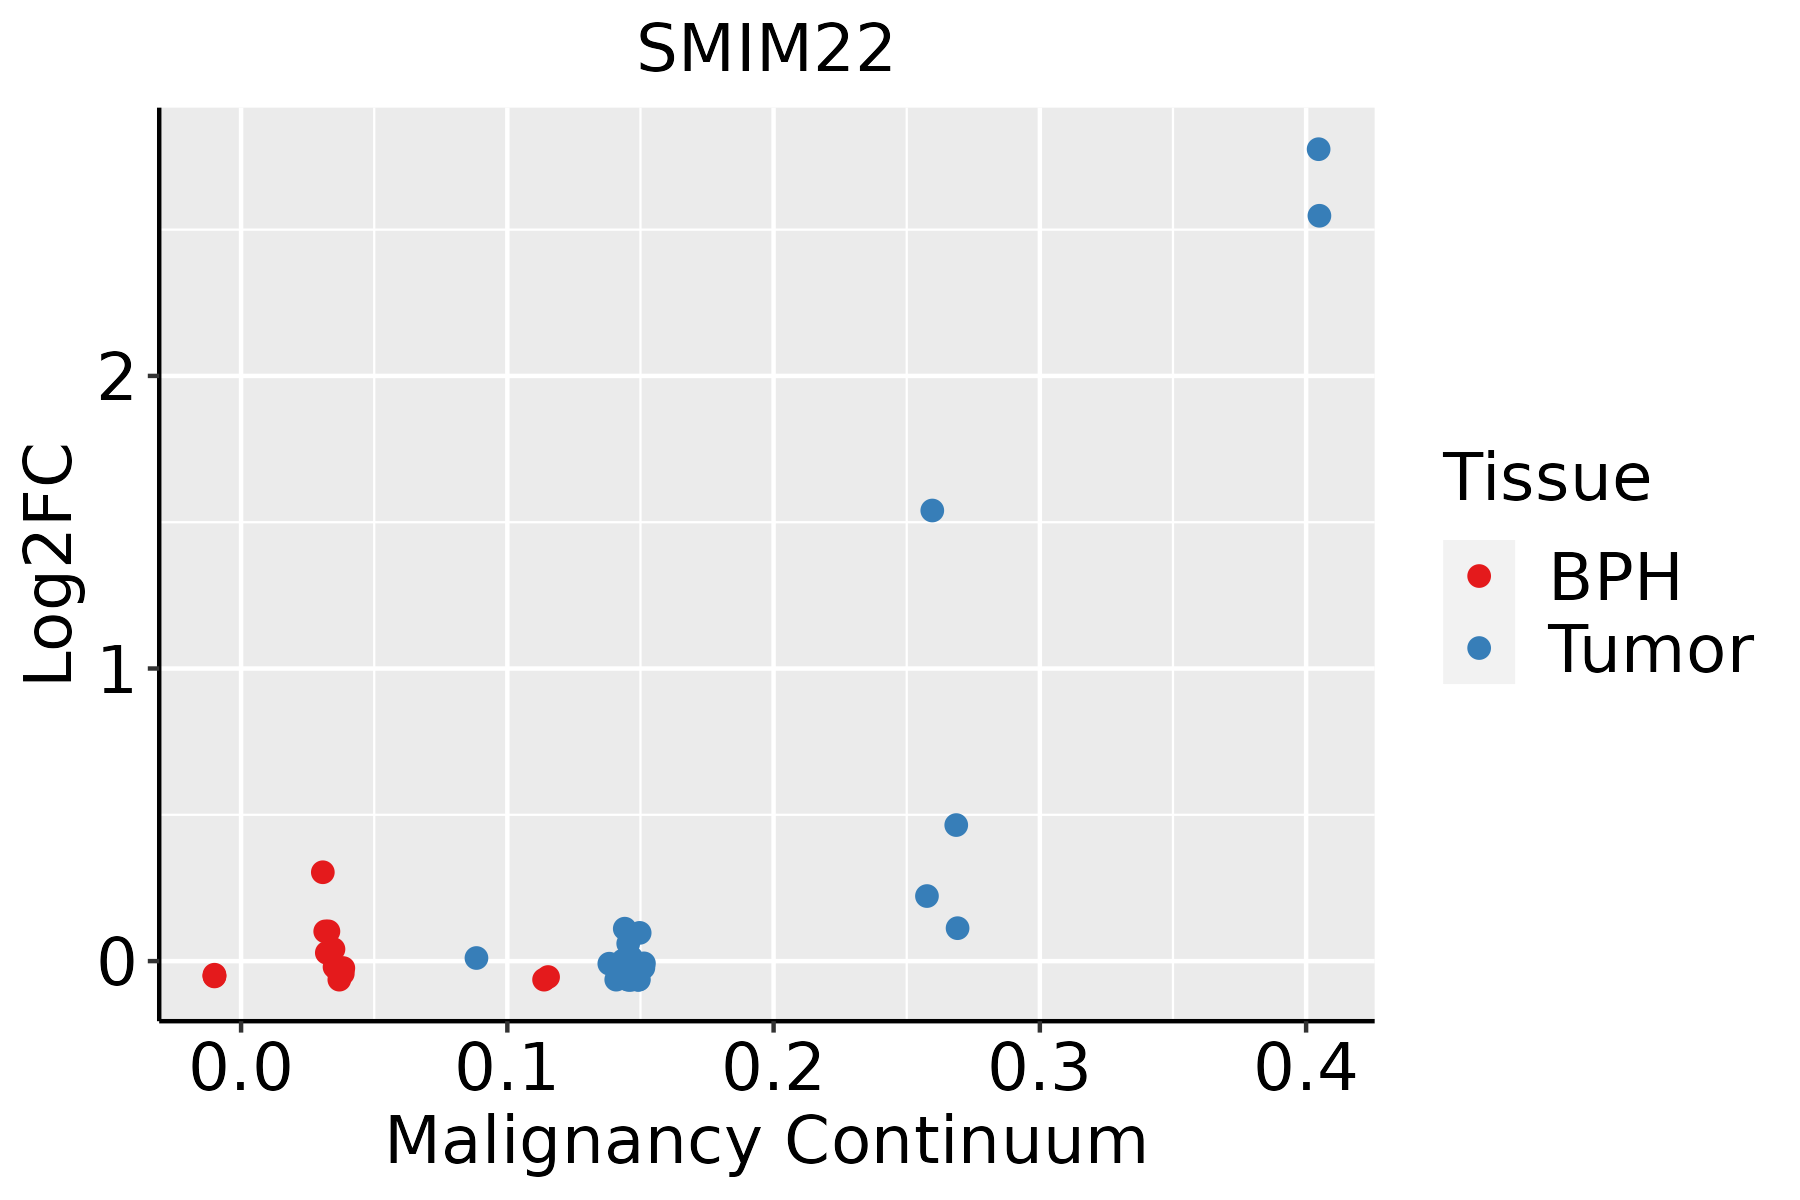 | BPH: Benign Prostatic Hyperplasia |
| ∗log2FC in expression of this searched gene in stem-like cells from each diseased tissue sample relative to stem-like cells in normal samples in each tissue plotted against the malignancy continuum. Samples are colored based on if they are from different disease stage. |
Top |
Malignant transformation related pathway analysis |
| Find out the enriched GO biological processes and KEGG pathways involved in transition from healthy to precancer to cancer |
| Tissue | Disease Stage | Enriched GO biological Processes |
| Colorectum | AD |  |
| Colorectum | SER |  |
| Colorectum | MSS |  |
| Colorectum | MSI-H |  |
| Colorectum | FAP |  |
| ∗Top 15 enriched GO BP terms are showed in the bar plot of each disease state in each tissue. Each row represents a significant GO biological process which is colored according to the -log10(p.adjust). |
| Page: 1 2 3 4 5 6 7 8 9 |
| GO ID | Tissue | Disease Stage | Description | Gene Ratio | Bg Ratio | pvalue | p.adjust | Count |
| GO:00512358 | Breast | Precancer | maintenance of location | 40/1080 | 327/18723 | 5.85e-06 | 1.71e-04 | 40 |
| GO:00329709 | Breast | Precancer | regulation of actin filament-based process | 42/1080 | 397/18723 | 1.11e-04 | 2.01e-03 | 42 |
| GO:00329569 | Breast | Precancer | regulation of actin cytoskeleton organization | 36/1080 | 358/18723 | 8.56e-04 | 9.88e-03 | 36 |
| GO:003297014 | Breast | IDC | regulation of actin filament-based process | 56/1434 | 397/18723 | 6.37e-06 | 1.99e-04 | 56 |
| GO:005123513 | Breast | IDC | maintenance of location | 48/1434 | 327/18723 | 9.90e-06 | 2.77e-04 | 48 |
| GO:003295614 | Breast | IDC | regulation of actin cytoskeleton organization | 48/1434 | 358/18723 | 1.03e-04 | 1.96e-03 | 48 |
| GO:003297024 | Breast | DCIS | regulation of actin filament-based process | 56/1390 | 397/18723 | 2.50e-06 | 8.74e-05 | 56 |
| GO:005123523 | Breast | DCIS | maintenance of location | 47/1390 | 327/18723 | 9.55e-06 | 2.56e-04 | 47 |
| GO:003295624 | Breast | DCIS | regulation of actin cytoskeleton organization | 48/1390 | 358/18723 | 4.82e-05 | 9.92e-04 | 48 |
| GO:003297010 | Cervix | CC | regulation of actin filament-based process | 96/2311 | 397/18723 | 4.00e-11 | 8.54e-09 | 96 |
| GO:003295610 | Cervix | CC | regulation of actin cytoskeleton organization | 86/2311 | 358/18723 | 5.90e-10 | 7.51e-08 | 86 |
| GO:00512359 | Cervix | CC | maintenance of location | 78/2311 | 327/18723 | 5.18e-09 | 4.92e-07 | 78 |
| GO:003295615 | Cervix | HSIL_HPV | regulation of actin cytoskeleton organization | 33/737 | 358/18723 | 5.61e-06 | 2.09e-04 | 33 |
| GO:003297015 | Cervix | HSIL_HPV | regulation of actin filament-based process | 35/737 | 397/18723 | 7.87e-06 | 2.81e-04 | 35 |
| GO:005123514 | Cervix | HSIL_HPV | maintenance of location | 26/737 | 327/18723 | 5.67e-04 | 8.04e-03 | 26 |
| GO:005123524 | Cervix | N_HPV | maintenance of location | 33/534 | 327/18723 | 3.40e-10 | 2.21e-07 | 33 |
| GO:003297025 | Cervix | N_HPV | regulation of actin filament-based process | 27/534 | 397/18723 | 3.03e-05 | 8.02e-04 | 27 |
| GO:003295625 | Cervix | N_HPV | regulation of actin cytoskeleton organization | 22/534 | 358/18723 | 6.55e-04 | 8.42e-03 | 22 |
| GO:0032970 | Colorectum | AD | regulation of actin filament-based process | 142/3918 | 397/18723 | 4.05e-12 | 5.90e-10 | 142 |
| GO:0032956 | Colorectum | AD | regulation of actin cytoskeleton organization | 127/3918 | 358/18723 | 1.03e-10 | 1.04e-08 | 127 |
| Page: 1 2 3 4 |
| Pathway ID | Tissue | Disease Stage | Description | Gene Ratio | Bg Ratio | pvalue | p.adjust | qvalue | Count |
| Page: 1 |
Top |
Cell-cell communication analysis |
| Identification of potential cell-cell interactions between two cell types and their ligand-receptor pairs for different disease states |
| Ligand | Receptor | LRpair | Pathway | Tissue | Disease Stage |
| Page: 1 |
Top |
Single-cell gene regulatory network inference analysis |
| Find out the significant the regulons (TFs) and the target genes of each regulon across cell types for different disease states |
| TF | Cell Type | Tissue | Disease Stage | Target Gene | RSS | Regulon Activity |
| ∗The dot plots of a searched regulon are shown for all cell subpopulations in each disease state of each tissue based on the regulon specific score inferred using pySCENIC and by calculating the average expression. |
| Page: 1 |
Top |
Somatic mutation of malignant transformation related genes |
| Annotation of somatic variants for genes involved in malignant transformation |
| Hugo Symbol | Variant Class | Variant Classification | dbSNP RS | HGVSc | HGVSp | HGVSp Short | SWISSPROT | BIOTYPE | SIFT | PolyPhen | Tumor Sample Barcode | Tissue | Histology | Sex | Age | Stage | Therapy Types | Drugs | Outcome |
| SMIM22 | SNV | Missense_Mutation | novel | c.203N>A | p.Pro68His | p.P68H | K7EJ46 | protein_coding | deleterious(0.01) | benign(0.056) | TCGA-A5-A2K3-01 | Endometrium | uterine corpus endometrioid carcinoma | Female | >=65 | I/II | Chemotherapy | carboplatin | SD |
| Page: 1 |
Top |
Related drugs of malignant transformation related genes |
| Identification of chemicals and drugs interact with genes involved in malignant transfromation |
| (DGIdb 4.0) |
| Entrez ID | Symbol | Category | Interaction Types | Drug Claim Name | Drug Name | PMIDs |
| Page: 1 |

Copyright 2023-Present -The University of Texas Health Science Center at Houston |