
|
|||||
|
 | |
| |
| |
| |
| |
| |
|
Gene: SMDT1 |
Gene summary for SMDT1 |
| Gene information | Species | Human | Gene symbol | SMDT1 | Gene ID | 91689 |
| Gene name | single-pass membrane protein with aspartate rich tail 1 | |
| Gene Alias | C22orf32 | |
| Cytomap | 22q13.2 | |
| Gene Type | protein-coding | GO ID | GO:0006810 | UniProtAcc | Q9H4I9 |
Top |
Malignant transformation analysis |
| Identification of the aberrant gene expression in precancerous and cancerous lesions by comparing the gene expression of stem-like cells in diseased tissues with normal stem cells |
| Entrez ID | Symbol | Replicates | Species | Organ | Tissue | Adj P-value | Log2FC | Malignancy |
| 91689 | SMDT1 | HTA11_83_2000001011 | Human | Colorectum | SER | 2.59e-03 | 2.85e-01 | -0.1526 |
| 91689 | SMDT1 | HTA11_696_2000001011 | Human | Colorectum | AD | 1.39e-08 | 3.10e-01 | -0.1464 |
| 91689 | SMDT1 | HTA11_866_2000001011 | Human | Colorectum | AD | 3.86e-04 | 2.05e-01 | -0.1001 |
| 91689 | SMDT1 | HTA11_1391_2000001011 | Human | Colorectum | AD | 8.11e-03 | 2.47e-01 | -0.059 |
| 91689 | SMDT1 | HTA11_5216_2000001011 | Human | Colorectum | SER | 3.51e-04 | 3.53e-01 | -0.1462 |
| 91689 | SMDT1 | HTA11_546_2000001011 | Human | Colorectum | AD | 2.90e-04 | 2.85e-01 | -0.0842 |
| 91689 | SMDT1 | HTA11_866_3004761011 | Human | Colorectum | AD | 4.17e-06 | 1.88e-01 | 0.096 |
| 91689 | SMDT1 | HTA11_4255_2000001011 | Human | Colorectum | SER | 1.17e-04 | 4.04e-01 | 0.0446 |
| 91689 | SMDT1 | HTA11_7696_3000711011 | Human | Colorectum | AD | 2.58e-05 | 1.79e-01 | 0.0674 |
| 91689 | SMDT1 | HTA11_99999970781_79442 | Human | Colorectum | MSS | 8.45e-03 | 1.95e-01 | 0.294 |
| 91689 | SMDT1 | HTA11_99999965104_69814 | Human | Colorectum | MSS | 6.87e-10 | 4.67e-01 | 0.281 |
| 91689 | SMDT1 | HTA11_99999971662_82457 | Human | Colorectum | MSS | 1.65e-07 | 2.89e-01 | 0.3859 |
| 91689 | SMDT1 | HTA11_99999974143_84620 | Human | Colorectum | MSS | 1.81e-02 | 1.79e-01 | 0.3005 |
| 91689 | SMDT1 | AEH-subject1 | Human | Endometrium | AEH | 7.18e-24 | -4.44e-01 | -0.3059 |
| 91689 | SMDT1 | AEH-subject2 | Human | Endometrium | AEH | 7.77e-13 | -4.08e-01 | -0.2525 |
| 91689 | SMDT1 | AEH-subject3 | Human | Endometrium | AEH | 1.08e-19 | -4.18e-01 | -0.2576 |
| 91689 | SMDT1 | AEH-subject4 | Human | Endometrium | AEH | 8.72e-09 | -3.44e-01 | -0.2657 |
| 91689 | SMDT1 | AEH-subject5 | Human | Endometrium | AEH | 9.67e-14 | -2.89e-01 | -0.2953 |
| 91689 | SMDT1 | EEC-subject1 | Human | Endometrium | EEC | 2.12e-25 | -4.60e-01 | -0.2682 |
| 91689 | SMDT1 | EEC-subject2 | Human | Endometrium | EEC | 1.14e-18 | -4.41e-01 | -0.2607 |
| Page: 1 2 3 4 5 6 7 8 9 10 11 12 13 |
| Tissue | Expression Dynamics | Abbreviation |
| Breast | 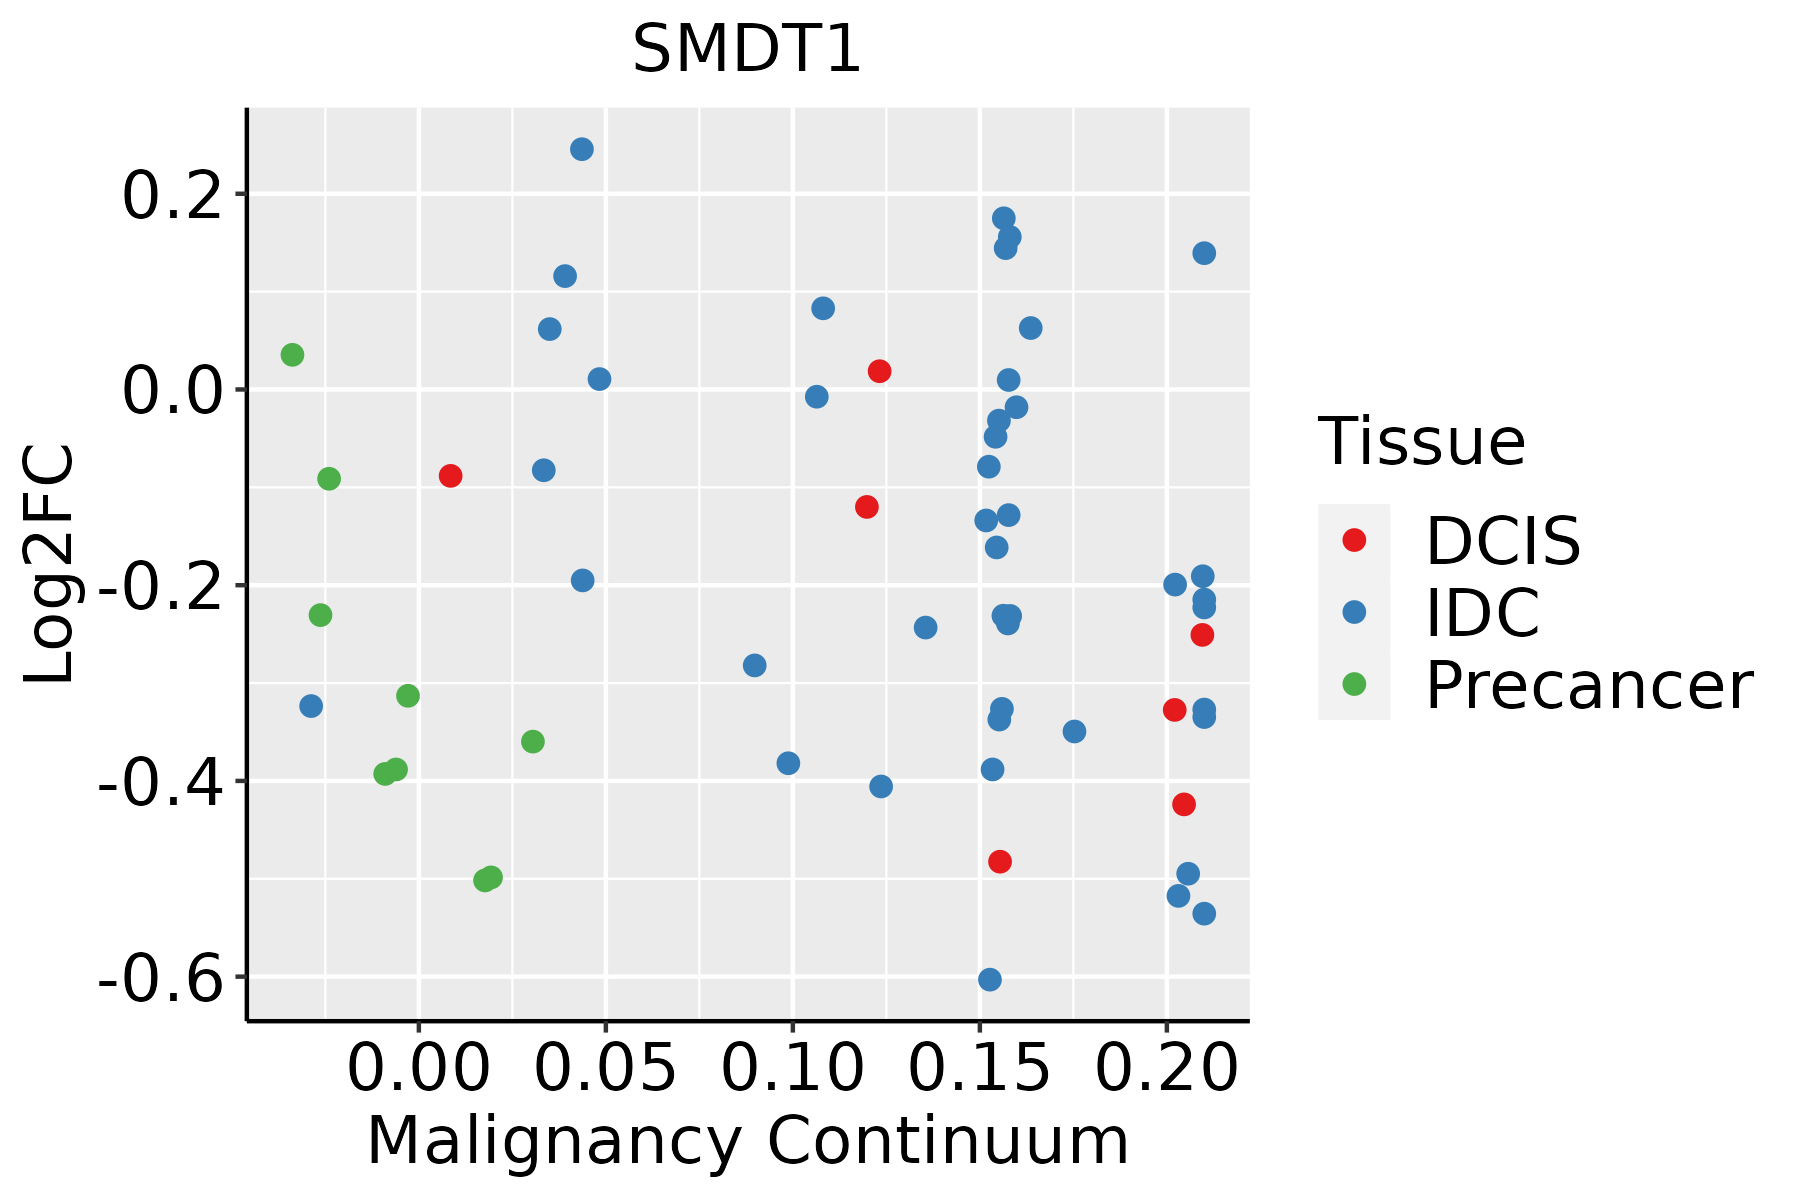 | IDC: Invasive ductal carcinoma |
| DCIS: Ductal carcinoma in situ | ||
| Precancer(BRCA1-mut): Precancerous lesion from BRCA1 mutation carriers | ||
| Cervix |  | CC: Cervix cancer |
| HSIL_HPV: HPV-infected high-grade squamous intraepithelial lesions | ||
| N_HPV: HPV-infected normal cervix | ||
| Colorectum (GSE201348) |  | FAP: Familial adenomatous polyposis |
| CRC: Colorectal cancer | ||
| Colorectum (HTA11) |  | AD: Adenomas |
| SER: Sessile serrated lesions | ||
| MSI-H: Microsatellite-high colorectal cancer | ||
| MSS: Microsatellite stable colorectal cancer | ||
| Endometrium |  | AEH: Atypical endometrial hyperplasia |
| EEC: Endometrioid Cancer | ||
| Esophagus | 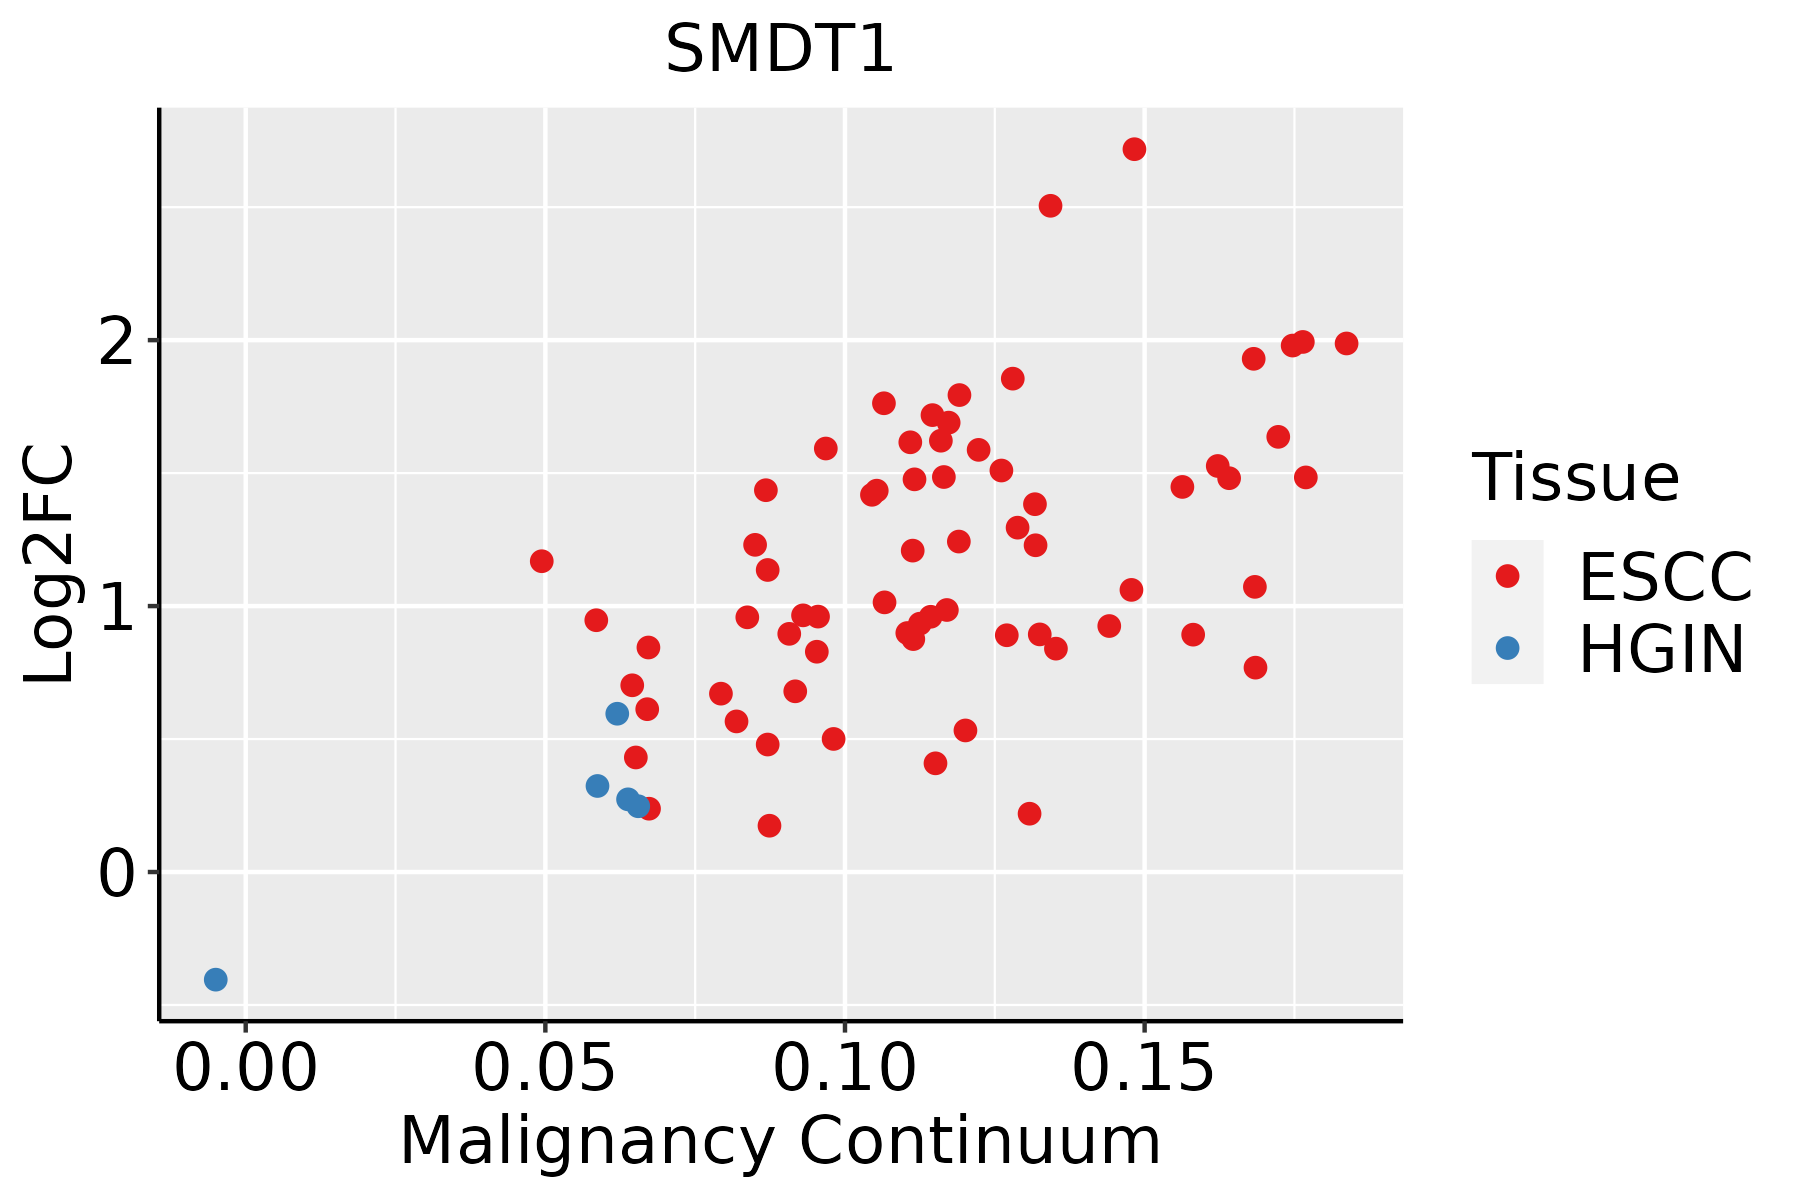 | ESCC: Esophageal squamous cell carcinoma |
| HGIN: High-grade intraepithelial neoplasias | ||
| LGIN: Low-grade intraepithelial neoplasias | ||
| GC |  | CAG: Chronic atrophic gastritis |
| CAG with IM: Chronic atrophic gastritis with intestinal metaplasia | ||
| CSG: Chronic superficial gastritis | ||
| GC: Gastric cancer | ||
| SIM: Severe intestinal metaplasia | ||
| WIM: Wild intestinal metaplasia | ||
| Liver | 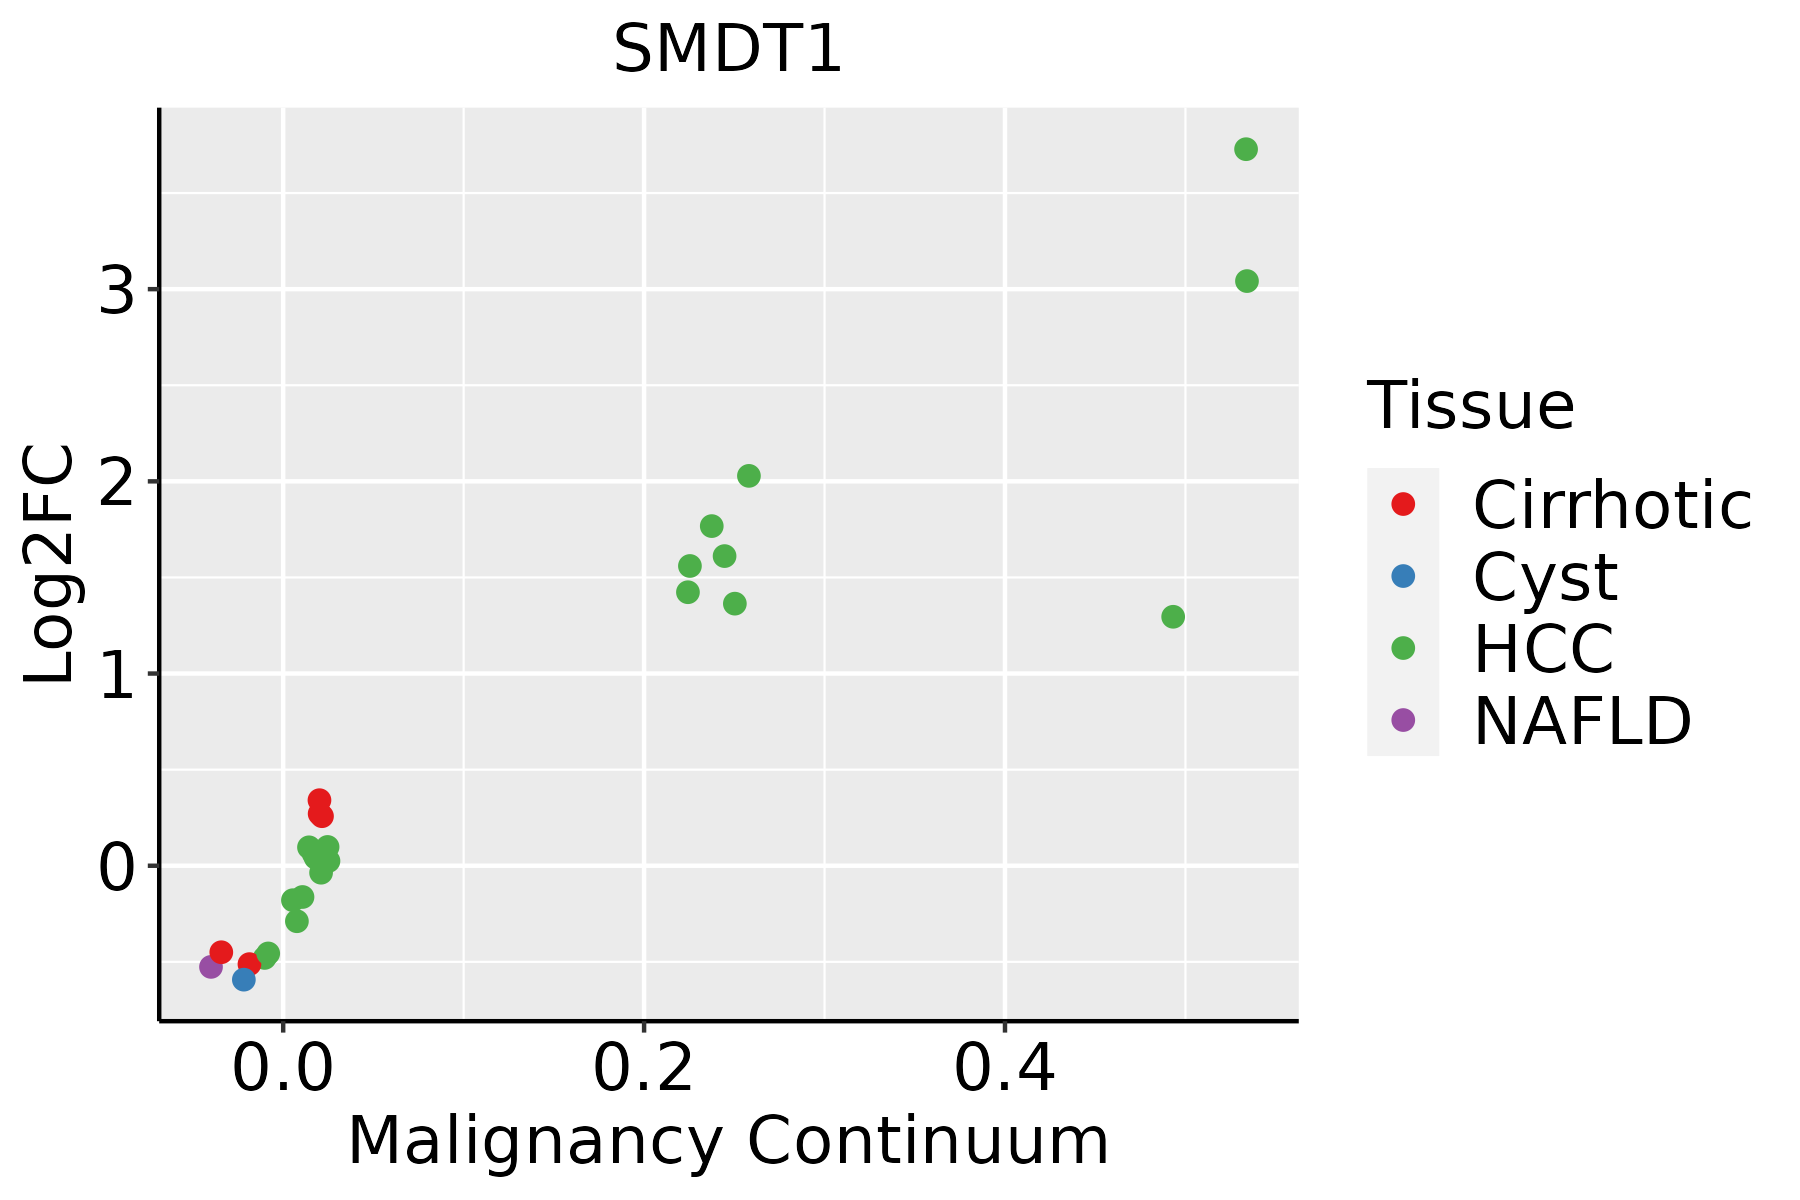 | HCC: Hepatocellular carcinoma |
| NAFLD: Non-alcoholic fatty liver disease | ||
| Oral Cavity | 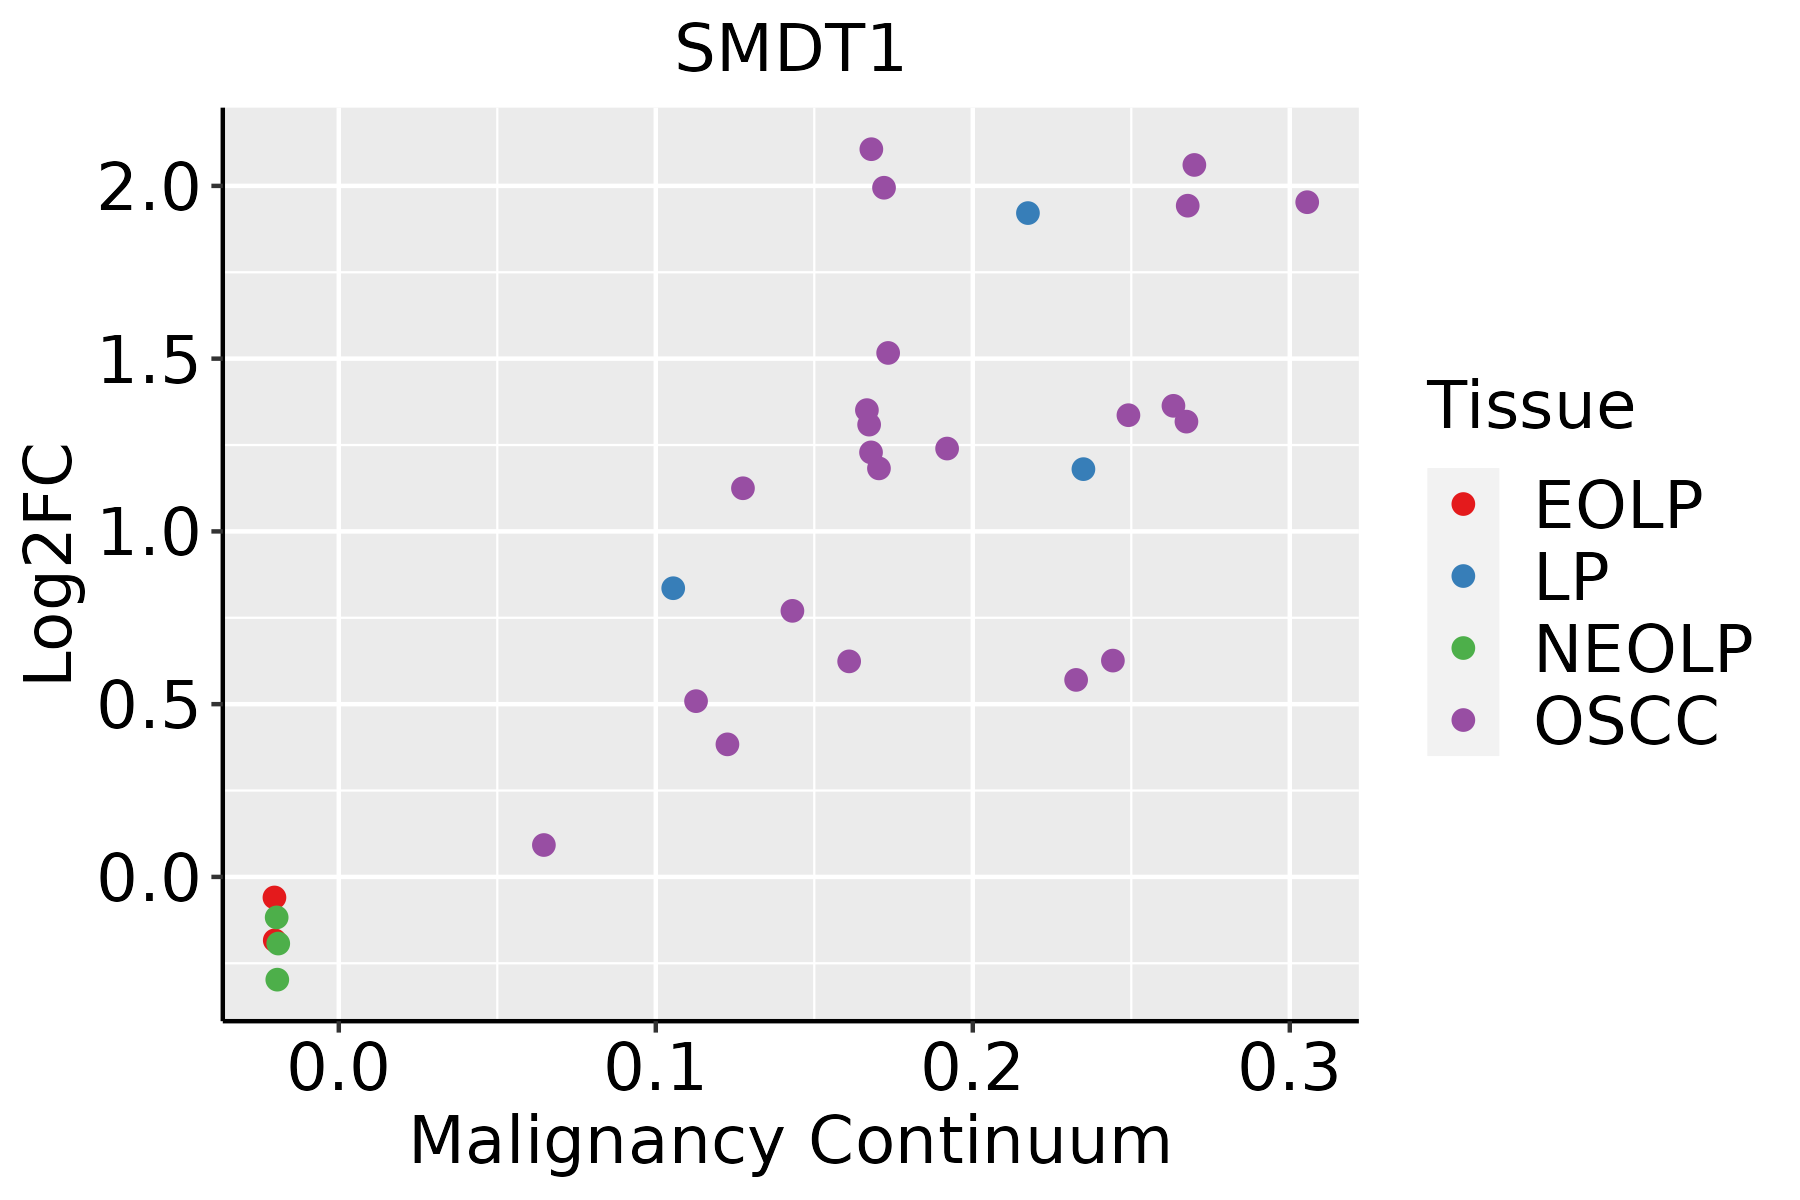 | EOLP: Erosive Oral lichen planus |
| LP: leukoplakia | ||
| NEOLP: Non-erosive oral lichen planus | ||
| OSCC: Oral squamous cell carcinoma | ||
| Prostate | 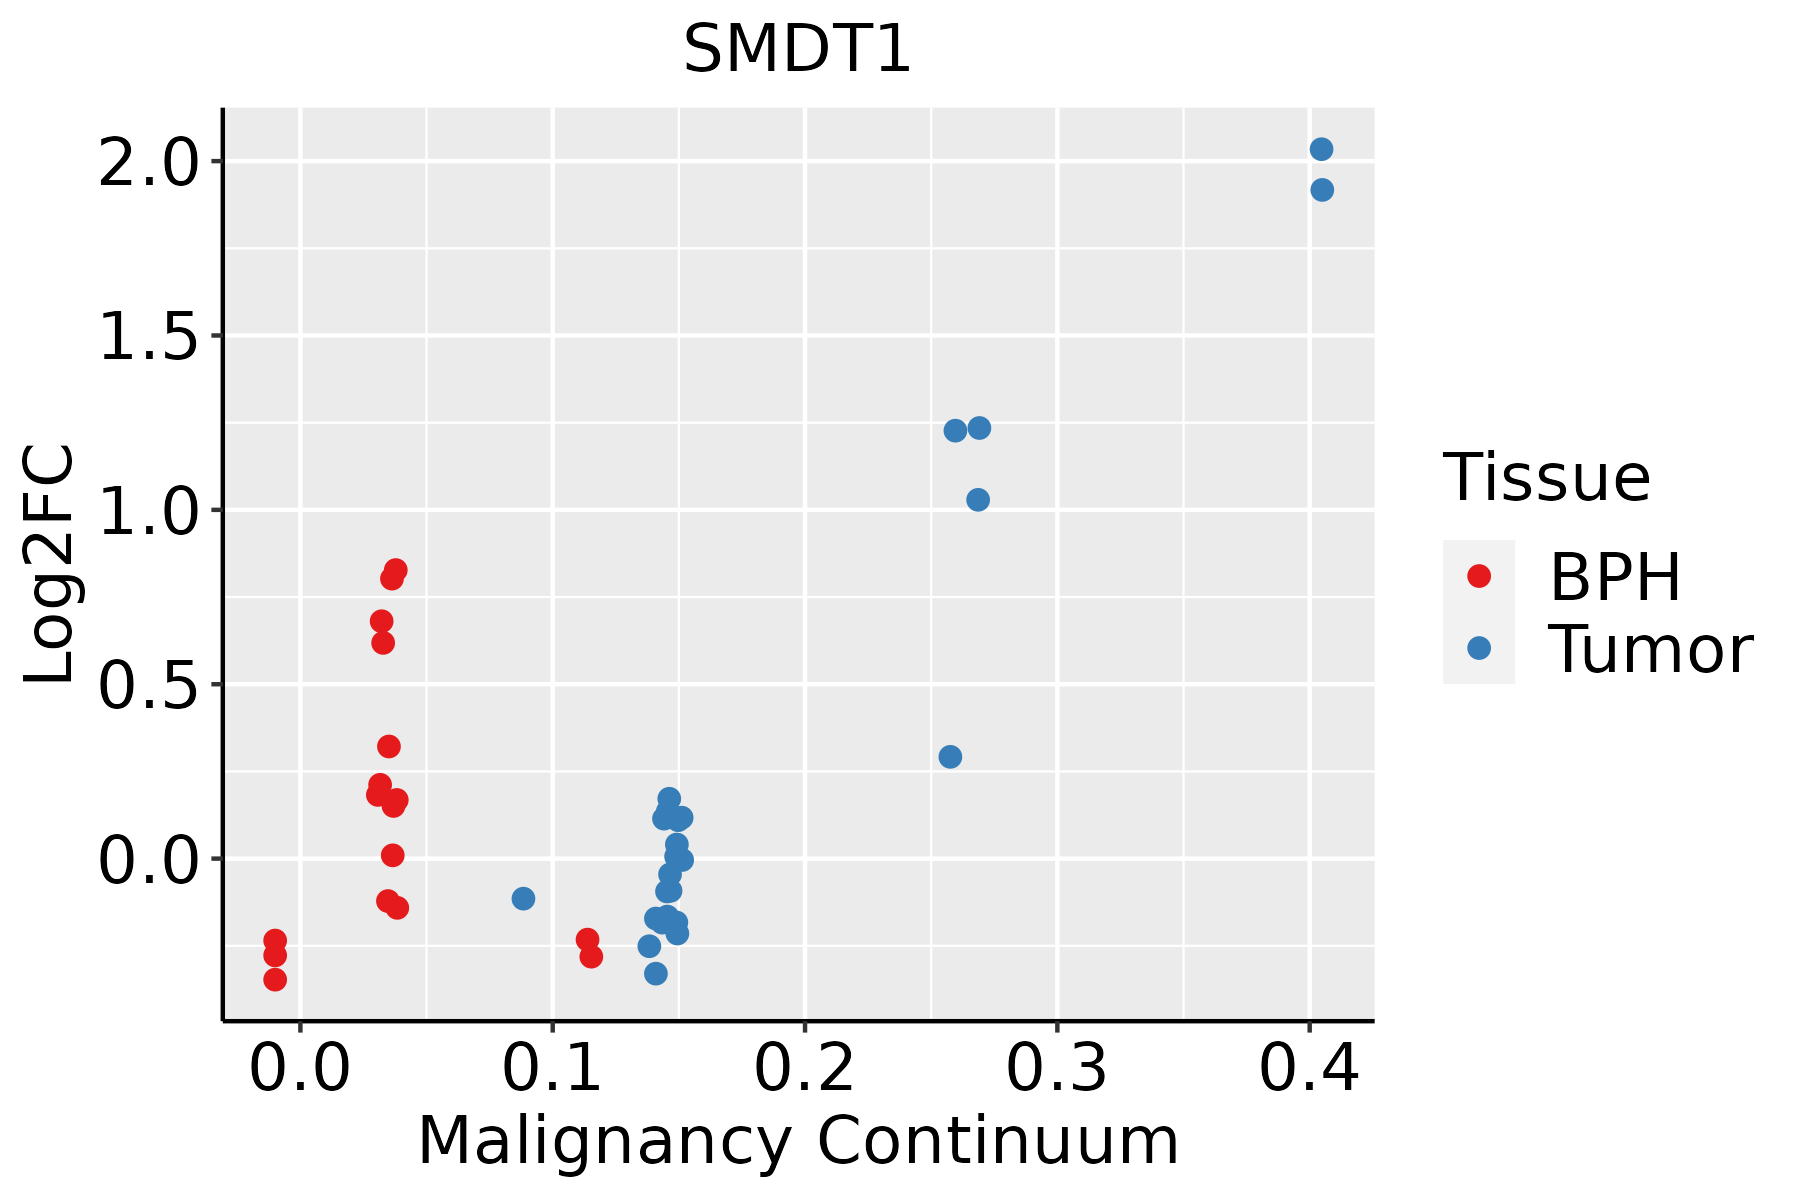 | BPH: Benign Prostatic Hyperplasia |
| Skin | 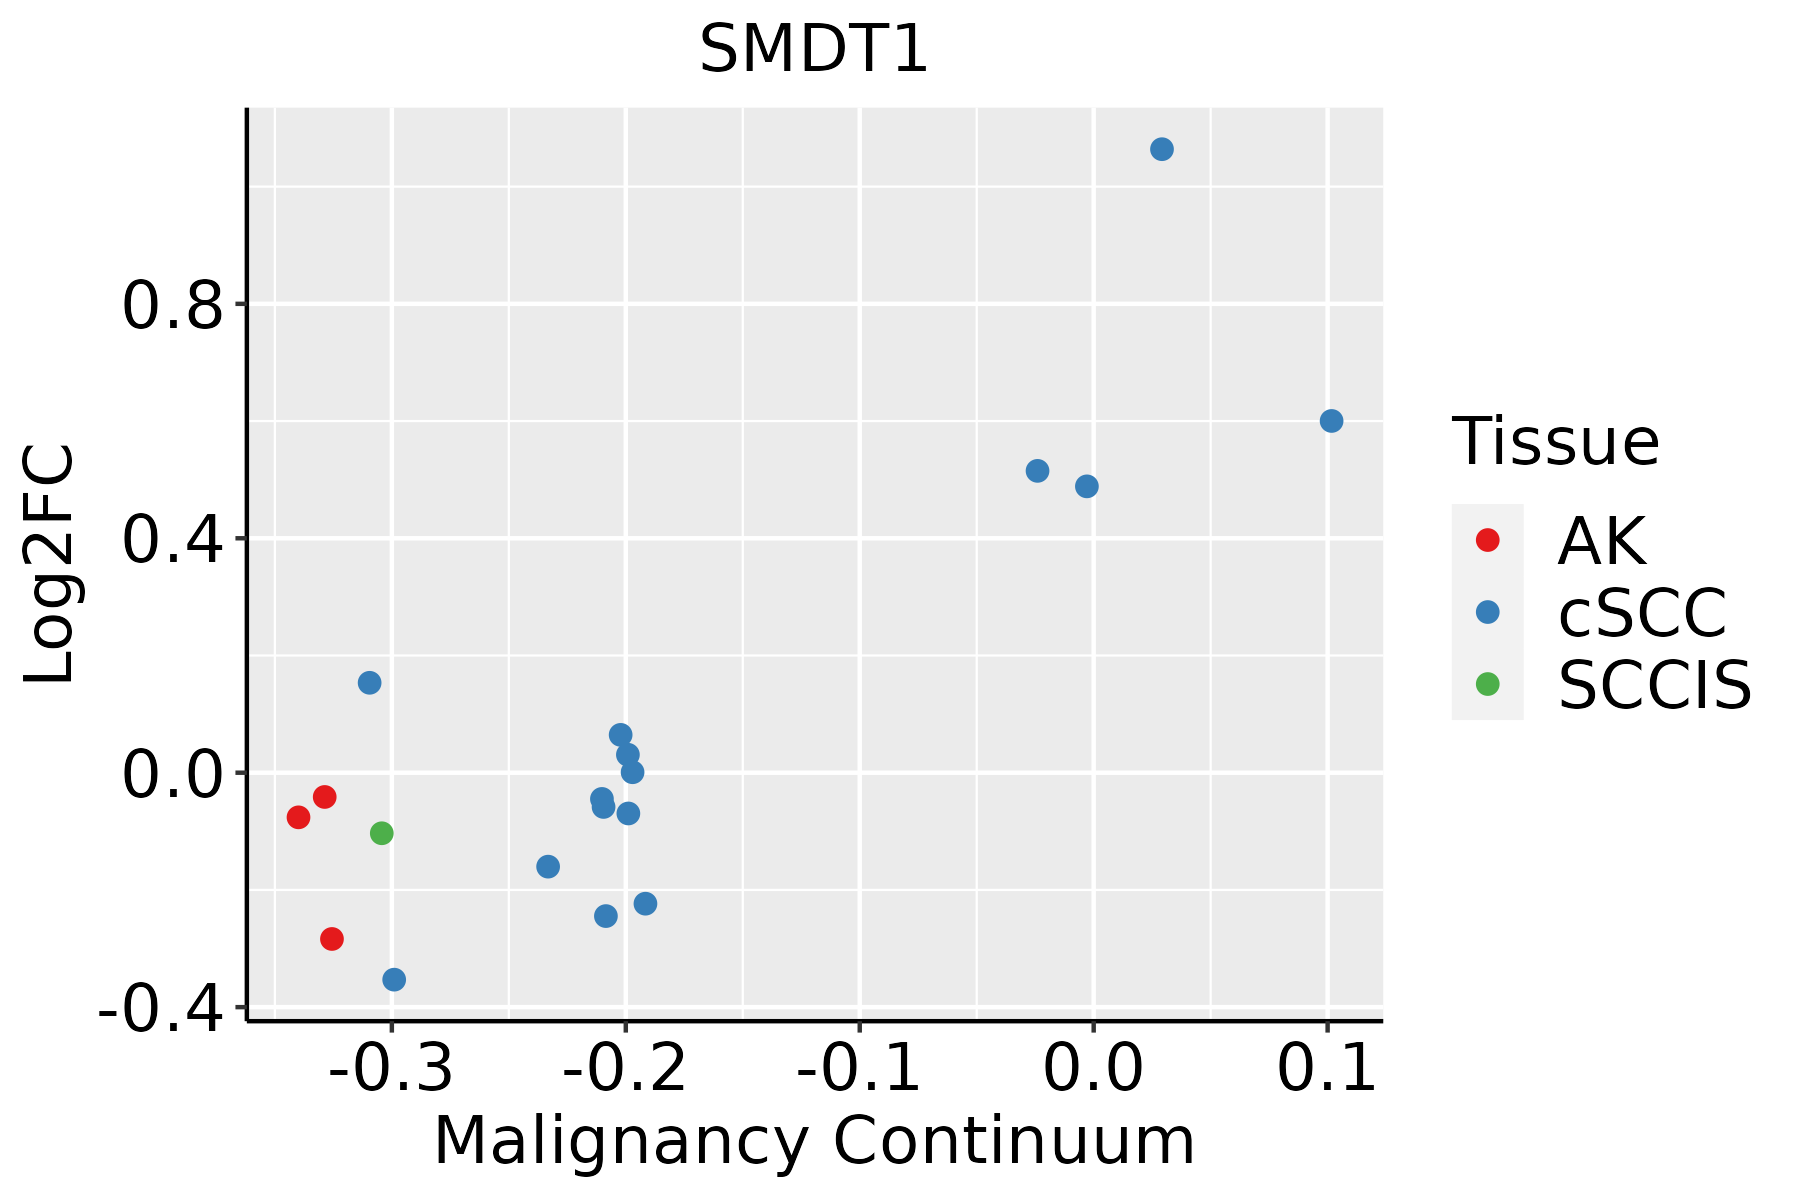 | AK: Actinic keratosis |
| cSCC: Cutaneous squamous cell carcinoma | ||
| SCCIS:squamous cell carcinoma in situ | ||
| Thyroid | 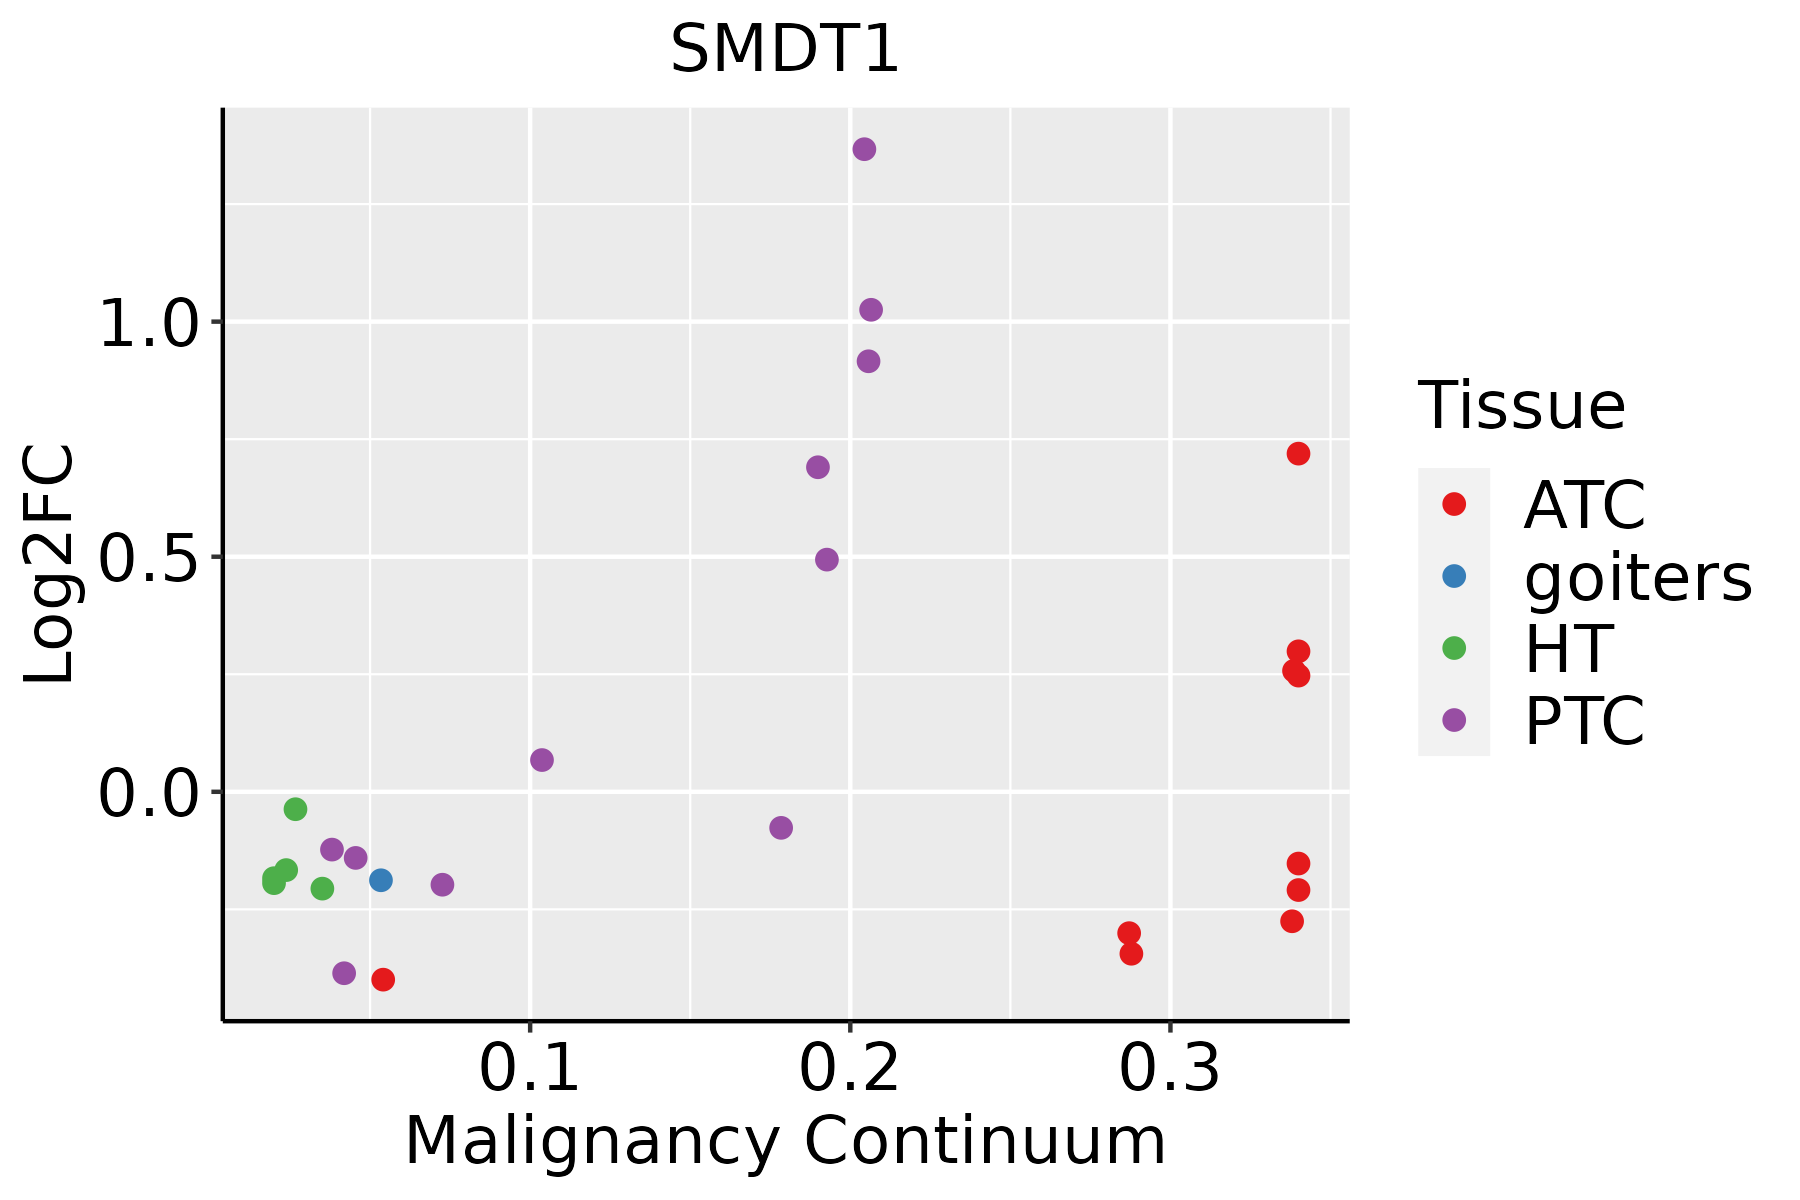 | ATC: Anaplastic thyroid cancer |
| HT: Hashimoto's thyroiditis | ||
| PTC: Papillary thyroid cancer |
| ∗log2FC in expression of this searched gene in stem-like cells from each diseased tissue sample relative to stem-like cells in normal samples in each tissue plotted against the malignancy continuum. Samples are colored based on if they are from different disease stage. |
Top |
Malignant transformation related pathway analysis |
| Find out the enriched GO biological processes and KEGG pathways involved in transition from healthy to precancer to cancer |
| Tissue | Disease Stage | Enriched GO biological Processes |
| Colorectum | AD |  |
| Colorectum | SER |  |
| Colorectum | MSS |  |
| Colorectum | MSI-H |  |
| Colorectum | FAP |  |
| ∗Top 15 enriched GO BP terms are showed in the bar plot of each disease state in each tissue. Each row represents a significant GO biological process which is colored according to the -log10(p.adjust). |
| Page: 1 2 3 4 5 6 7 8 9 |
| GO ID | Tissue | Disease Stage | Description | Gene Ratio | Bg Ratio | pvalue | p.adjust | Count |
| GO:00068398 | Breast | Precancer | mitochondrial transport | 45/1080 | 254/18723 | 1.37e-11 | 1.88e-09 | 45 |
| GO:19905427 | Breast | Precancer | mitochondrial transmembrane transport | 22/1080 | 102/18723 | 6.38e-08 | 3.80e-06 | 22 |
| GO:0072503 | Breast | Precancer | cellular divalent inorganic cation homeostasis | 42/1080 | 486/18723 | 5.91e-03 | 4.21e-02 | 42 |
| GO:000683913 | Breast | IDC | mitochondrial transport | 51/1434 | 254/18723 | 1.54e-10 | 1.83e-08 | 51 |
| GO:199054214 | Breast | IDC | mitochondrial transmembrane transport | 25/1434 | 102/18723 | 1.39e-07 | 7.74e-06 | 25 |
| GO:000683923 | Breast | DCIS | mitochondrial transport | 51/1390 | 254/18723 | 5.04e-11 | 6.79e-09 | 51 |
| GO:199054222 | Breast | DCIS | mitochondrial transmembrane transport | 25/1390 | 102/18723 | 7.63e-08 | 4.45e-06 | 25 |
| GO:00068399 | Cervix | CC | mitochondrial transport | 60/2311 | 254/18723 | 4.21e-07 | 1.67e-05 | 60 |
| GO:19905428 | Cervix | CC | mitochondrial transmembrane transport | 26/2311 | 102/18723 | 2.10e-04 | 2.39e-03 | 26 |
| GO:000683914 | Cervix | HSIL_HPV | mitochondrial transport | 22/737 | 254/18723 | 4.72e-04 | 6.90e-03 | 22 |
| GO:199054215 | Cervix | HSIL_HPV | mitochondrial transmembrane transport | 12/737 | 102/18723 | 6.67e-04 | 9.08e-03 | 12 |
| GO:0006839 | Colorectum | AD | mitochondrial transport | 102/3918 | 254/18723 | 1.87e-12 | 3.08e-10 | 102 |
| GO:1990542 | Colorectum | AD | mitochondrial transmembrane transport | 47/3918 | 102/18723 | 1.09e-08 | 6.52e-07 | 47 |
| GO:0051560 | Colorectum | AD | mitochondrial calcium ion homeostasis | 13/3918 | 26/18723 | 9.41e-04 | 8.92e-03 | 13 |
| GO:0036444 | Colorectum | AD | calcium import into the mitochondrion | 8/3918 | 14/18723 | 3.23e-03 | 2.38e-02 | 8 |
| GO:0006851 | Colorectum | AD | mitochondrial calcium ion transmembrane transport | 10/3918 | 20/18723 | 3.67e-03 | 2.60e-02 | 10 |
| GO:00068391 | Colorectum | SER | mitochondrial transport | 87/2897 | 254/18723 | 7.91e-14 | 3.03e-11 | 87 |
| GO:19905421 | Colorectum | SER | mitochondrial transmembrane transport | 42/2897 | 102/18723 | 3.65e-10 | 4.77e-08 | 42 |
| GO:00068511 | Colorectum | SER | mitochondrial calcium ion transmembrane transport | 10/2897 | 20/18723 | 3.20e-04 | 5.15e-03 | 10 |
| GO:00364441 | Colorectum | SER | calcium import into the mitochondrion | 8/2897 | 14/18723 | 4.06e-04 | 6.07e-03 | 8 |
| Page: 1 2 3 4 |
| Pathway ID | Tissue | Disease Stage | Description | Gene Ratio | Bg Ratio | pvalue | p.adjust | qvalue | Count |
| Page: 1 |
Top |
Cell-cell communication analysis |
| Identification of potential cell-cell interactions between two cell types and their ligand-receptor pairs for different disease states |
| Ligand | Receptor | LRpair | Pathway | Tissue | Disease Stage |
| Page: 1 |
Top |
Single-cell gene regulatory network inference analysis |
| Find out the significant the regulons (TFs) and the target genes of each regulon across cell types for different disease states |
| TF | Cell Type | Tissue | Disease Stage | Target Gene | RSS | Regulon Activity |
| ∗The dot plots of a searched regulon are shown for all cell subpopulations in each disease state of each tissue based on the regulon specific score inferred using pySCENIC and by calculating the average expression. |
| Page: 1 |
Top |
Somatic mutation of malignant transformation related genes |
| Annotation of somatic variants for genes involved in malignant transformation |
| Hugo Symbol | Variant Class | Variant Classification | dbSNP RS | HGVSc | HGVSp | HGVSp Short | SWISSPROT | BIOTYPE | SIFT | PolyPhen | Tumor Sample Barcode | Tissue | Histology | Sex | Age | Stage | Therapy Types | Drugs | Outcome |
| SMDT1 | insertion | Frame_Shift_Ins | novel | c.319_320insGCCCTCCTAGT | p.Asp107GlyfsTer63 | p.D107Gfs*63 | Q9H4I9 | protein_coding | TCGA-B6-A0RE-01 | Breast | breast invasive carcinoma | Female | <65 | I/II | Unknown | Unknown | SD | ||
| SMDT1 | insertion | Nonsense_Mutation | novel | c.321_322insTGGTGCACCCGATTGCCTGTAGGGATTTAAAG | p.Ter108TrpfsTer10 | p.*108Wfs*10 | Q9H4I9 | protein_coding | TCGA-B6-A0RE-01 | Breast | breast invasive carcinoma | Female | <65 | I/II | Unknown | Unknown | SD | ||
| SMDT1 | SNV | Missense_Mutation | novel | c.137N>T | p.Arg46Met | p.R46M | Q9H4I9 | protein_coding | deleterious(0.02) | probably_damaging(0.983) | TCGA-A5-A0G1-01 | Endometrium | uterine corpus endometrioid carcinoma | Female | >=65 | I/II | Unknown | Unknown | SD |
| SMDT1 | SNV | Missense_Mutation | rs139230313 | c.206G>A | p.Arg69His | p.R69H | Q9H4I9 | protein_coding | deleterious(0) | probably_damaging(0.993) | TCGA-AP-A059-01 | Endometrium | uterine corpus endometrioid carcinoma | Female | >=65 | I/II | Unknown | Unknown | SD |
| SMDT1 | SNV | Missense_Mutation | novel | c.292N>G | p.Phe98Val | p.F98V | Q9H4I9 | protein_coding | deleterious(0) | probably_damaging(0.999) | TCGA-66-2785-01 | Lung | lung squamous cell carcinoma | Male | >=65 | I/II | Unknown | Unknown | SD |
| SMDT1 | SNV | Missense_Mutation | novel | c.188N>C | p.Met63Thr | p.M63T | Q9H4I9 | protein_coding | tolerated(0.85) | benign(0.047) | TCGA-F7-A624-01 | Oral cavity | head & neck squamous cell carcinoma | Male | >=65 | I/II | Unknown | Unknown | SD |
| SMDT1 | SNV | Missense_Mutation | novel | c.34N>T | p.Ala12Ser | p.A12S | Q9H4I9 | protein_coding | tolerated(0.28) | benign(0.036) | TCGA-CG-5723-01 | Stomach | stomach adenocarcinoma | Male | >=65 | I/II | Unknown | Unknown | SD |
| Page: 1 |
Top |
Related drugs of malignant transformation related genes |
| Identification of chemicals and drugs interact with genes involved in malignant transfromation |
| (DGIdb 4.0) |
| Entrez ID | Symbol | Category | Interaction Types | Drug Claim Name | Drug Name | PMIDs |
| Page: 1 |

Copyright 2023-Present -The University of Texas Health Science Center at Houston |