| Tissue | Expression Dynamics | Abbreviation |
| Cervix | 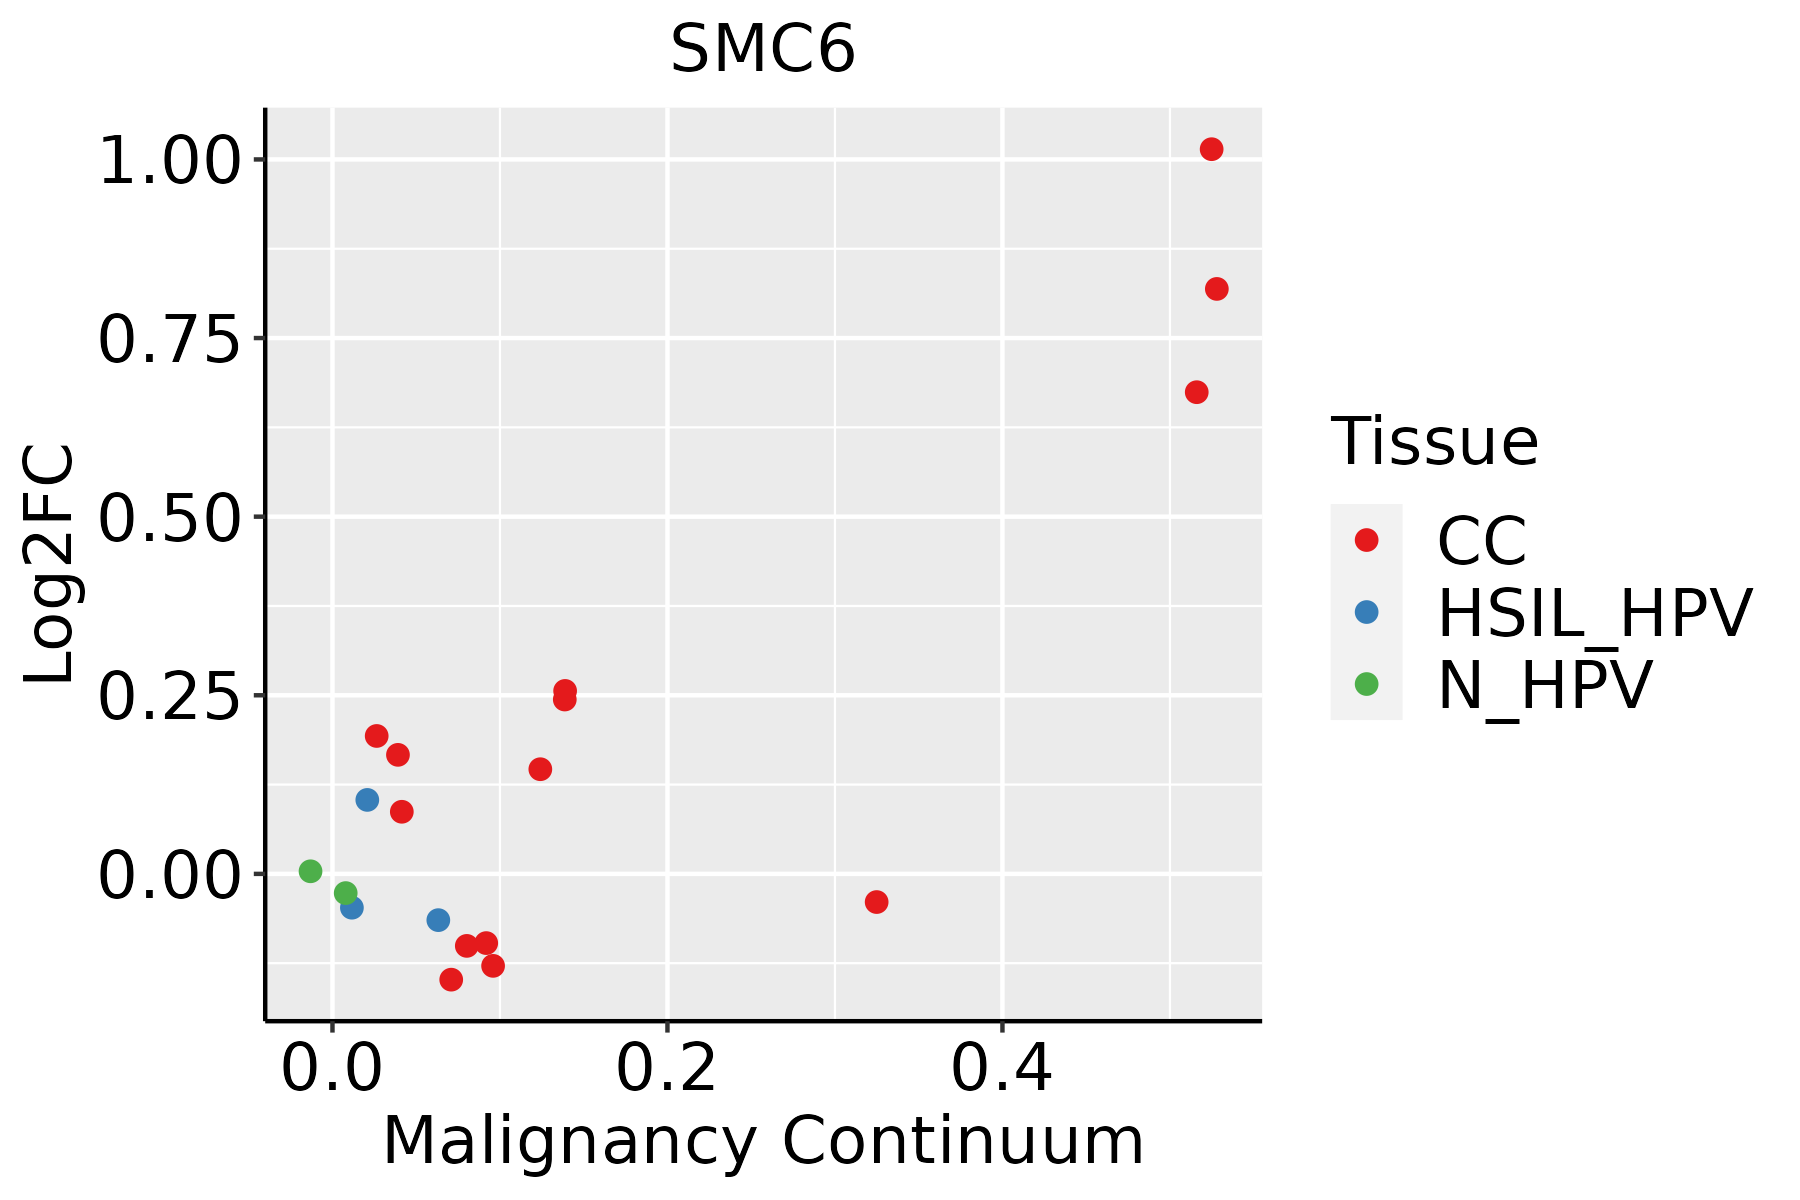 | CC: Cervix cancer |
| HSIL_HPV: HPV-infected high-grade squamous intraepithelial lesions |
| N_HPV: HPV-infected normal cervix |
| Esophagus | 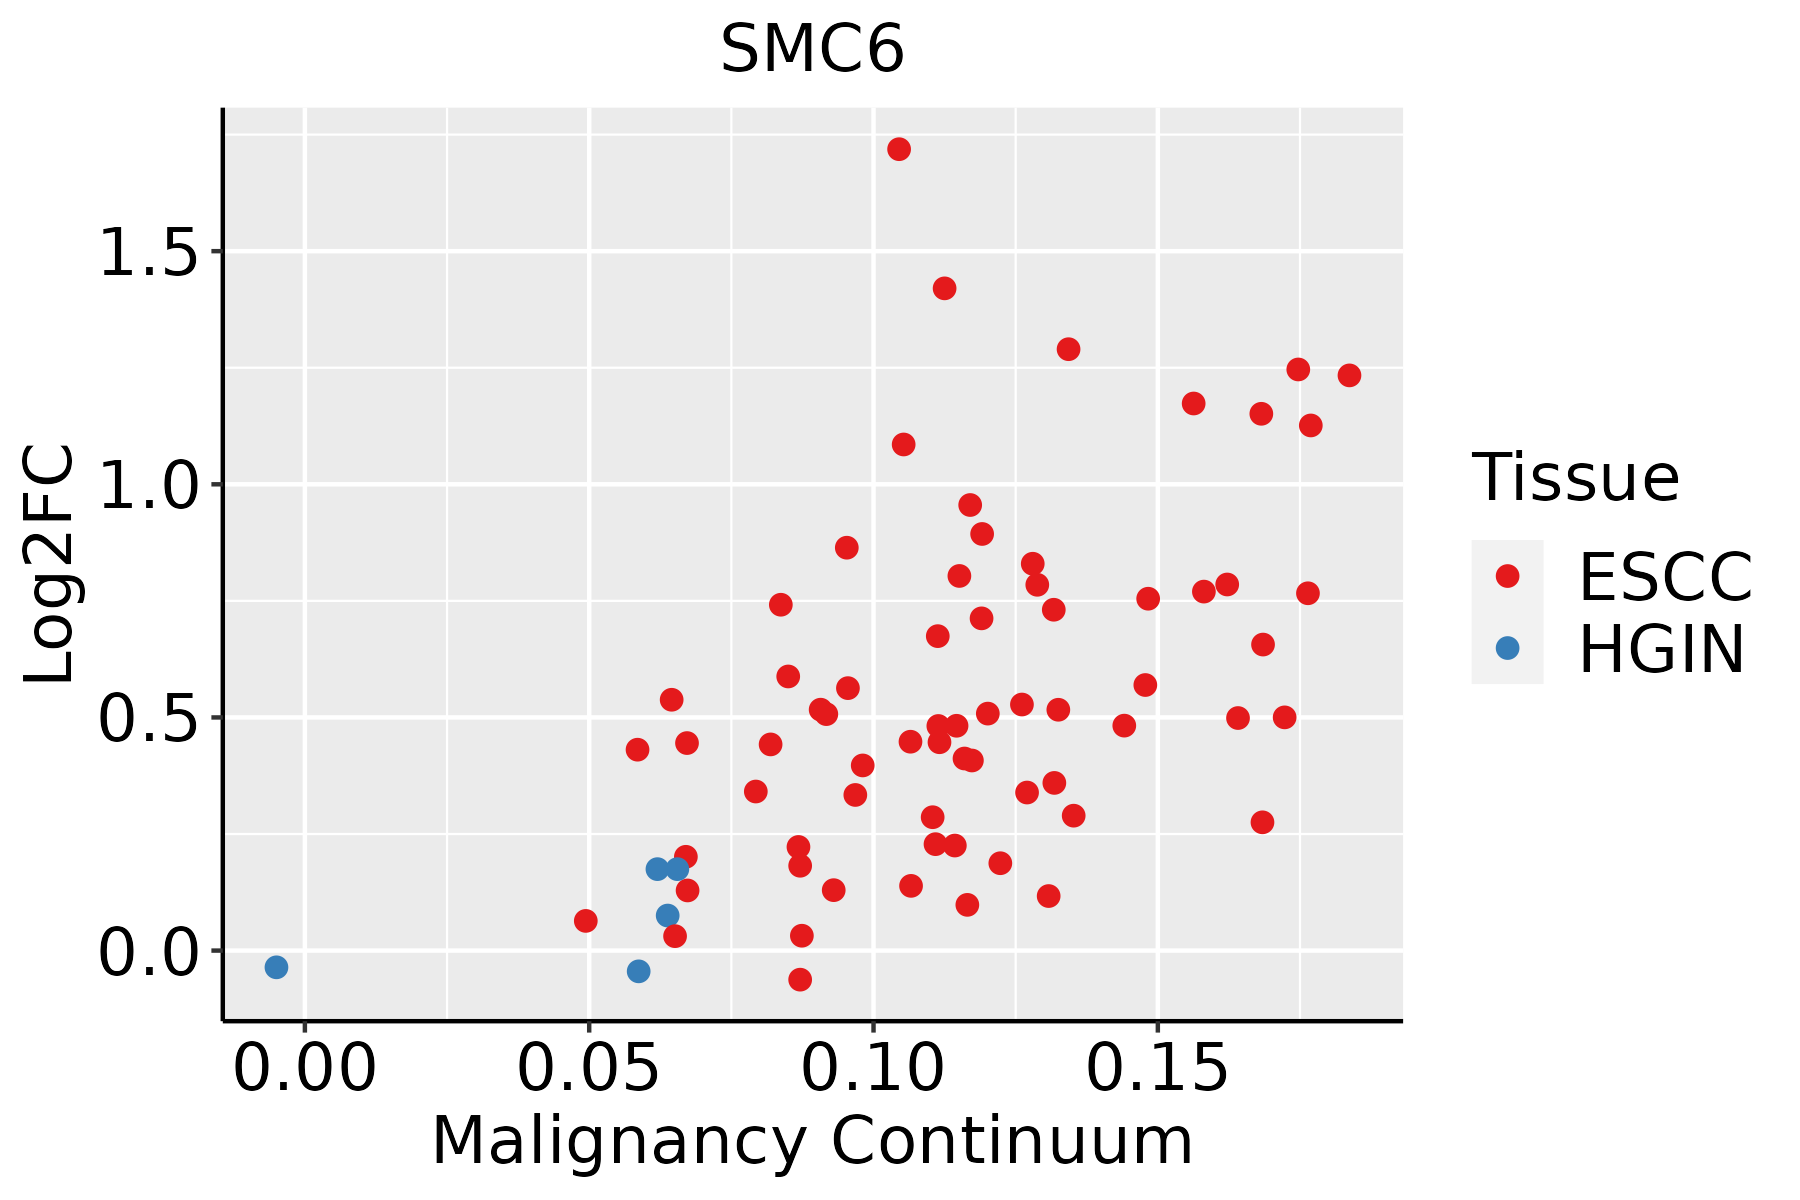 | ESCC: Esophageal squamous cell carcinoma |
| HGIN: High-grade intraepithelial neoplasias |
| LGIN: Low-grade intraepithelial neoplasias |
| Liver |  | HCC: Hepatocellular carcinoma |
| NAFLD: Non-alcoholic fatty liver disease |
| Oral Cavity | 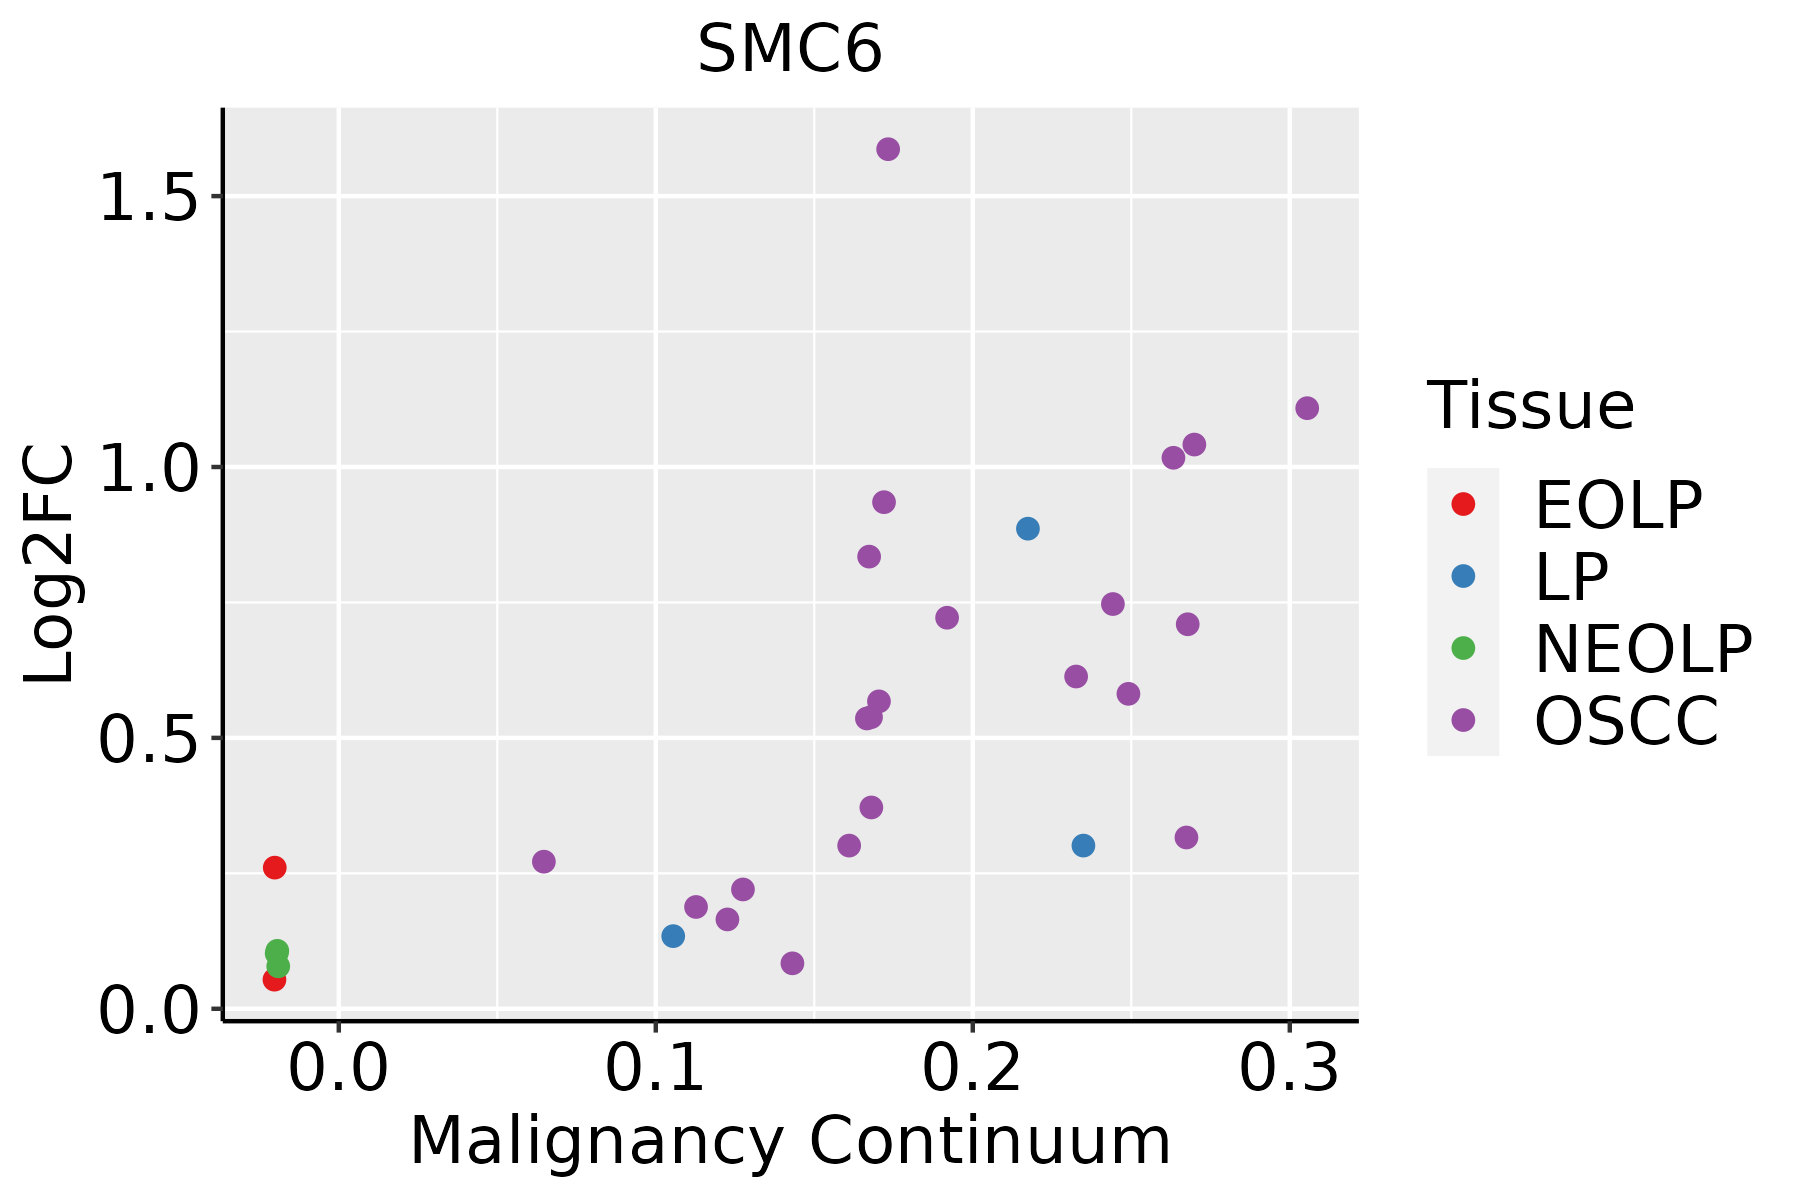 | EOLP: Erosive Oral lichen planus |
| LP: leukoplakia |
| NEOLP: Non-erosive oral lichen planus |
| OSCC: Oral squamous cell carcinoma |
| Prostate | 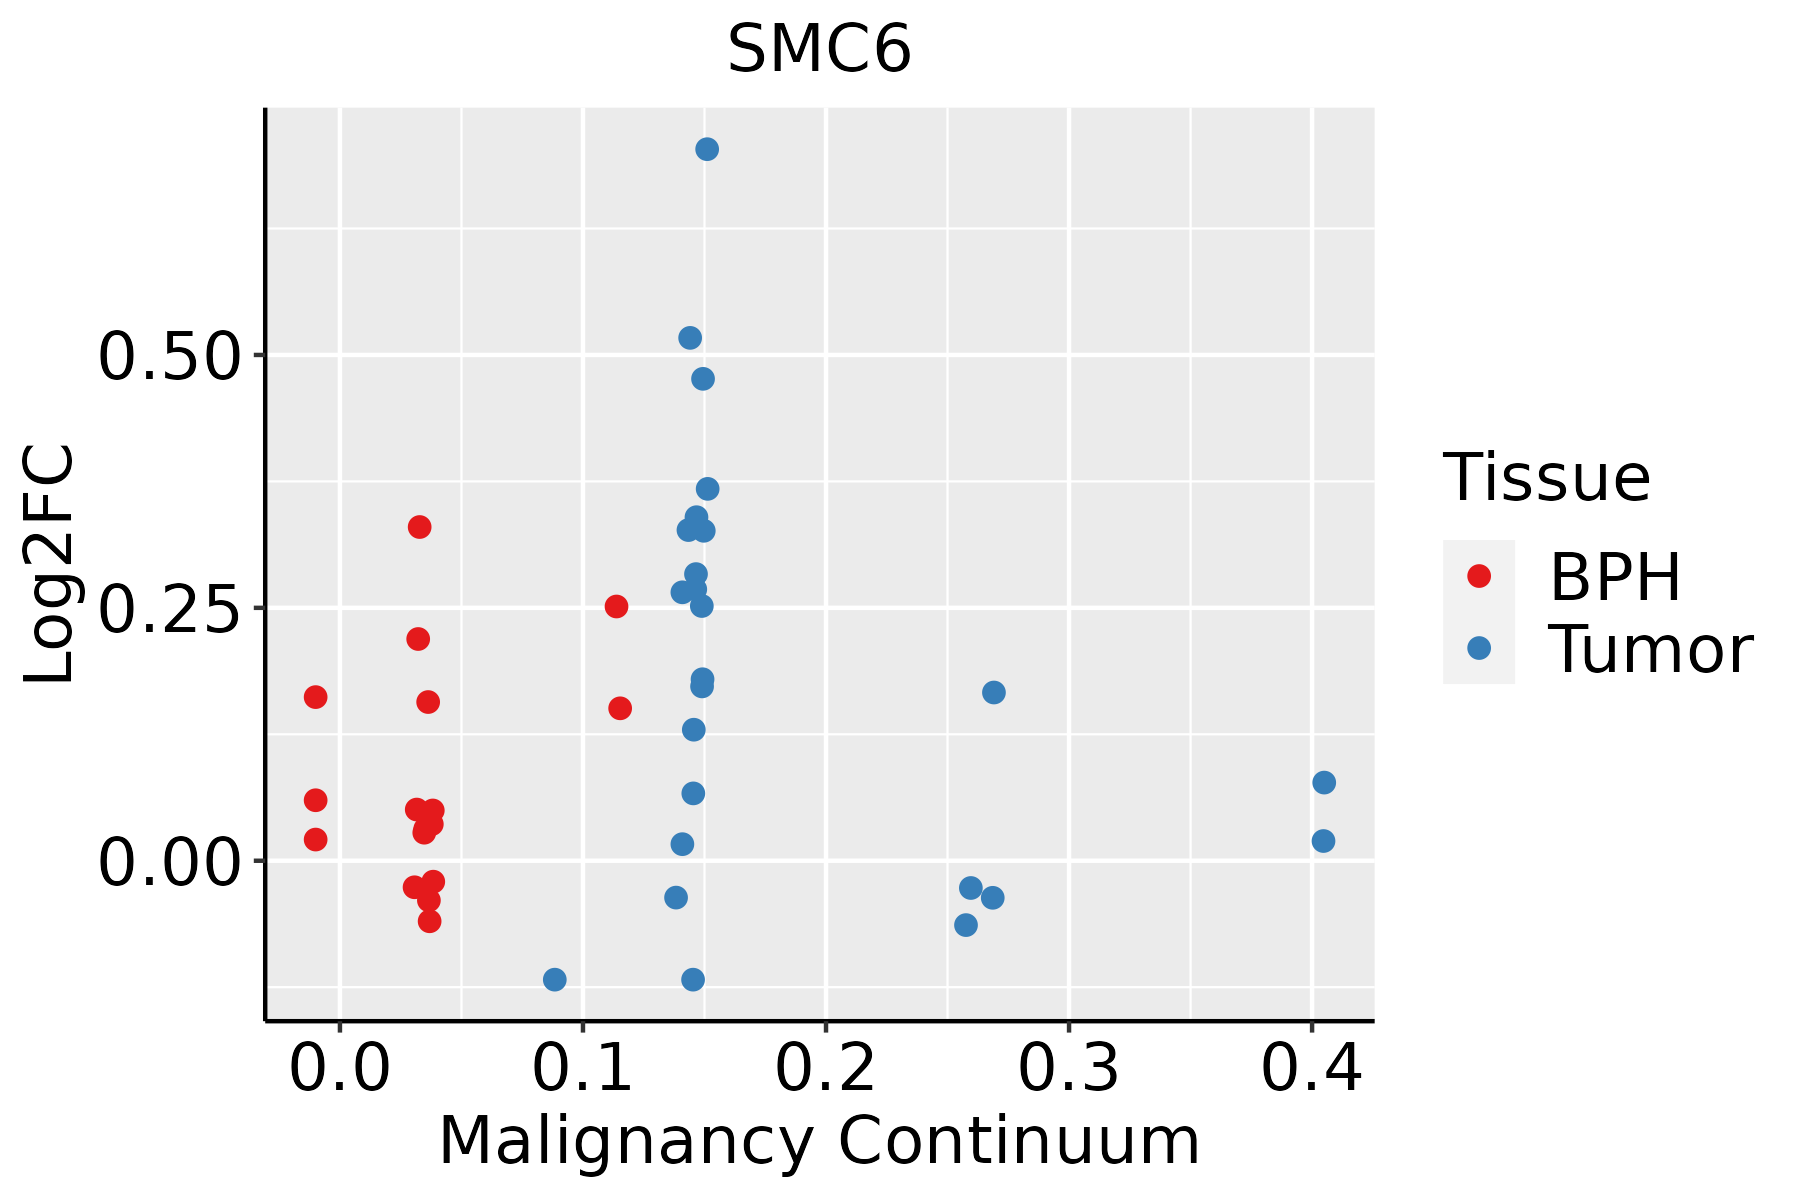 | BPH: Benign Prostatic Hyperplasia |
| Skin | 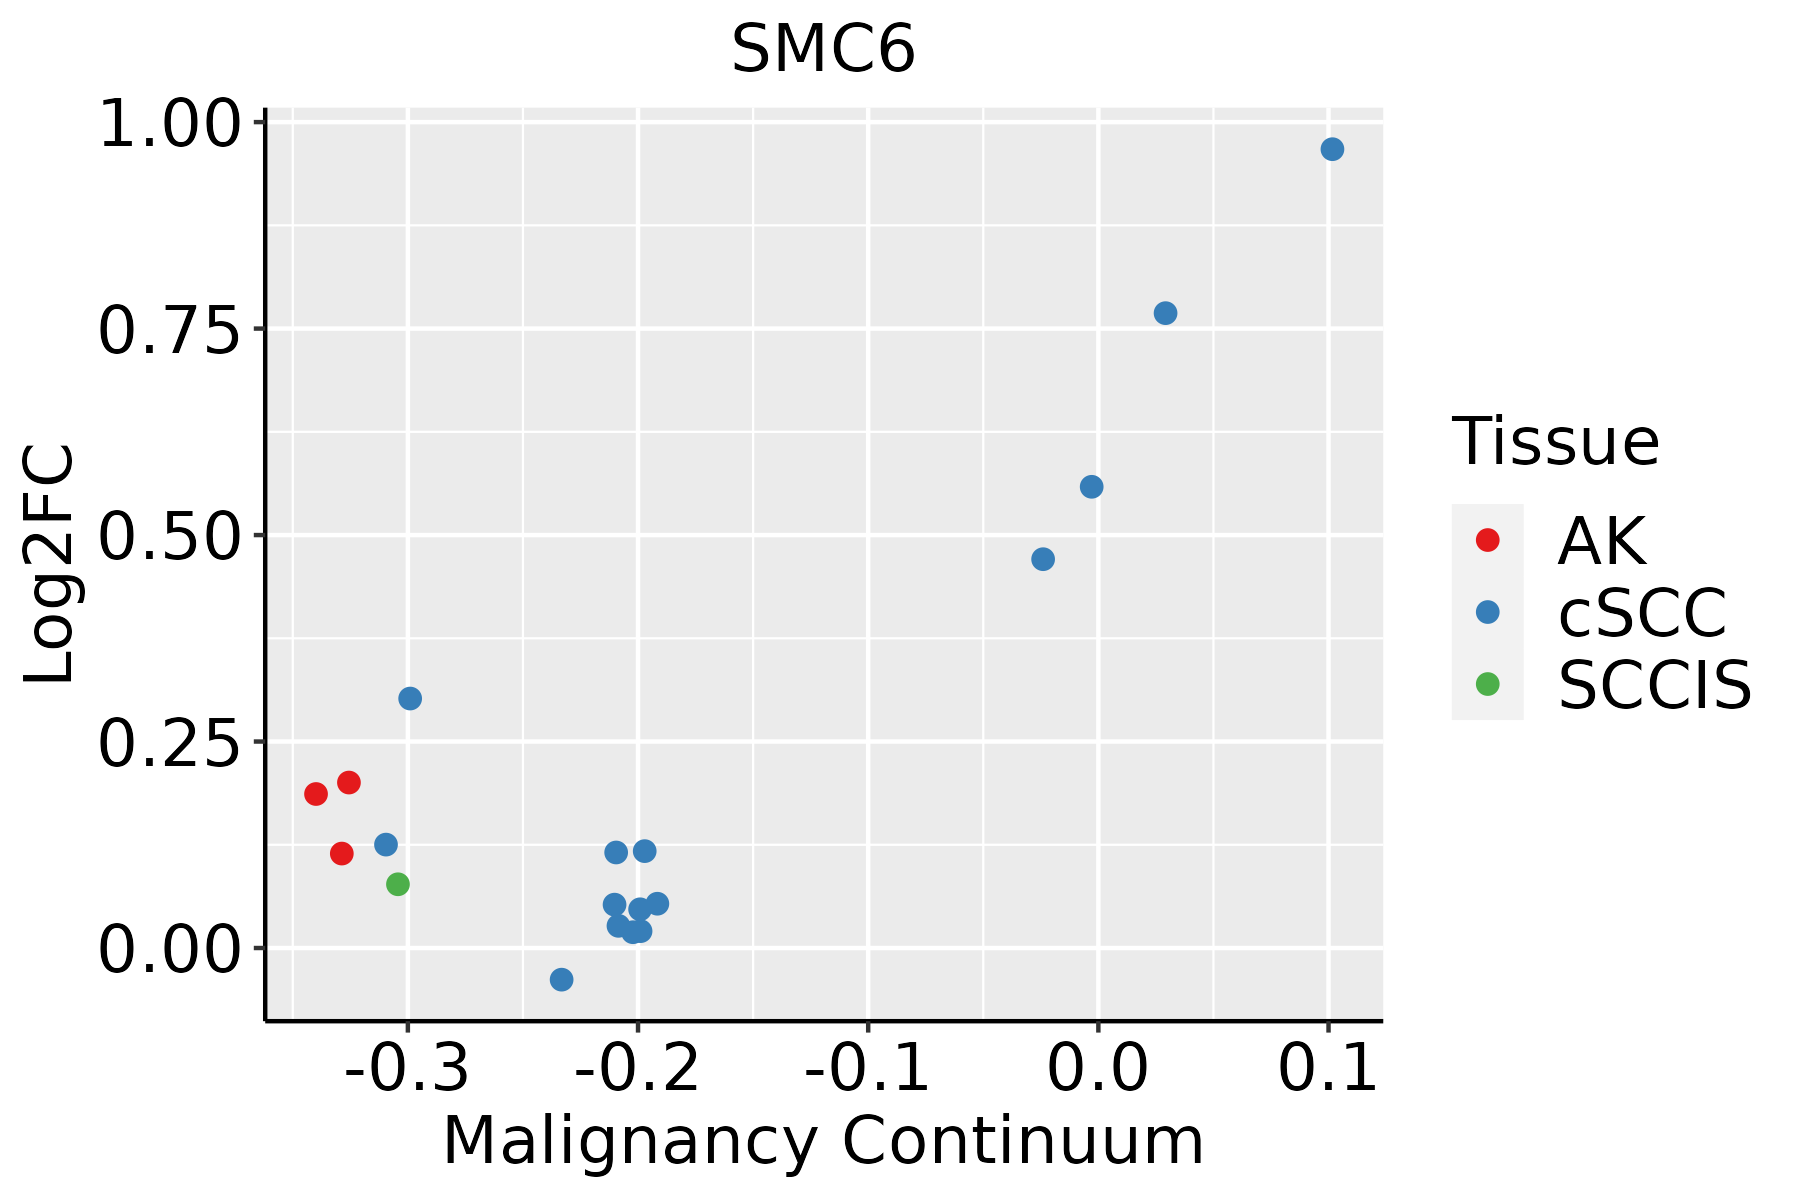 | AK: Actinic keratosis |
| cSCC: Cutaneous squamous cell carcinoma |
| SCCIS:squamous cell carcinoma in situ |
| Thyroid | 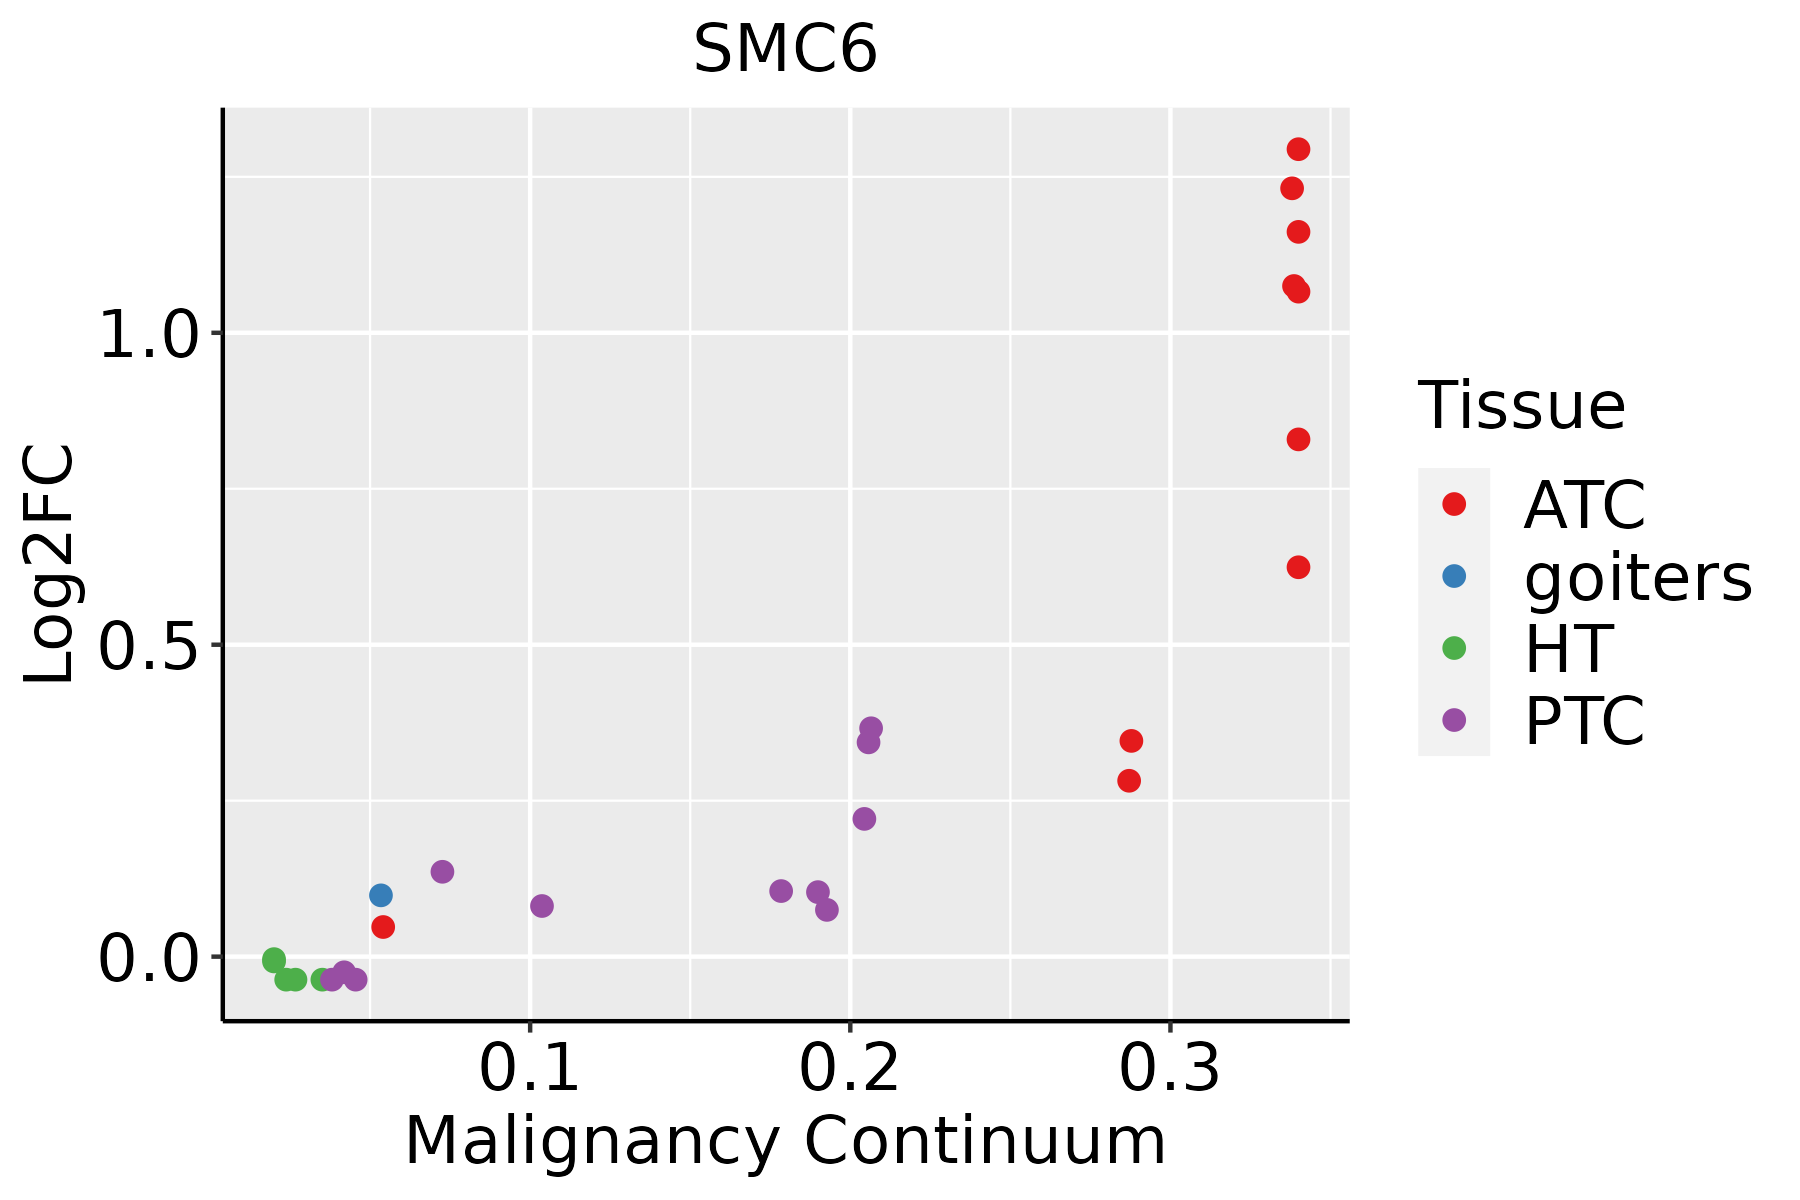 | ATC: Anaplastic thyroid cancer |
| HT: Hashimoto's thyroiditis |
| PTC: Papillary thyroid cancer |
| GO ID | Tissue | Disease Stage | Description | Gene Ratio | Bg Ratio | pvalue | p.adjust | Count |
| GO:00075689 | Cervix | CC | aging | 75/2311 | 339/18723 | 2.75e-07 | 1.13e-05 | 75 |
| GO:00075695 | Cervix | CC | cell aging | 34/2311 | 132/18723 | 1.92e-05 | 3.53e-04 | 34 |
| GO:00903981 | Cervix | CC | cellular senescence | 25/2311 | 93/18723 | 1.11e-04 | 1.40e-03 | 25 |
| GO:00007239 | Cervix | CC | telomere maintenance | 26/2311 | 131/18723 | 9.33e-03 | 4.66e-02 | 26 |
| GO:004217627 | Esophagus | HGIN | regulation of protein catabolic process | 119/2587 | 391/18723 | 8.09e-18 | 2.43e-15 | 119 |
| GO:001049826 | Esophagus | HGIN | proteasomal protein catabolic process | 139/2587 | 490/18723 | 1.20e-17 | 3.41e-15 | 139 |
| GO:004586227 | Esophagus | HGIN | positive regulation of proteolysis | 107/2587 | 372/18723 | 2.61e-14 | 4.60e-12 | 107 |
| GO:004316126 | Esophagus | HGIN | proteasome-mediated ubiquitin-dependent protein catabolic process | 114/2587 | 412/18723 | 7.00e-14 | 1.20e-11 | 114 |
| GO:190336227 | Esophagus | HGIN | regulation of cellular protein catabolic process | 81/2587 | 255/18723 | 1.16e-13 | 1.93e-11 | 81 |
| GO:003497625 | Esophagus | HGIN | response to endoplasmic reticulum stress | 81/2587 | 256/18723 | 1.47e-13 | 2.32e-11 | 81 |
| GO:000989626 | Esophagus | HGIN | positive regulation of catabolic process | 126/2587 | 492/18723 | 1.46e-12 | 2.09e-10 | 126 |
| GO:003133126 | Esophagus | HGIN | positive regulation of cellular catabolic process | 112/2587 | 427/18723 | 5.15e-12 | 6.72e-10 | 112 |
| GO:190305027 | Esophagus | HGIN | regulation of proteolysis involved in cellular protein catabolic process | 70/2587 | 221/18723 | 6.21e-12 | 7.76e-10 | 70 |
| GO:006113627 | Esophagus | HGIN | regulation of proteasomal protein catabolic process | 60/2587 | 187/18723 | 1.10e-10 | 1.12e-08 | 60 |
| GO:004573227 | Esophagus | HGIN | positive regulation of protein catabolic process | 69/2587 | 231/18723 | 1.66e-10 | 1.64e-08 | 69 |
| GO:190336427 | Esophagus | HGIN | positive regulation of cellular protein catabolic process | 51/2587 | 155/18723 | 1.01e-09 | 8.15e-08 | 51 |
| GO:190180020 | Esophagus | HGIN | positive regulation of proteasomal protein catabolic process | 41/2587 | 114/18723 | 2.25e-09 | 1.67e-07 | 41 |
| GO:190305219 | Esophagus | HGIN | positive regulation of proteolysis involved in cellular protein catabolic process | 45/2587 | 133/18723 | 3.55e-09 | 2.53e-07 | 45 |
| GO:003133425 | Esophagus | HGIN | positive regulation of protein-containing complex assembly | 61/2587 | 237/18723 | 7.10e-07 | 3.00e-05 | 61 |
| GO:004325427 | Esophagus | HGIN | regulation of protein-containing complex assembly | 94/2587 | 428/18723 | 2.39e-06 | 8.55e-05 | 94 |
| Hugo Symbol | Variant Class | Variant Classification | dbSNP RS | HGVSc | HGVSp | HGVSp Short | SWISSPROT | BIOTYPE | SIFT | PolyPhen | Tumor Sample Barcode | Tissue | Histology | Sex | Age | Stage | Therapy Types | Drugs | Outcome |
| SMC6 | SNV | Missense_Mutation | novel | c.179N>T | p.Ser60Leu | p.S60L | Q96SB8 | protein_coding | deleterious(0.01) | possibly_damaging(0.783) | TCGA-5L-AAT0-01 | Breast | breast invasive carcinoma | Female | <65 | I/II | Hormone Therapy | tamoxiphen | SD |
| SMC6 | SNV | Missense_Mutation | rs376248274 | c.2819N>A | p.Arg940Gln | p.R940Q | Q96SB8 | protein_coding | tolerated(0.22) | possibly_damaging(0.596) | TCGA-AN-A046-01 | Breast | breast invasive carcinoma | Female | >=65 | I/II | Unknown | Unknown | SD |
| SMC6 | SNV | Missense_Mutation | rs373857118 | c.745N>T | p.Arg249Cys | p.R249C | Q96SB8 | protein_coding | deleterious(0) | benign(0.133) | TCGA-AR-A0TS-01 | Breast | breast invasive carcinoma | Female | <65 | I/II | Chemotherapy | doxorubicin | SD |
| SMC6 | SNV | Missense_Mutation | novel | c.1570N>A | p.Glu524Lys | p.E524K | Q96SB8 | protein_coding | deleterious(0) | probably_damaging(1) | TCGA-BH-A0HF-01 | Breast | breast invasive carcinoma | Female | >=65 | I/II | Hormone Therapy | arimidex | SD |
| SMC6 | SNV | Missense_Mutation | | c.2240A>G | p.Glu747Gly | p.E747G | Q96SB8 | protein_coding | deleterious(0) | possibly_damaging(0.745) | TCGA-BH-A18G-01 | Breast | breast invasive carcinoma | Female | >=65 | I/II | Unknown | Unknown | SD |
| SMC6 | SNV | Missense_Mutation | | c.1694C>T | p.Ser565Phe | p.S565F | Q96SB8 | protein_coding | deleterious(0) | probably_damaging(0.993) | TCGA-EW-A1PB-01 | Breast | breast invasive carcinoma | Female | >=65 | III/IV | Unknown | Unknown | SD |
| SMC6 | SNV | Missense_Mutation | novel | c.1041N>T | p.Met347Ile | p.M347I | Q96SB8 | protein_coding | tolerated(1) | benign(0) | TCGA-S3-A6ZH-01 | Breast | breast invasive carcinoma | Female | <65 | III/IV | Chemotherapy | adriamycin | CR |
| SMC6 | insertion | Frame_Shift_Ins | novel | c.1867_1868insATCTTCTAAGTCAT | p.Val623AspfsTer6 | p.V623Dfs*6 | Q96SB8 | protein_coding | | | TCGA-AQ-A04H-01 | Breast | breast invasive carcinoma | Female | <65 | III/IV | Chemotherapy | taxotere | SD |
| SMC6 | SNV | Missense_Mutation | novel | c.2837A>G | p.Asp946Gly | p.D946G | Q96SB8 | protein_coding | deleterious(0.02) | benign(0.092) | TCGA-2W-A8YY-01 | Cervix | cervical & endocervical cancer | Female | <65 | I/II | Chemotherapy | cisplatin | CR |
| SMC6 | SNV | Missense_Mutation | novel | c.2482A>G | p.Thr828Ala | p.T828A | Q96SB8 | protein_coding | tolerated(0.45) | benign(0.05) | TCGA-2W-A8YY-01 | Cervix | cervical & endocervical cancer | Female | <65 | I/II | Chemotherapy | cisplatin | CR |


