
|
|||||
|
 | |
| |
| |
| |
| |
| |
|
Gene: SLC30A7 |
Gene summary for SLC30A7 |
| Gene information | Species | Human | Gene symbol | SLC30A7 | Gene ID | 148867 |
| Gene name | solute carrier family 30 member 7 | |
| Gene Alias | ZNT7 | |
| Cytomap | 1p21.2 | |
| Gene Type | protein-coding | GO ID | GO:0000041 | UniProtAcc | Q8NEW0 |
Top |
Malignant transformation analysis |
| Identification of the aberrant gene expression in precancerous and cancerous lesions by comparing the gene expression of stem-like cells in diseased tissues with normal stem cells |
| Entrez ID | Symbol | Replicates | Species | Organ | Tissue | Adj P-value | Log2FC | Malignancy |
| 148867 | SLC30A7 | P54T-E | Human | Esophagus | ESCC | 2.79e-06 | 1.69e-01 | 0.0975 |
| 148867 | SLC30A7 | P57T-E | Human | Esophagus | ESCC | 2.20e-14 | 1.02e-01 | 0.0926 |
| 148867 | SLC30A7 | P61T-E | Human | Esophagus | ESCC | 2.10e-14 | 2.11e-01 | 0.099 |
| 148867 | SLC30A7 | P62T-E | Human | Esophagus | ESCC | 7.12e-38 | 7.06e-01 | 0.1302 |
| 148867 | SLC30A7 | P65T-E | Human | Esophagus | ESCC | 1.47e-11 | 1.38e-01 | 0.0978 |
| 148867 | SLC30A7 | P74T-E | Human | Esophagus | ESCC | 1.03e-14 | 3.80e-01 | 0.1479 |
| 148867 | SLC30A7 | P75T-E | Human | Esophagus | ESCC | 2.29e-20 | 3.66e-01 | 0.1125 |
| 148867 | SLC30A7 | P76T-E | Human | Esophagus | ESCC | 3.65e-16 | 2.60e-01 | 0.1207 |
| 148867 | SLC30A7 | P79T-E | Human | Esophagus | ESCC | 1.04e-19 | 2.66e-01 | 0.1154 |
| 148867 | SLC30A7 | P80T-E | Human | Esophagus | ESCC | 4.76e-23 | 5.54e-01 | 0.155 |
| 148867 | SLC30A7 | P82T-E | Human | Esophagus | ESCC | 1.27e-06 | 4.06e-01 | 0.1072 |
| 148867 | SLC30A7 | P83T-E | Human | Esophagus | ESCC | 4.04e-14 | 4.72e-01 | 0.1738 |
| 148867 | SLC30A7 | P89T-E | Human | Esophagus | ESCC | 1.98e-05 | 2.89e-01 | 0.1752 |
| 148867 | SLC30A7 | P91T-E | Human | Esophagus | ESCC | 4.39e-10 | 9.46e-01 | 0.1828 |
| 148867 | SLC30A7 | P104T-E | Human | Esophagus | ESCC | 4.62e-05 | 3.41e-01 | 0.0931 |
| 148867 | SLC30A7 | P107T-E | Human | Esophagus | ESCC | 8.09e-15 | 2.63e-01 | 0.171 |
| 148867 | SLC30A7 | P126T-E | Human | Esophagus | ESCC | 9.23e-03 | 4.00e-01 | 0.1125 |
| 148867 | SLC30A7 | P127T-E | Human | Esophagus | ESCC | 4.04e-14 | 2.56e-01 | 0.0826 |
| 148867 | SLC30A7 | P128T-E | Human | Esophagus | ESCC | 1.05e-18 | 5.88e-01 | 0.1241 |
| 148867 | SLC30A7 | P130T-E | Human | Esophagus | ESCC | 4.85e-33 | 6.94e-01 | 0.1676 |
| Page: 1 2 3 4 5 6 |
| Tissue | Expression Dynamics | Abbreviation |
| Esophagus | 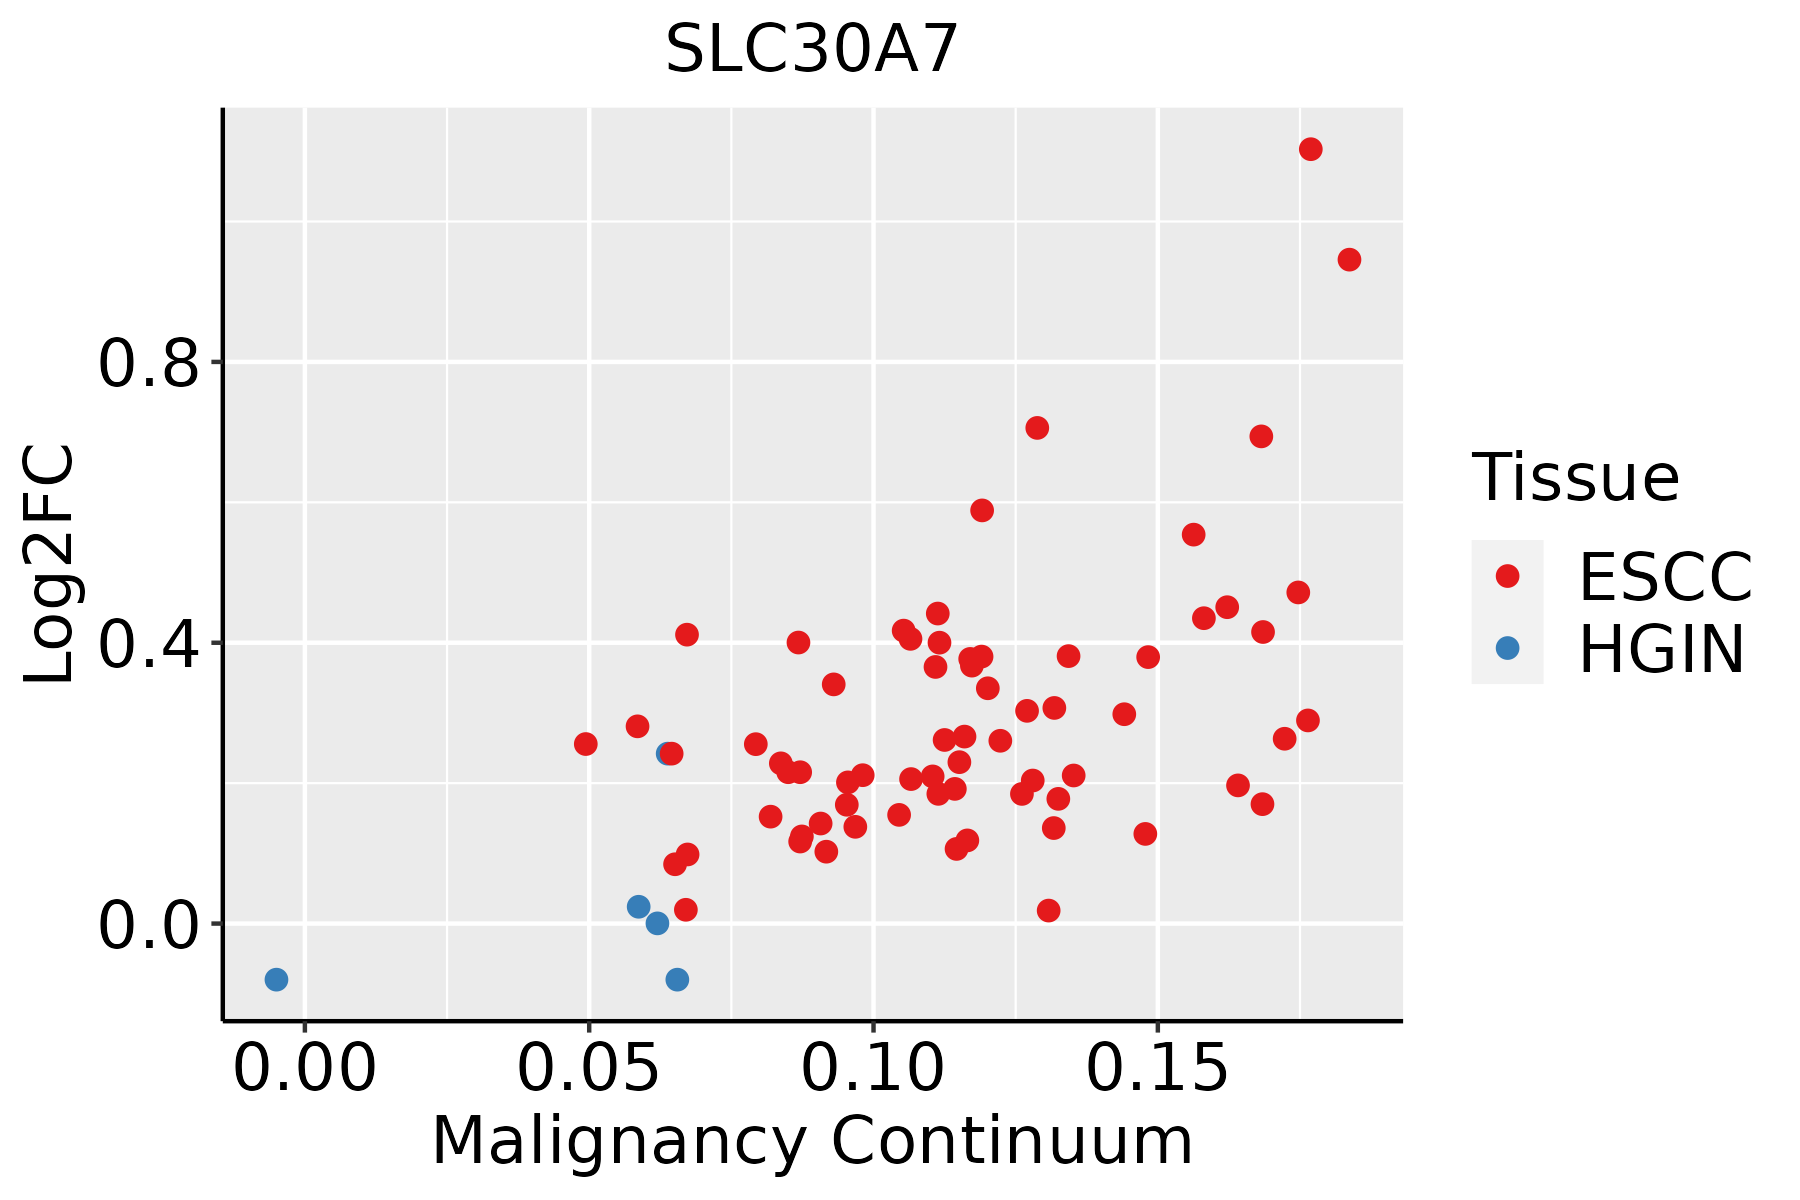 | ESCC: Esophageal squamous cell carcinoma |
| HGIN: High-grade intraepithelial neoplasias | ||
| LGIN: Low-grade intraepithelial neoplasias | ||
| Liver | 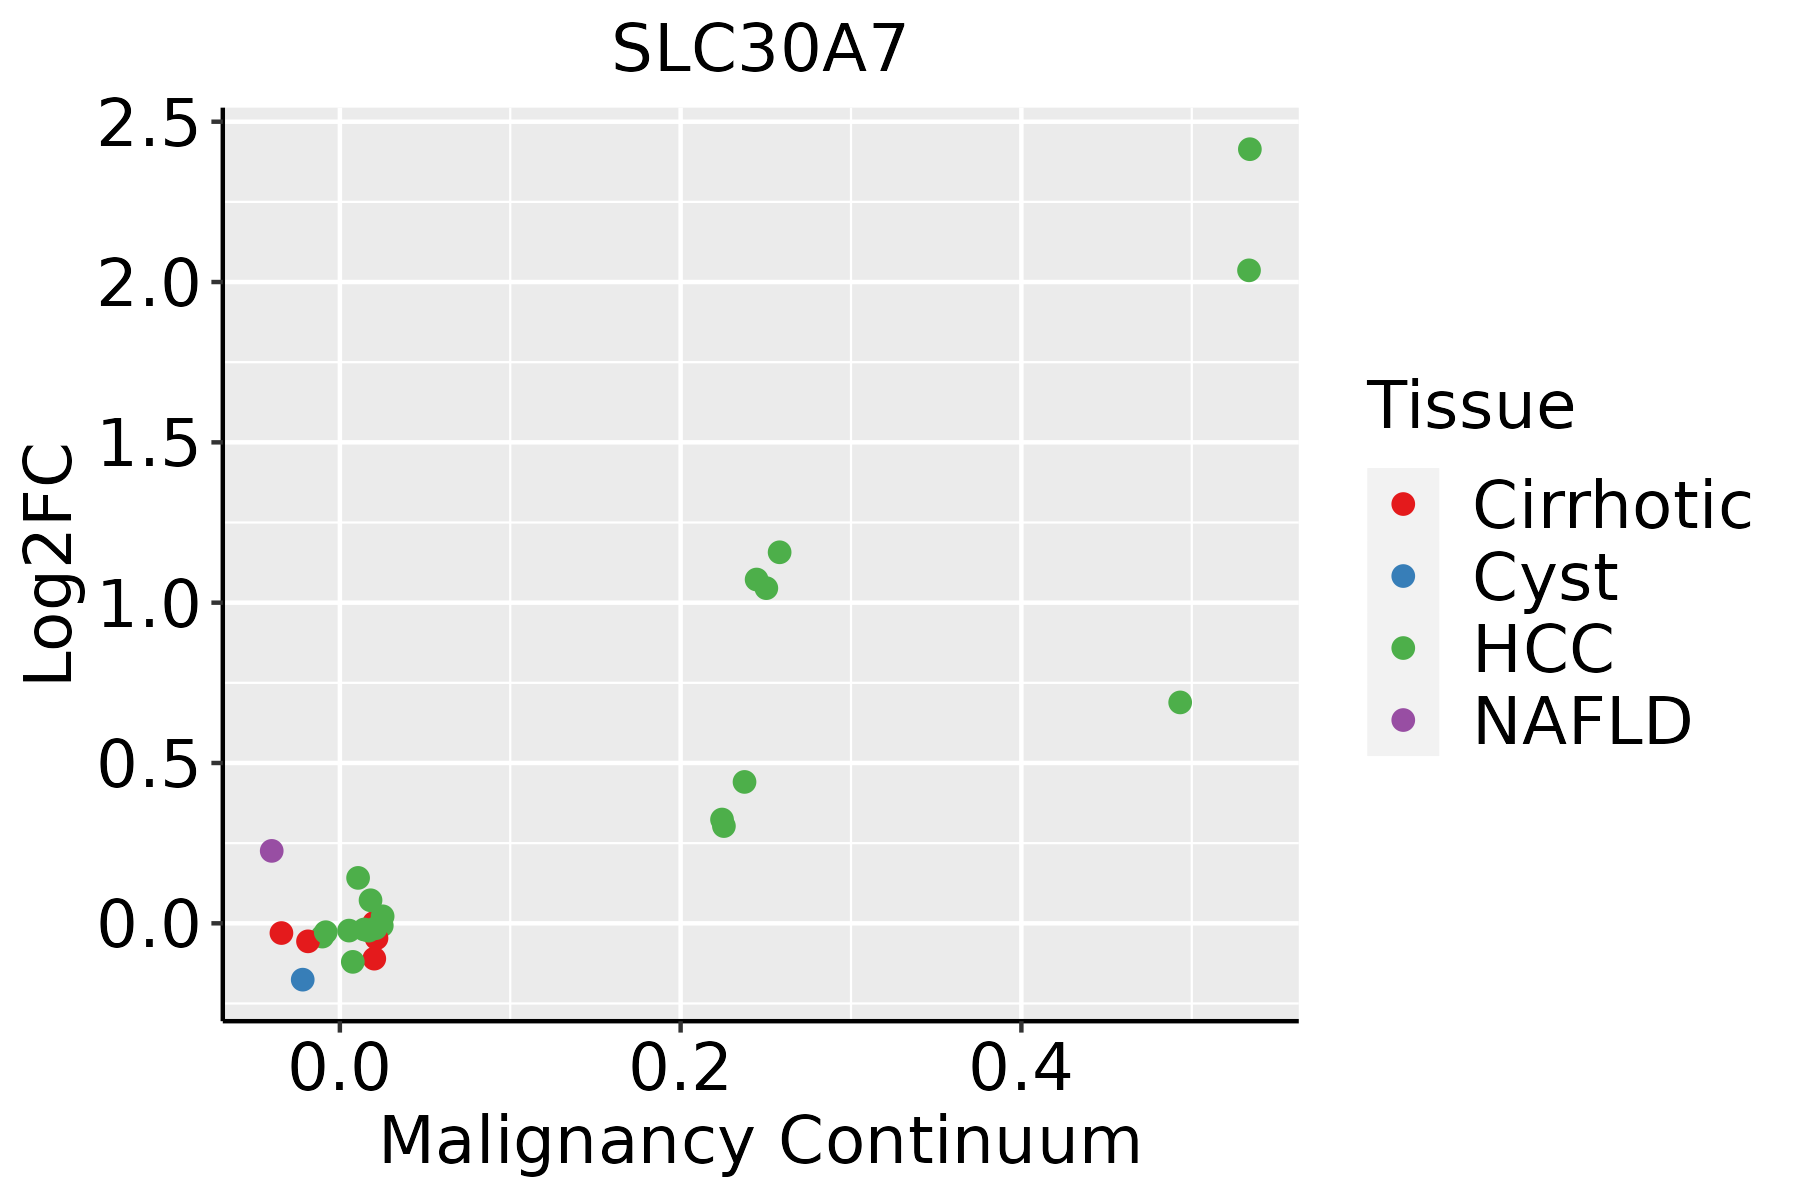 | HCC: Hepatocellular carcinoma |
| NAFLD: Non-alcoholic fatty liver disease | ||
| Oral Cavity |  | EOLP: Erosive Oral lichen planus |
| LP: leukoplakia | ||
| NEOLP: Non-erosive oral lichen planus | ||
| OSCC: Oral squamous cell carcinoma | ||
| Thyroid | 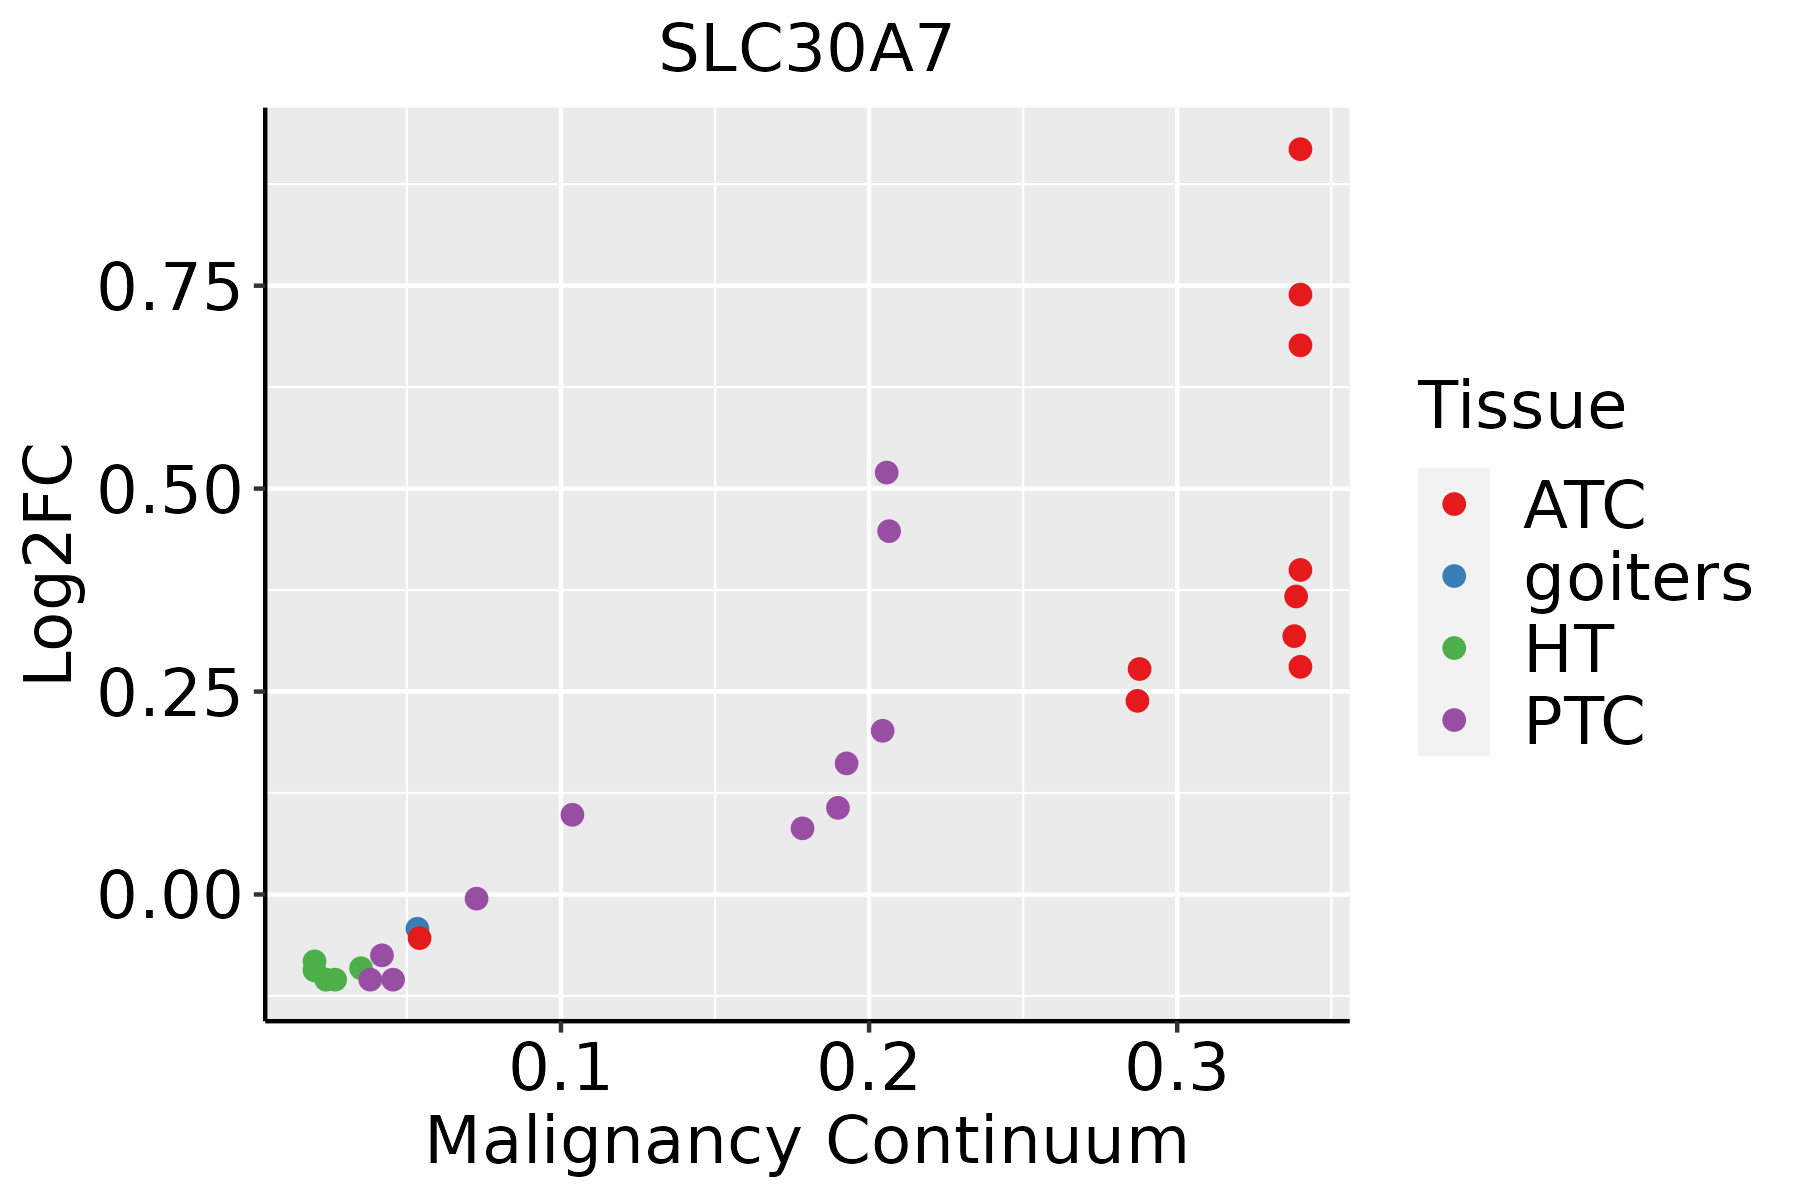 | ATC: Anaplastic thyroid cancer |
| HT: Hashimoto's thyroiditis | ||
| PTC: Papillary thyroid cancer |
| ∗log2FC in expression of this searched gene in stem-like cells from each diseased tissue sample relative to stem-like cells in normal samples in each tissue plotted against the malignancy continuum. Samples are colored based on if they are from different disease stage. |
Top |
Malignant transformation related pathway analysis |
| Find out the enriched GO biological processes and KEGG pathways involved in transition from healthy to precancer to cancer |
| Tissue | Disease Stage | Enriched GO biological Processes |
| Colorectum | AD |  |
| Colorectum | SER |  |
| Colorectum | MSS |  |
| Colorectum | MSI-H |  |
| Colorectum | FAP |  |
| ∗Top 15 enriched GO BP terms are showed in the bar plot of each disease state in each tissue. Each row represents a significant GO biological process which is colored according to the -log10(p.adjust). |
| Page: 1 2 3 4 5 6 7 8 9 |
| GO ID | Tissue | Disease Stage | Description | Gene Ratio | Bg Ratio | pvalue | p.adjust | Count |
| GO:0051235110 | Esophagus | ESCC | maintenance of location | 200/8552 | 327/18723 | 1.01e-08 | 2.02e-07 | 200 |
| GO:005507617 | Esophagus | ESCC | transition metal ion homeostasis | 87/8552 | 138/18723 | 2.85e-05 | 2.37e-04 | 87 |
| GO:0051651111 | Esophagus | ESCC | maintenance of location in cell | 126/8552 | 214/18723 | 6.57e-05 | 5.00e-04 | 126 |
| GO:00469169 | Esophagus | ESCC | cellular transition metal ion homeostasis | 70/8552 | 115/18723 | 7.28e-04 | 3.79e-03 | 70 |
| GO:00550766 | Liver | Cirrhotic | transition metal ion homeostasis | 59/4634 | 138/18723 | 2.59e-06 | 4.65e-05 | 59 |
| GO:005123511 | Liver | Cirrhotic | maintenance of location | 117/4634 | 327/18723 | 4.78e-06 | 7.86e-05 | 117 |
| GO:00469164 | Liver | Cirrhotic | cellular transition metal ion homeostasis | 48/4634 | 115/18723 | 4.51e-05 | 5.30e-04 | 48 |
| GO:00516517 | Liver | Cirrhotic | maintenance of location in cell | 76/4634 | 214/18723 | 2.66e-04 | 2.37e-03 | 76 |
| GO:00068823 | Liver | Cirrhotic | cellular zinc ion homeostasis | 17/4634 | 38/18723 | 5.62e-03 | 2.84e-02 | 17 |
| GO:00550693 | Liver | Cirrhotic | zinc ion homeostasis | 17/4634 | 40/18723 | 1.04e-02 | 4.61e-02 | 17 |
| GO:005123521 | Liver | HCC | maintenance of location | 185/7958 | 327/18723 | 1.70e-07 | 3.12e-06 | 185 |
| GO:005165112 | Liver | HCC | maintenance of location in cell | 119/7958 | 214/18723 | 7.11e-05 | 6.39e-04 | 119 |
| GO:005507612 | Liver | HCC | transition metal ion homeostasis | 81/7958 | 138/18723 | 8.87e-05 | 7.72e-04 | 81 |
| GO:004691611 | Liver | HCC | cellular transition metal ion homeostasis | 67/7958 | 115/18723 | 4.64e-04 | 3.08e-03 | 67 |
| GO:00000411 | Liver | HCC | transition metal ion transport | 59/7958 | 105/18723 | 3.18e-03 | 1.47e-02 | 59 |
| GO:000688212 | Liver | HCC | cellular zinc ion homeostasis | 24/7958 | 38/18723 | 8.20e-03 | 3.22e-02 | 24 |
| GO:005123518 | Oral cavity | OSCC | maintenance of location | 182/7305 | 327/18723 | 6.16e-10 | 1.58e-08 | 182 |
| GO:005165120 | Oral cavity | OSCC | maintenance of location in cell | 121/7305 | 214/18723 | 1.39e-07 | 2.32e-06 | 121 |
| GO:005507610 | Oral cavity | OSCC | transition metal ion homeostasis | 81/7305 | 138/18723 | 2.13e-06 | 2.72e-05 | 81 |
| GO:00469168 | Oral cavity | OSCC | cellular transition metal ion homeostasis | 64/7305 | 115/18723 | 2.13e-04 | 1.40e-03 | 64 |
| Page: 1 2 |
| Pathway ID | Tissue | Disease Stage | Description | Gene Ratio | Bg Ratio | pvalue | p.adjust | qvalue | Count |
| Page: 1 |
Top |
Cell-cell communication analysis |
| Identification of potential cell-cell interactions between two cell types and their ligand-receptor pairs for different disease states |
| Ligand | Receptor | LRpair | Pathway | Tissue | Disease Stage |
| Page: 1 |
Top |
Single-cell gene regulatory network inference analysis |
| Find out the significant the regulons (TFs) and the target genes of each regulon across cell types for different disease states |
| TF | Cell Type | Tissue | Disease Stage | Target Gene | RSS | Regulon Activity |
| ∗The dot plots of a searched regulon are shown for all cell subpopulations in each disease state of each tissue based on the regulon specific score inferred using pySCENIC and by calculating the average expression. |
| Page: 1 |
Top |
Somatic mutation of malignant transformation related genes |
| Annotation of somatic variants for genes involved in malignant transformation |
| Hugo Symbol | Variant Class | Variant Classification | dbSNP RS | HGVSc | HGVSp | HGVSp Short | SWISSPROT | BIOTYPE | SIFT | PolyPhen | Tumor Sample Barcode | Tissue | Histology | Sex | Age | Stage | Therapy Types | Drugs | Outcome |
| SLC30A7 | SNV | Missense_Mutation | novel | c.389N>T | p.Ala130Val | p.A130V | Q8NEW0 | protein_coding | tolerated(0.29) | possibly_damaging(0.511) | TCGA-AO-A128-01 | Breast | breast invasive carcinoma | Female | <65 | I/II | Chemotherapy | doxorubicin | SD |
| SLC30A7 | SNV | Missense_Mutation | c.382N>C | p.Glu128Gln | p.E128Q | Q8NEW0 | protein_coding | tolerated(0.09) | probably_damaging(0.995) | TCGA-C8-A275-01 | Breast | breast invasive carcinoma | Female | <65 | I/II | Unknown | Unknown | SD | |
| SLC30A7 | SNV | Missense_Mutation | c.689G>A | p.Ser230Asn | p.S230N | Q8NEW0 | protein_coding | tolerated(0.7) | benign(0.216) | TCGA-A6-6781-01 | Colorectum | colon adenocarcinoma | Male | <65 | III/IV | Chemotherapy | oxaliplatin | SD | |
| SLC30A7 | SNV | Missense_Mutation | novel | c.879A>C | p.Leu293Phe | p.L293F | Q8NEW0 | protein_coding | deleterious(0) | probably_damaging(1) | TCGA-AZ-4315-01 | Colorectum | colon adenocarcinoma | Male | <65 | I/II | Unknown | Unknown | SD |
| SLC30A7 | SNV | Missense_Mutation | novel | c.1070A>C | p.Asn357Thr | p.N357T | Q8NEW0 | protein_coding | tolerated(0.64) | benign(0.137) | TCGA-AG-A002-01 | Colorectum | rectum adenocarcinoma | Male | <65 | I/II | Unknown | Unknown | SD |
| SLC30A7 | insertion | Frame_Shift_Ins | novel | c.1072_1073insG | p.Ile358SerfsTer15 | p.I358Sfs*15 | Q8NEW0 | protein_coding | TCGA-NH-A6GC-01 | Colorectum | colon adenocarcinoma | Female | >=65 | I/II | Chemotherapy | fluorouracil | SD | ||
| SLC30A7 | SNV | Missense_Mutation | rs371349673 | c.571N>A | p.Asp191Asn | p.D191N | Q8NEW0 | protein_coding | tolerated(0.38) | benign(0.045) | TCGA-AP-A1DV-01 | Endometrium | uterine corpus endometrioid carcinoma | Female | <65 | I/II | Unknown | Unknown | SD |
| SLC30A7 | SNV | Missense_Mutation | rs777133764 | c.887N>A | p.Arg296Lys | p.R296K | Q8NEW0 | protein_coding | tolerated(0.1) | probably_damaging(0.999) | TCGA-AP-A1DV-01 | Endometrium | uterine corpus endometrioid carcinoma | Female | <65 | I/II | Unknown | Unknown | SD |
| SLC30A7 | SNV | Missense_Mutation | rs371349673 | c.571N>A | p.Asp191Asn | p.D191N | Q8NEW0 | protein_coding | tolerated(0.38) | benign(0.045) | TCGA-AX-A0J0-01 | Endometrium | uterine corpus endometrioid carcinoma | Female | <65 | I/II | Unknown | Unknown | SD |
| SLC30A7 | SNV | Missense_Mutation | c.887N>T | p.Arg296Ile | p.R296I | Q8NEW0 | protein_coding | deleterious(0) | probably_damaging(1) | TCGA-AX-A0J0-01 | Endometrium | uterine corpus endometrioid carcinoma | Female | <65 | I/II | Unknown | Unknown | SD |
| Page: 1 2 3 4 |
Top |
Related drugs of malignant transformation related genes |
| Identification of chemicals and drugs interact with genes involved in malignant transfromation |
| (DGIdb 4.0) |
| Entrez ID | Symbol | Category | Interaction Types | Drug Claim Name | Drug Name | PMIDs |
| Page: 1 |

Copyright 2023-Present -The University of Texas Health Science Center at Houston |