| Tissue | Expression Dynamics | Abbreviation |
| Colorectum (GSE201348) |  | FAP: Familial adenomatous polyposis |
| CRC: Colorectal cancer |
| Colorectum (HTA11) |  | AD: Adenomas |
| SER: Sessile serrated lesions |
| MSI-H: Microsatellite-high colorectal cancer |
| MSS: Microsatellite stable colorectal cancer |
| Esophagus | 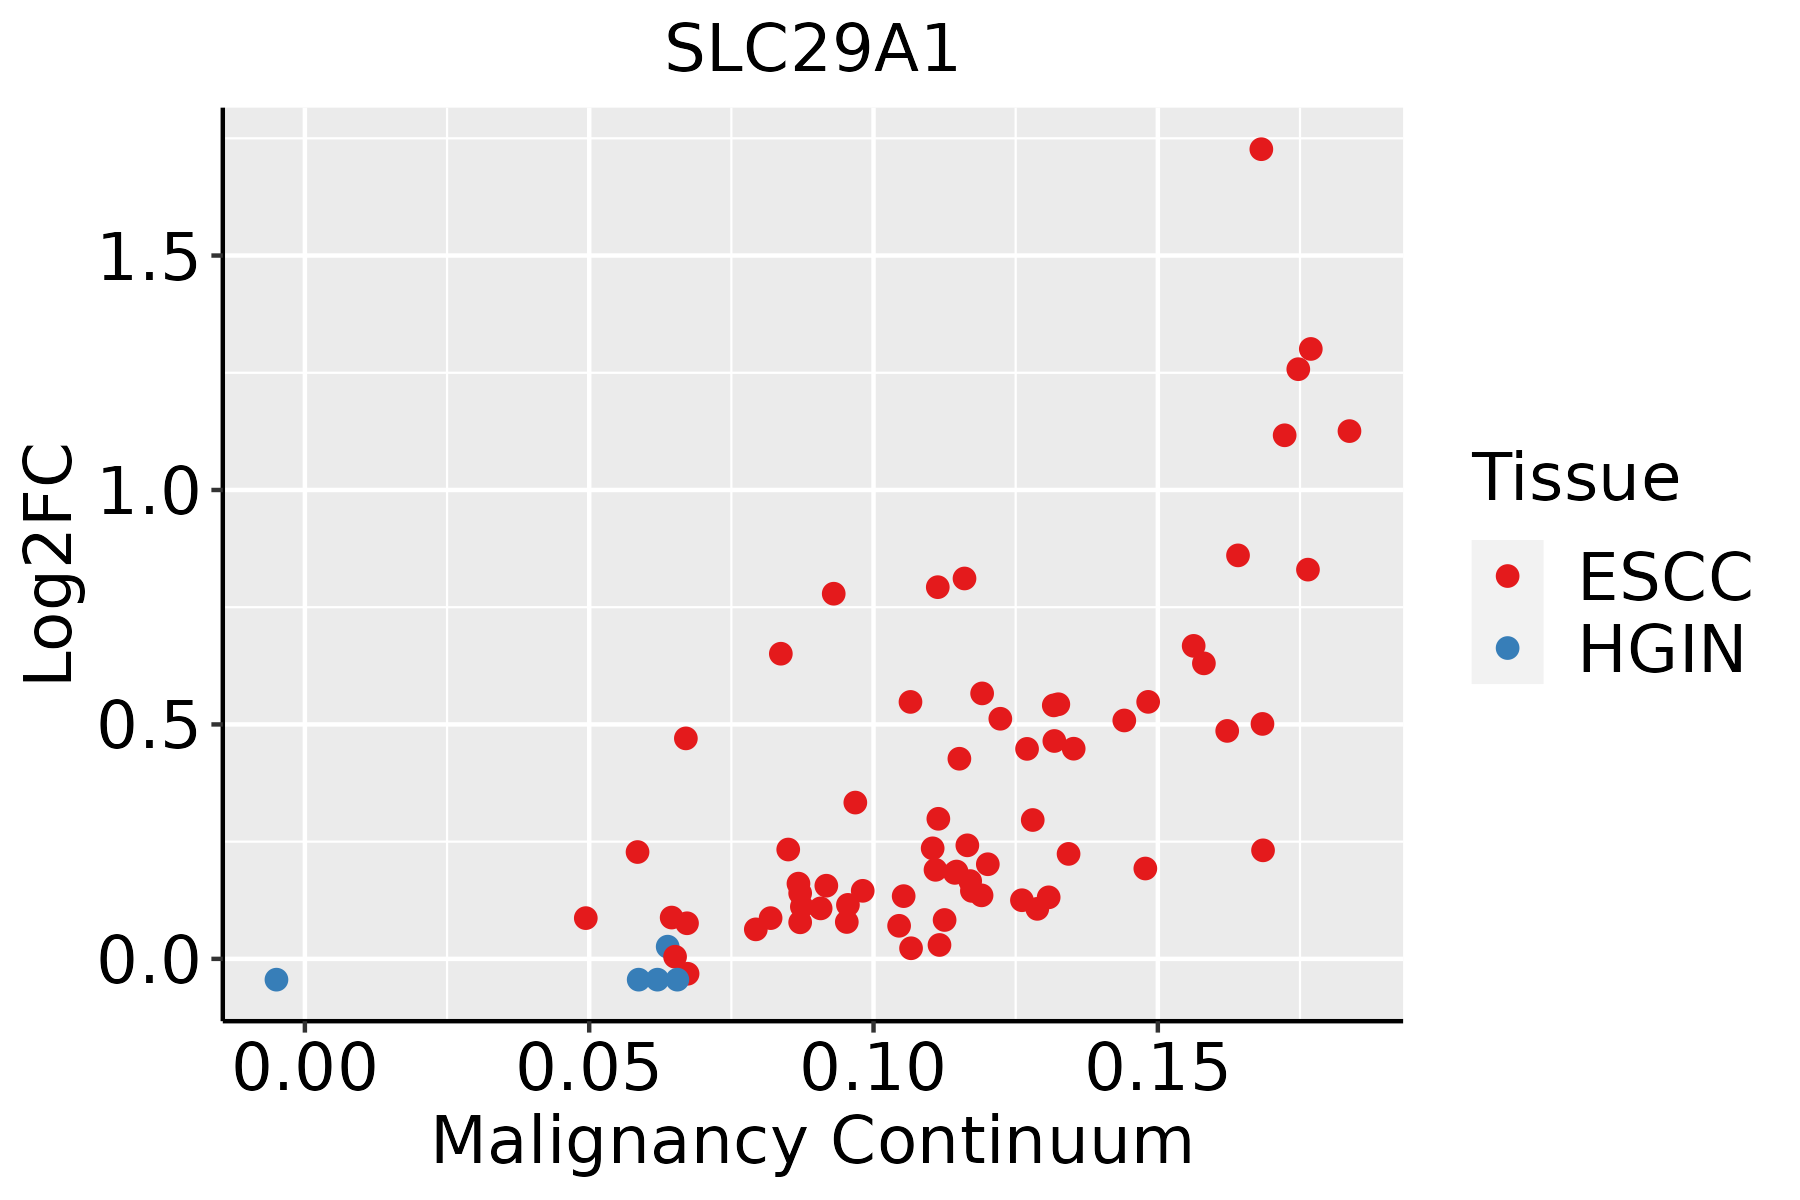 | ESCC: Esophageal squamous cell carcinoma |
| HGIN: High-grade intraepithelial neoplasias |
| LGIN: Low-grade intraepithelial neoplasias |
| Liver |  | HCC: Hepatocellular carcinoma |
| NAFLD: Non-alcoholic fatty liver disease |
| Oral Cavity |  | EOLP: Erosive Oral lichen planus |
| LP: leukoplakia |
| NEOLP: Non-erosive oral lichen planus |
| OSCC: Oral squamous cell carcinoma |
| Thyroid | 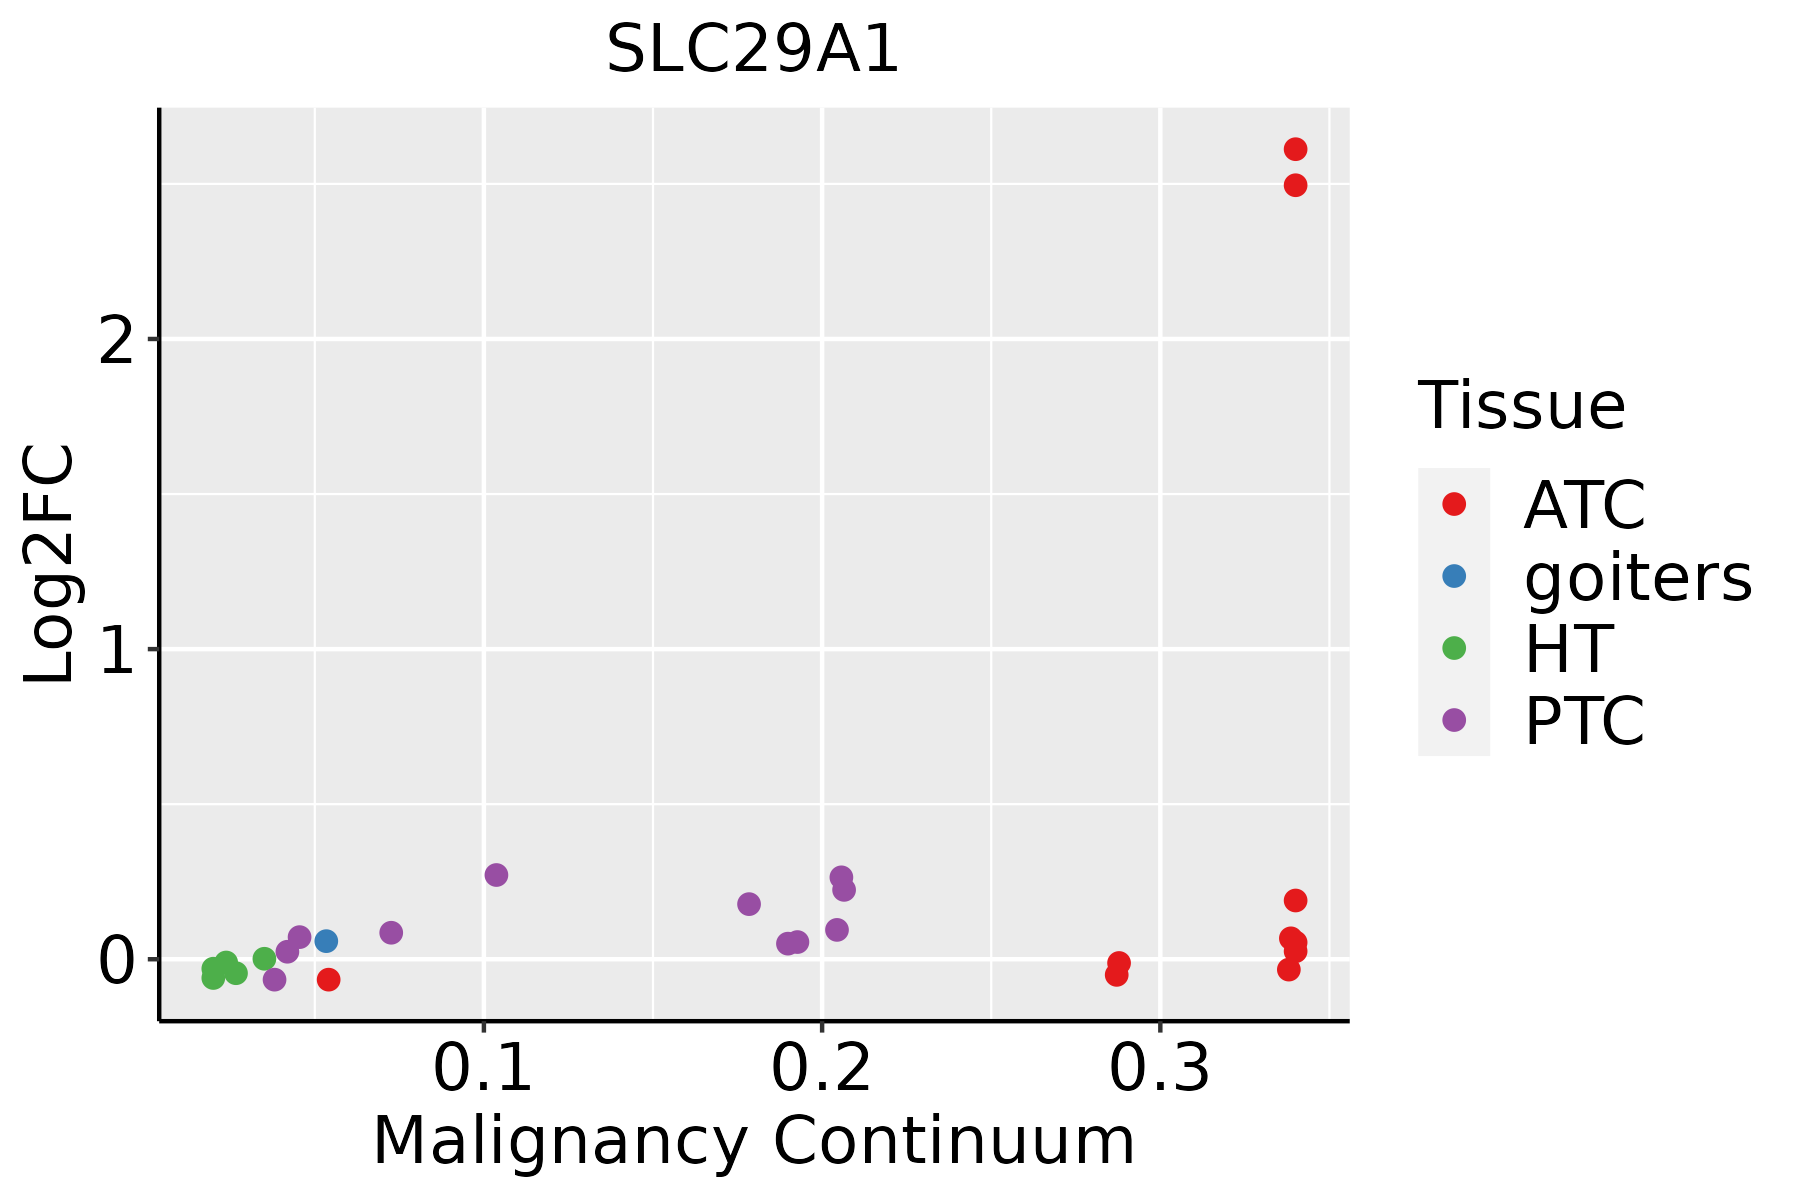 | ATC: Anaplastic thyroid cancer |
| HT: Hashimoto's thyroiditis |
| PTC: Papillary thyroid cancer |
| GO ID | Tissue | Disease Stage | Description | Gene Ratio | Bg Ratio | pvalue | p.adjust | Count |
| GO:0048732 | Colorectum | AD | gland development | 149/3918 | 436/18723 | 6.07e-11 | 6.33e-09 | 149 |
| GO:0009743 | Colorectum | AD | response to carbohydrate | 86/3918 | 253/18723 | 8.43e-07 | 2.90e-05 | 86 |
| GO:0030879 | Colorectum | AD | mammary gland development | 53/3918 | 137/18723 | 1.46e-06 | 4.58e-05 | 53 |
| GO:0034284 | Colorectum | AD | response to monosaccharide | 76/3918 | 225/18723 | 4.64e-06 | 1.23e-04 | 76 |
| GO:0033500 | Colorectum | AD | carbohydrate homeostasis | 84/3918 | 259/18723 | 9.10e-06 | 2.15e-04 | 84 |
| GO:0009746 | Colorectum | AD | response to hexose | 73/3918 | 219/18723 | 1.20e-05 | 2.65e-04 | 73 |
| GO:0009749 | Colorectum | AD | response to glucose | 71/3918 | 212/18723 | 1.31e-05 | 2.85e-04 | 71 |
| GO:0042593 | Colorectum | AD | glucose homeostasis | 83/3918 | 258/18723 | 1.44e-05 | 3.11e-04 | 83 |
| GO:0001678 | Colorectum | AD | cellular glucose homeostasis | 60/3918 | 172/18723 | 1.49e-05 | 3.18e-04 | 60 |
| GO:0015931 | Colorectum | AD | nucleobase-containing compound transport | 73/3918 | 222/18723 | 2.02e-05 | 4.10e-04 | 73 |
| GO:0071322 | Colorectum | AD | cellular response to carbohydrate stimulus | 56/3918 | 163/18723 | 4.61e-05 | 7.97e-04 | 56 |
| GO:0071333 | Colorectum | AD | cellular response to glucose stimulus | 52/3918 | 151/18723 | 7.88e-05 | 1.25e-03 | 52 |
| GO:0071331 | Colorectum | AD | cellular response to hexose stimulus | 52/3918 | 153/18723 | 1.16e-04 | 1.71e-03 | 52 |
| GO:0071326 | Colorectum | AD | cellular response to monosaccharide stimulus | 52/3918 | 154/18723 | 1.40e-04 | 1.98e-03 | 52 |
| GO:0050878 | Colorectum | AD | regulation of body fluid levels | 108/3918 | 379/18723 | 2.54e-04 | 3.20e-03 | 108 |
| GO:0070482 | Colorectum | AD | response to oxygen levels | 99/3918 | 347/18723 | 4.29e-04 | 4.82e-03 | 99 |
| GO:0007589 | Colorectum | AD | body fluid secretion | 33/3918 | 93/18723 | 8.26e-04 | 8.13e-03 | 33 |
| GO:0071453 | Colorectum | AD | cellular response to oxygen levels | 55/3918 | 177/18723 | 9.48e-04 | 8.96e-03 | 55 |
| GO:0001666 | Colorectum | AD | response to hypoxia | 86/3918 | 307/18723 | 1.77e-03 | 1.46e-02 | 86 |
| GO:0036293 | Colorectum | AD | response to decreased oxygen levels | 88/3918 | 322/18723 | 3.42e-03 | 2.49e-02 | 88 |
| Hugo Symbol | Variant Class | Variant Classification | dbSNP RS | HGVSc | HGVSp | HGVSp Short | SWISSPROT | BIOTYPE | SIFT | PolyPhen | Tumor Sample Barcode | Tissue | Histology | Sex | Age | Stage | Therapy Types | Drugs | Outcome |
| SLC29A1 | insertion | In_Frame_Ins | novel | c.1052_1053insGTTTCCAGCCGTGACTGTTGAGGTCAAGTCCAGCATCGCAGGCAGCAG | p.Phe351delinsLeuPheProAlaValThrValGluValLysSerSerIleAlaGlySerSer | p.F351delinsLFPAVTVEVKSSIAGSS | Q99808 | protein_coding | | | TCGA-A2-A0CP-01 | Breast | breast invasive carcinoma | Female | <65 | I/II | Chemotherapy | cytoxan | SD |
| SLC29A1 | insertion | In_Frame_Ins | novel | c.683_684insTGCCTCCACCACCTGCAGAACCCTCTTGCCTTCAGC | p.Arg228_Leu229insAlaSerThrThrCysArgThrLeuLeuProSerAla | p.R228_L229insASTTCRTLLPSA | Q99808 | protein_coding | | | TCGA-A8-A09D-01 | Breast | breast invasive carcinoma | Female | <65 | I/II | Chemotherapy | doxorubicin | CR |
| SLC29A1 | insertion | Frame_Shift_Ins | novel | c.126_127insTGGGAGTTTTTCCTTCTGCT | p.Leu43TrpfsTer21 | p.L43Wfs*21 | Q99808 | protein_coding | | | TCGA-AN-A0FS-01 | Breast | breast invasive carcinoma | Female | <65 | I/II | Unknown | Unknown | SD |
| SLC29A1 | deletion | Frame_Shift_Del | | c.134_173delTGTCCCAGAATGTGTCCTTGGTCACTGCTGAACTGAGCAA | p.Met45ArgfsTer27 | p.M45Rfs*27 | Q99808 | protein_coding | | | TCGA-AO-A0J6-01 | Breast | breast invasive carcinoma | Female | <65 | I/II | Chemotherapy | doxorubicin | SD |
| SLC29A1 | SNV | Missense_Mutation | | c.214G>C | p.Glu72Gln | p.E72Q | Q99808 | protein_coding | tolerated(0.31) | benign(0.009) | TCGA-Q1-A73O-01 | Cervix | cervical & endocervical cancer | Female | <65 | I/II | Chemotherapy | cisplatin | CR |
| SLC29A1 | SNV | Missense_Mutation | | c.112T>C | p.Tyr38His | p.Y38H | Q99808 | protein_coding | deleterious(0.02) | probably_damaging(0.999) | TCGA-AA-A00N-01 | Colorectum | colon adenocarcinoma | Male | >=65 | I/II | Unknown | Unknown | PD |
| SLC29A1 | SNV | Missense_Mutation | | c.520N>C | p.Ala174Pro | p.A174P | Q99808 | protein_coding | deleterious(0.01) | probably_damaging(0.98) | TCGA-CM-6162-01 | Colorectum | colon adenocarcinoma | Female | <65 | III/IV | Chemotherapy | oxaliplatin | SD |
| SLC29A1 | SNV | Missense_Mutation | novel | c.641N>A | p.Ala214Asp | p.A214D | Q99808 | protein_coding | deleterious(0) | benign(0.202) | TCGA-AJ-A3BH-01 | Endometrium | uterine corpus endometrioid carcinoma | Female | Unknown | I/II | Unknown | Unknown | SD |
| SLC29A1 | SNV | Missense_Mutation | novel | c.533N>A | p.Ser178Asn | p.S178N | Q99808 | protein_coding | deleterious(0) | probably_damaging(1) | TCGA-AP-A051-01 | Endometrium | uterine corpus endometrioid carcinoma | Female | >=65 | I/II | Unknown | Unknown | SD |
| SLC29A1 | SNV | Missense_Mutation | | c.793N>A | p.Glu265Lys | p.E265K | Q99808 | protein_coding | tolerated(0.54) | benign(0.007) | TCGA-AP-A0LM-01 | Endometrium | uterine corpus endometrioid carcinoma | Female | <65 | III/IV | Chemotherapy | cisplatin | SD |
| Entrez ID | Symbol | Category | Interaction Types | Drug Claim Name | Drug Name | PMIDs |
| 2030 | SLC29A1 | TRANSPORTER, EXTERNAL SIDE OF PLASMA MEMBRANE, DRUGGABLE GENOME | | gemcitabine | GEMCITABINE | 25162786,20665488,22705007,24475233,24361227 |
| 2030 | SLC29A1 | TRANSPORTER, EXTERNAL SIDE OF PLASMA MEMBRANE, DRUGGABLE GENOME | | paclitaxel | PACLITAXEL | 24361227 |
| 2030 | SLC29A1 | TRANSPORTER, EXTERNAL SIDE OF PLASMA MEMBRANE, DRUGGABLE GENOME | inhibitor | 178101311 | DRAFLAZINE | |
| 2030 | SLC29A1 | TRANSPORTER, EXTERNAL SIDE OF PLASMA MEMBRANE, DRUGGABLE GENOME | inhibitor | 178101445 | | |
| 2030 | SLC29A1 | TRANSPORTER, EXTERNAL SIDE OF PLASMA MEMBRANE, DRUGGABLE GENOME | | ETHANOL | ALCOHOL | 15258586 |
| 2030 | SLC29A1 | TRANSPORTER, EXTERNAL SIDE OF PLASMA MEMBRANE, DRUGGABLE GENOME | inhibitor | 178101238 | | |
| 2030 | SLC29A1 | TRANSPORTER, EXTERNAL SIDE OF PLASMA MEMBRANE, DRUGGABLE GENOME | | LIDOFLAZINE | LIDOFLAZINE | |
| 2030 | SLC29A1 | TRANSPORTER, EXTERNAL SIDE OF PLASMA MEMBRANE, DRUGGABLE GENOME | | TECADENOSON | TECADENOSON | 23388705 |
| 2030 | SLC29A1 | TRANSPORTER, EXTERNAL SIDE OF PLASMA MEMBRANE, DRUGGABLE GENOME | | ribavirin | RIBAVIRIN | 20812847 |
| 2030 | SLC29A1 | TRANSPORTER, EXTERNAL SIDE OF PLASMA MEMBRANE, DRUGGABLE GENOME | inhibitor | CHEMBL932 | DIPYRIDAMOLE | |


