
|
|||||
|
 | |
| |
| |
| |
| |
| |
|
Gene: SLC25A46 |
Gene summary for SLC25A46 |
| Gene information | Species | Human | Gene symbol | SLC25A46 | Gene ID | 91137 |
| Gene name | solute carrier family 25 member 46 | |
| Gene Alias | HMSN6B | |
| Cytomap | 5q22.1 | |
| Gene Type | protein-coding | GO ID | GO:0000266 | UniProtAcc | Q96AG3 |
Top |
Malignant transformation analysis |
| Identification of the aberrant gene expression in precancerous and cancerous lesions by comparing the gene expression of stem-like cells in diseased tissues with normal stem cells |
| Entrez ID | Symbol | Replicates | Species | Organ | Tissue | Adj P-value | Log2FC | Malignancy |
| 91137 | SLC25A46 | P62T-E | Human | Esophagus | ESCC | 6.37e-36 | 6.89e-01 | 0.1302 |
| 91137 | SLC25A46 | P65T-E | Human | Esophagus | ESCC | 8.17e-09 | 1.47e-01 | 0.0978 |
| 91137 | SLC25A46 | P74T-E | Human | Esophagus | ESCC | 1.76e-16 | 3.57e-01 | 0.1479 |
| 91137 | SLC25A46 | P75T-E | Human | Esophagus | ESCC | 1.03e-14 | 2.89e-01 | 0.1125 |
| 91137 | SLC25A46 | P76T-E | Human | Esophagus | ESCC | 2.74e-15 | 1.40e-01 | 0.1207 |
| 91137 | SLC25A46 | P79T-E | Human | Esophagus | ESCC | 1.98e-07 | 1.22e-01 | 0.1154 |
| 91137 | SLC25A46 | P80T-E | Human | Esophagus | ESCC | 8.63e-26 | 6.70e-01 | 0.155 |
| 91137 | SLC25A46 | P82T-E | Human | Esophagus | ESCC | 1.60e-04 | 3.26e-01 | 0.1072 |
| 91137 | SLC25A46 | P83T-E | Human | Esophagus | ESCC | 1.35e-17 | 4.27e-01 | 0.1738 |
| 91137 | SLC25A46 | P84T-E | Human | Esophagus | ESCC | 9.43e-03 | 1.73e-01 | 0.0933 |
| 91137 | SLC25A46 | P89T-E | Human | Esophagus | ESCC | 5.19e-07 | 6.06e-01 | 0.1752 |
| 91137 | SLC25A46 | P91T-E | Human | Esophagus | ESCC | 8.93e-08 | 7.13e-01 | 0.1828 |
| 91137 | SLC25A46 | P107T-E | Human | Esophagus | ESCC | 9.40e-19 | 5.30e-01 | 0.171 |
| 91137 | SLC25A46 | P126T-E | Human | Esophagus | ESCC | 4.21e-09 | 4.91e-01 | 0.1125 |
| 91137 | SLC25A46 | P127T-E | Human | Esophagus | ESCC | 7.42e-20 | 2.94e-01 | 0.0826 |
| 91137 | SLC25A46 | P128T-E | Human | Esophagus | ESCC | 4.15e-07 | 1.43e-01 | 0.1241 |
| 91137 | SLC25A46 | P130T-E | Human | Esophagus | ESCC | 2.38e-31 | 6.20e-01 | 0.1676 |
| 91137 | SLC25A46 | HCC1_Meng | Human | Liver | HCC | 1.73e-39 | 5.16e-02 | 0.0246 |
| 91137 | SLC25A46 | HCC2_Meng | Human | Liver | HCC | 3.41e-21 | 3.20e-02 | 0.0107 |
| 91137 | SLC25A46 | HCC2 | Human | Liver | HCC | 9.31e-15 | 3.14e+00 | 0.5341 |
| Page: 1 2 3 4 5 |
| Tissue | Expression Dynamics | Abbreviation |
| Esophagus | 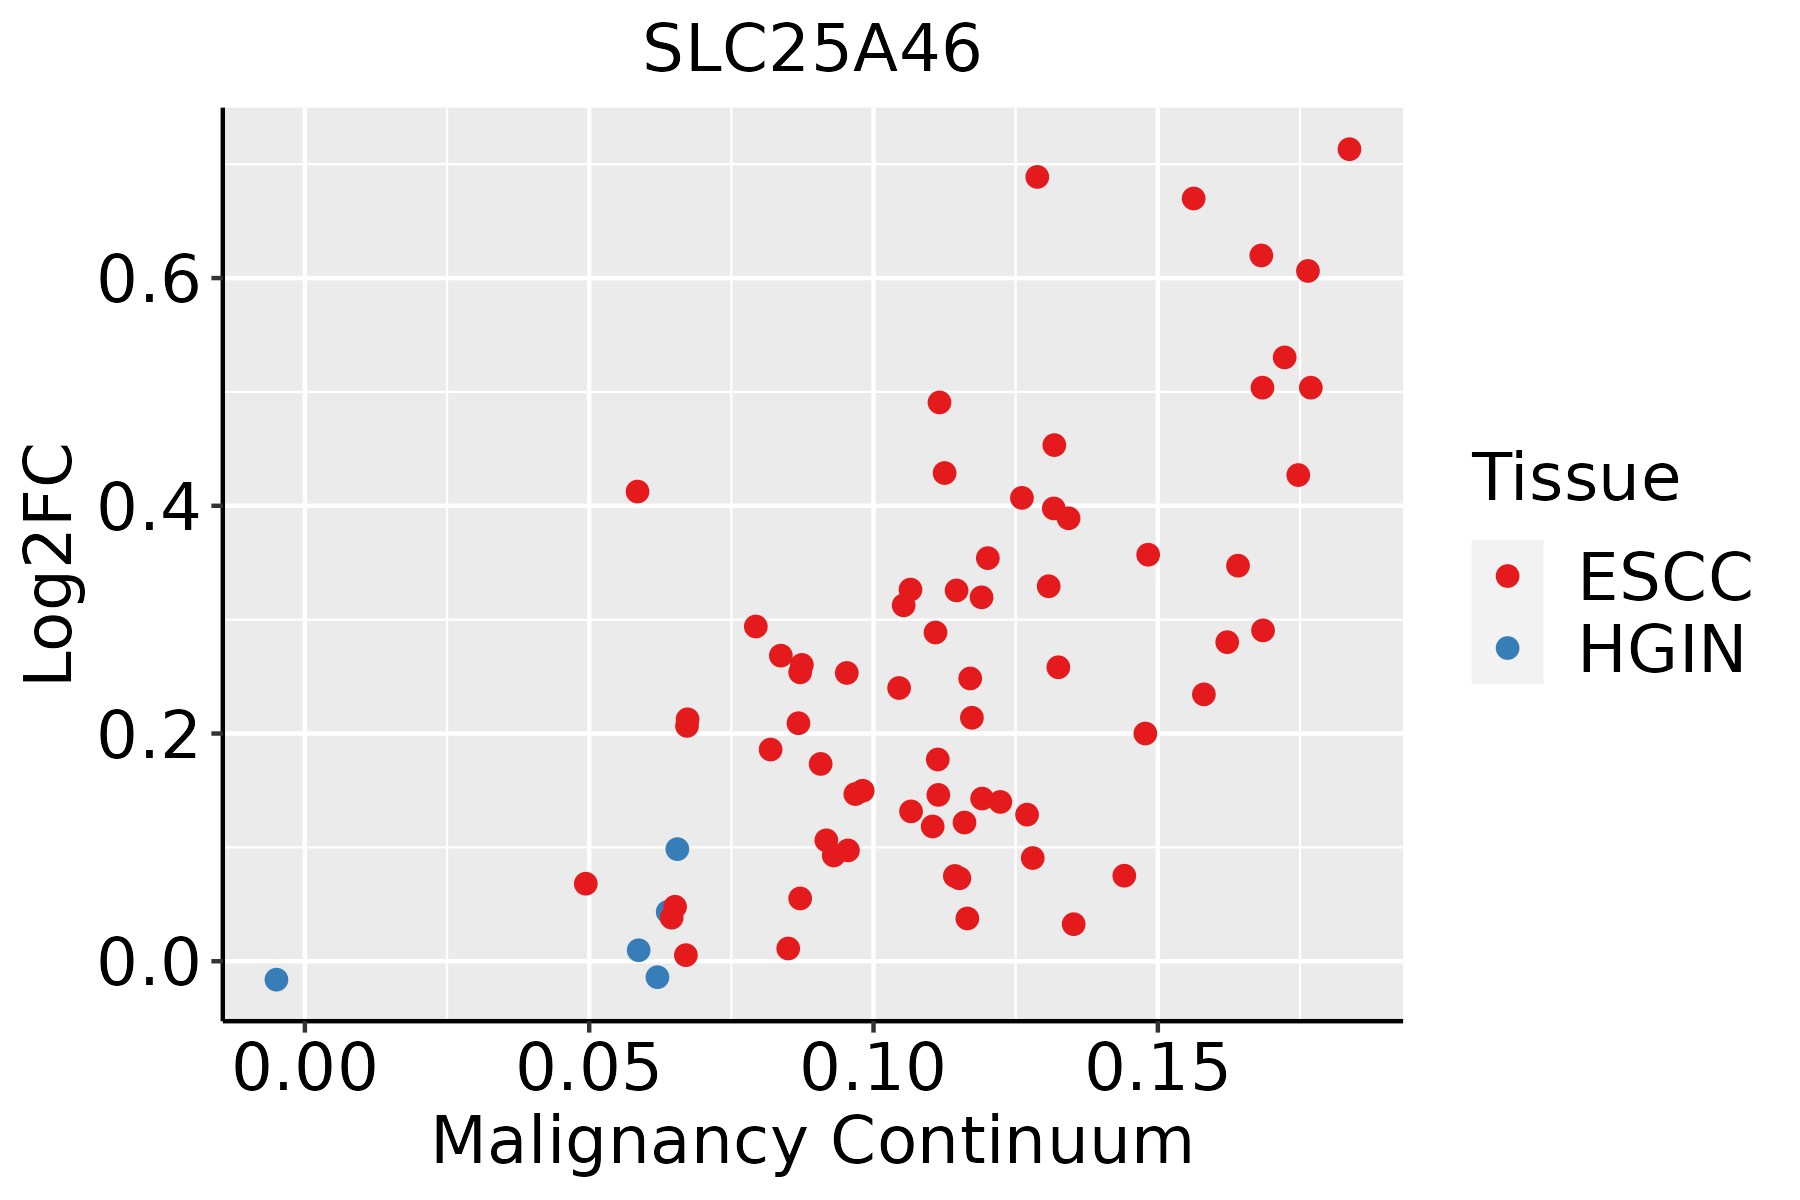 | ESCC: Esophageal squamous cell carcinoma |
| HGIN: High-grade intraepithelial neoplasias | ||
| LGIN: Low-grade intraepithelial neoplasias | ||
| Liver | 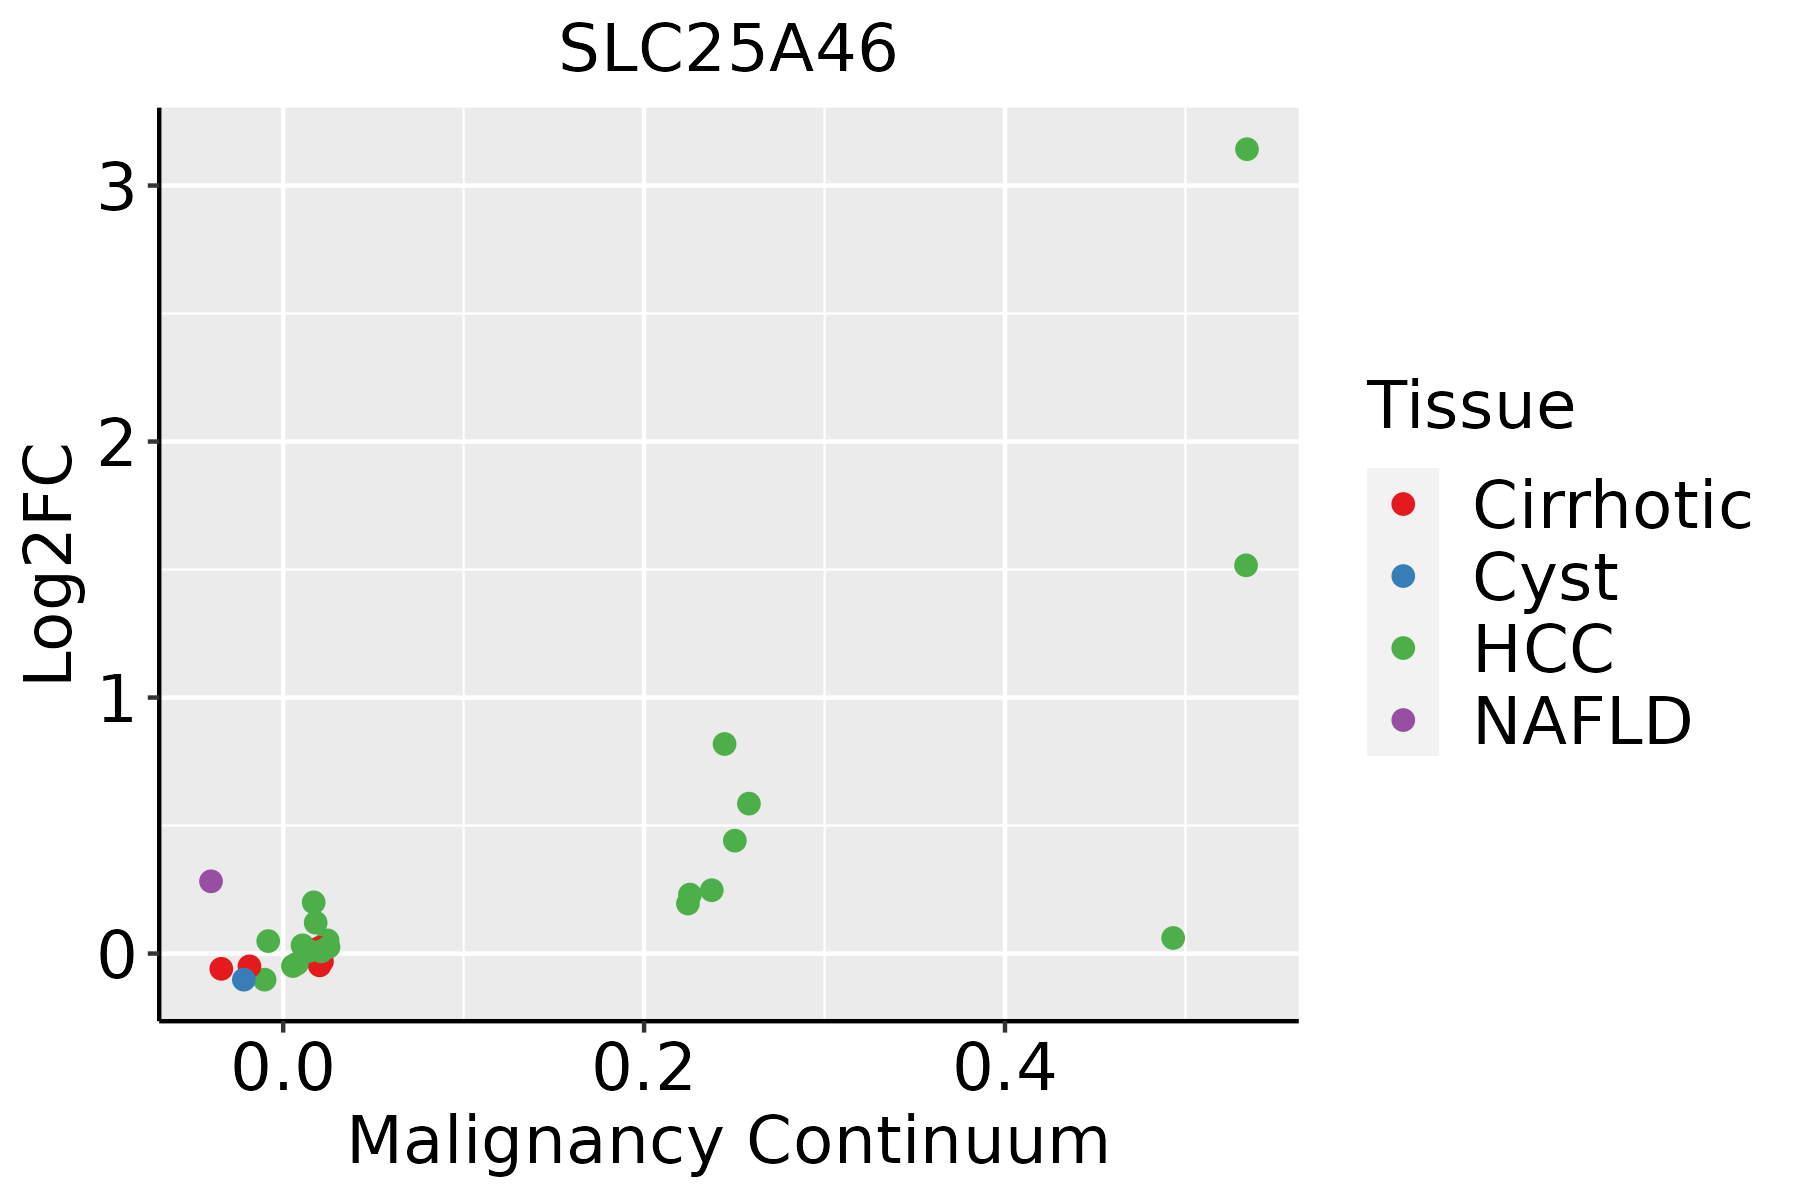 | HCC: Hepatocellular carcinoma |
| NAFLD: Non-alcoholic fatty liver disease | ||
| Oral Cavity | 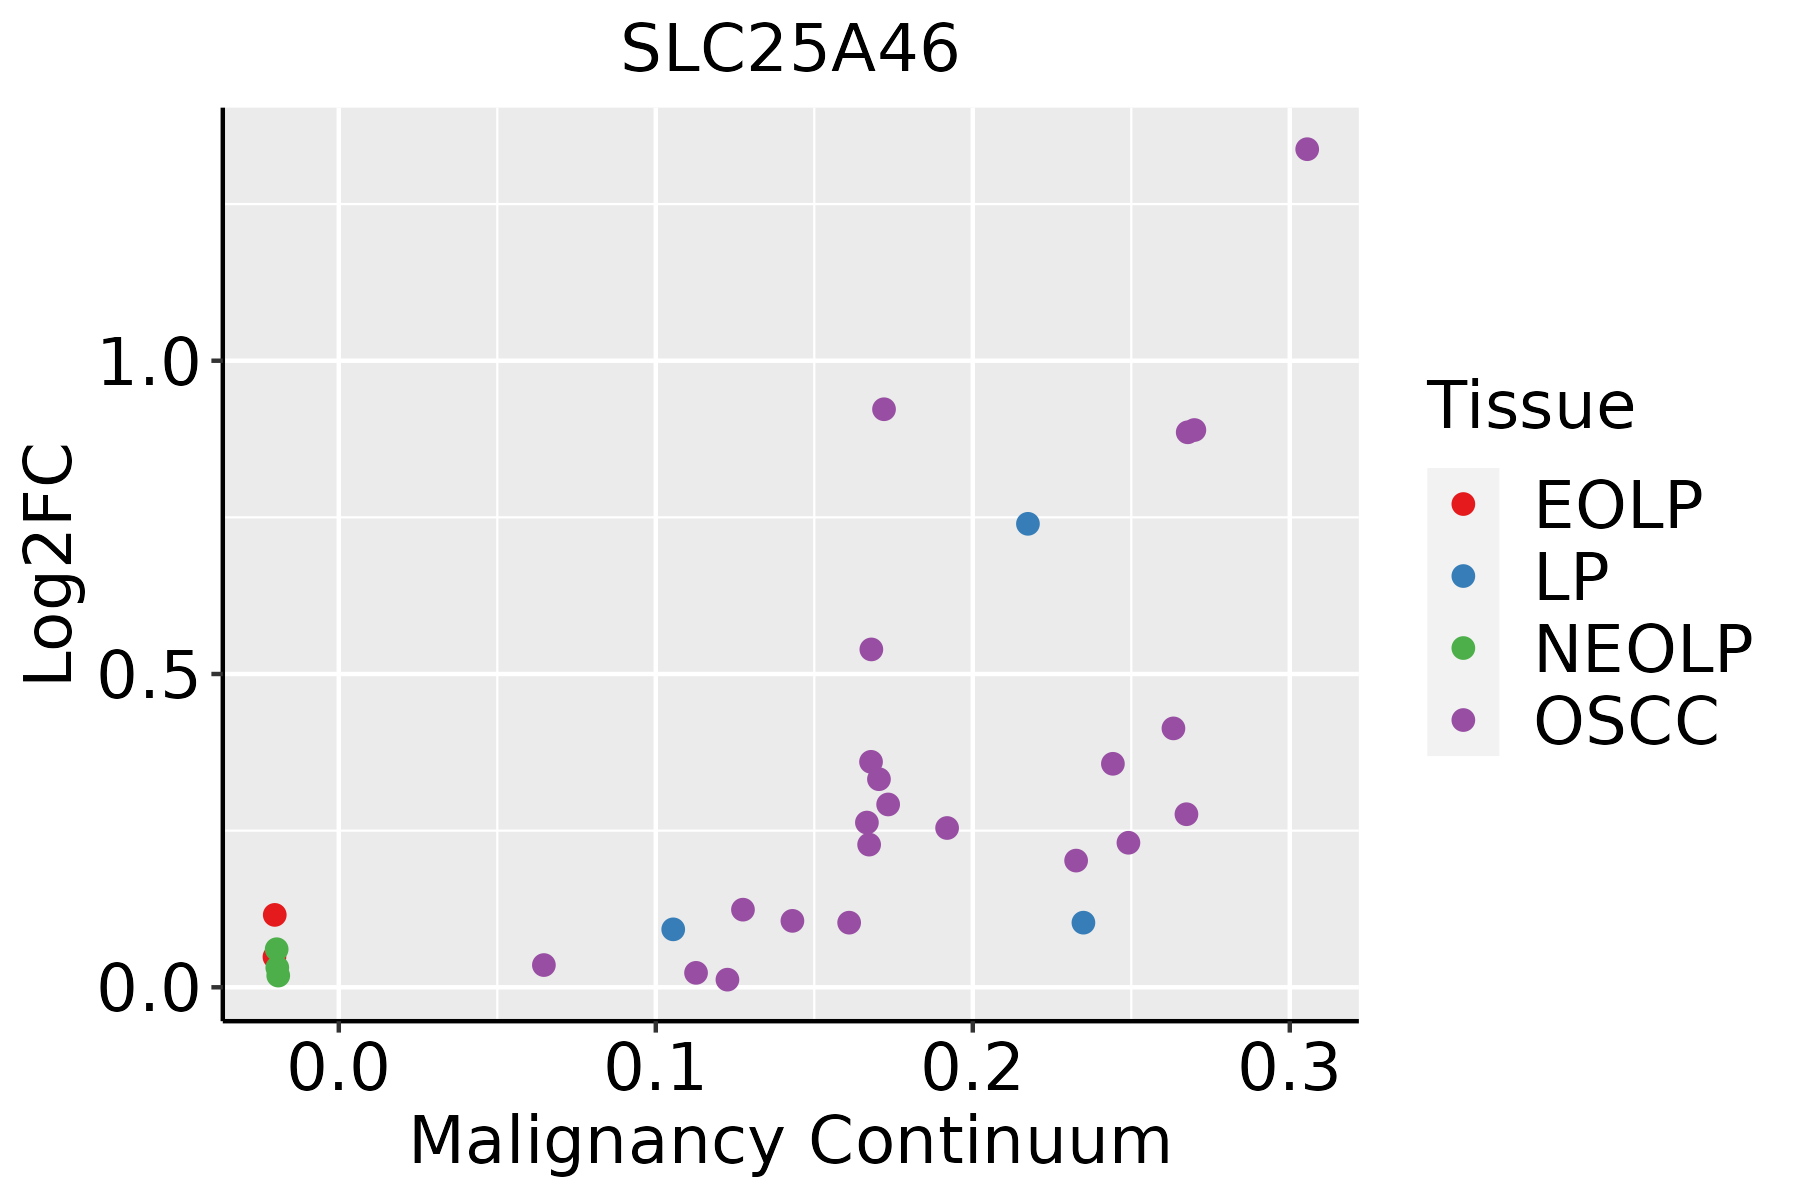 | EOLP: Erosive Oral lichen planus |
| LP: leukoplakia | ||
| NEOLP: Non-erosive oral lichen planus | ||
| OSCC: Oral squamous cell carcinoma | ||
| Skin |  | AK: Actinic keratosis |
| cSCC: Cutaneous squamous cell carcinoma | ||
| SCCIS:squamous cell carcinoma in situ | ||
| Thyroid |  | ATC: Anaplastic thyroid cancer |
| HT: Hashimoto's thyroiditis | ||
| PTC: Papillary thyroid cancer |
| ∗log2FC in expression of this searched gene in stem-like cells from each diseased tissue sample relative to stem-like cells in normal samples in each tissue plotted against the malignancy continuum. Samples are colored based on if they are from different disease stage. |
Top |
Malignant transformation related pathway analysis |
| Find out the enriched GO biological processes and KEGG pathways involved in transition from healthy to precancer to cancer |
| Tissue | Disease Stage | Enriched GO biological Processes |
| Colorectum | AD |  |
| Colorectum | SER |  |
| Colorectum | MSS |  |
| Colorectum | MSI-H |  |
| Colorectum | FAP |  |
| ∗Top 15 enriched GO BP terms are showed in the bar plot of each disease state in each tissue. Each row represents a significant GO biological process which is colored according to the -log10(p.adjust). |
| Page: 1 2 3 4 5 6 7 8 9 |
| GO ID | Tissue | Disease Stage | Description | Gene Ratio | Bg Ratio | pvalue | p.adjust | Count |
| GO:00482853 | Esophagus | ESCC | organelle fission | 301/8552 | 488/18723 | 4.64e-13 | 2.12e-11 | 301 |
| GO:006156415 | Esophagus | ESCC | axon development | 251/8552 | 467/18723 | 2.41e-04 | 1.49e-03 | 251 |
| GO:00002662 | Esophagus | ESCC | mitochondrial fission | 28/8552 | 42/18723 | 4.90e-03 | 1.89e-02 | 28 |
| GO:0048285 | Liver | HCC | organelle fission | 254/7958 | 488/18723 | 1.07e-05 | 1.23e-04 | 254 |
| GO:0000266 | Liver | HCC | mitochondrial fission | 28/7958 | 42/18723 | 1.35e-03 | 7.26e-03 | 28 |
| GO:00482852 | Oral cavity | OSCC | organelle fission | 265/7305 | 488/18723 | 3.22e-12 | 1.27e-10 | 265 |
| GO:006156410 | Oral cavity | OSCC | axon development | 207/7305 | 467/18723 | 1.01e-02 | 3.51e-02 | 207 |
| GO:00002661 | Oral cavity | OSCC | mitochondrial fission | 24/7305 | 42/18723 | 1.30e-02 | 4.34e-02 | 24 |
| GO:004828511 | Oral cavity | LP | organelle fission | 145/4623 | 488/18723 | 6.02e-03 | 3.57e-02 | 145 |
| GO:00482854 | Skin | cSCC | organelle fission | 197/4864 | 488/18723 | 1.51e-12 | 8.36e-11 | 197 |
| GO:006156422 | Skin | cSCC | axon development | 146/4864 | 467/18723 | 5.50e-03 | 2.73e-02 | 146 |
| GO:006156419 | Thyroid | PTC | axon development | 199/5968 | 467/18723 | 5.27e-07 | 8.53e-06 | 199 |
| GO:00482855 | Thyroid | PTC | organelle fission | 188/5968 | 488/18723 | 9.64e-04 | 5.77e-03 | 188 |
| GO:004828512 | Thyroid | ATC | organelle fission | 229/6293 | 488/18723 | 4.79e-10 | 1.29e-08 | 229 |
| GO:006156423 | Thyroid | ATC | axon development | 220/6293 | 467/18723 | 6.85e-10 | 1.80e-08 | 220 |
| GO:00002663 | Thyroid | ATC | mitochondrial fission | 22/6293 | 42/18723 | 9.23e-03 | 3.44e-02 | 22 |
| Page: 1 |
| Pathway ID | Tissue | Disease Stage | Description | Gene Ratio | Bg Ratio | pvalue | p.adjust | qvalue | Count |
| Page: 1 |
Top |
Cell-cell communication analysis |
| Identification of potential cell-cell interactions between two cell types and their ligand-receptor pairs for different disease states |
| Ligand | Receptor | LRpair | Pathway | Tissue | Disease Stage |
| Page: 1 |
Top |
Single-cell gene regulatory network inference analysis |
| Find out the significant the regulons (TFs) and the target genes of each regulon across cell types for different disease states |
| TF | Cell Type | Tissue | Disease Stage | Target Gene | RSS | Regulon Activity |
| ∗The dot plots of a searched regulon are shown for all cell subpopulations in each disease state of each tissue based on the regulon specific score inferred using pySCENIC and by calculating the average expression. |
| Page: 1 |
Top |
Somatic mutation of malignant transformation related genes |
| Annotation of somatic variants for genes involved in malignant transformation |
| Hugo Symbol | Variant Class | Variant Classification | dbSNP RS | HGVSc | HGVSp | HGVSp Short | SWISSPROT | BIOTYPE | SIFT | PolyPhen | Tumor Sample Barcode | Tissue | Histology | Sex | Age | Stage | Therapy Types | Drugs | Outcome |
| SLC25A46 | SNV | Missense_Mutation | c.574C>T | p.His192Tyr | p.H192Y | Q96AG3 | protein_coding | tolerated(0.4) | benign(0) | TCGA-A6-6650-01 | Colorectum | colon adenocarcinoma | Female | >=65 | I/II | Unknown | Unknown | SD | |
| SLC25A46 | SNV | Missense_Mutation | c.1052A>T | p.Asp351Val | p.D351V | Q96AG3 | protein_coding | deleterious(0) | probably_damaging(1) | TCGA-A6-6781-01 | Colorectum | colon adenocarcinoma | Male | <65 | III/IV | Chemotherapy | oxaliplatin | SD | |
| SLC25A46 | SNV | Missense_Mutation | novel | c.770N>A | p.Arg257Gln | p.R257Q | Q96AG3 | protein_coding | deleterious(0) | probably_damaging(0.975) | TCGA-AZ-4315-01 | Colorectum | colon adenocarcinoma | Male | <65 | I/II | Unknown | Unknown | SD |
| SLC25A46 | SNV | Missense_Mutation | novel | c.1040N>A | p.Arg347His | p.R347H | Q96AG3 | protein_coding | deleterious(0) | probably_damaging(1) | TCGA-CA-6717-01 | Colorectum | colon adenocarcinoma | Male | <65 | I/II | Chemotherapy | oxaliplatin | CR |
| SLC25A46 | SNV | Missense_Mutation | rs750732884 | c.370C>T | p.Arg124Cys | p.R124C | Q96AG3 | protein_coding | deleterious(0) | probably_damaging(0.999) | TCGA-CK-5915-01 | Colorectum | colon adenocarcinoma | Male | <65 | I/II | Unknown | Unknown | SD |
| SLC25A46 | SNV | Missense_Mutation | novel | c.55C>T | p.Arg19Trp | p.R19W | Q96AG3 | protein_coding | deleterious_low_confidence(0) | possibly_damaging(0.803) | TCGA-D5-6539-01 | Colorectum | colon adenocarcinoma | Female | <65 | I/II | Unknown | Unknown | SD |
| SLC25A46 | SNV | Missense_Mutation | novel | c.581G>T | p.Trp194Leu | p.W194L | Q96AG3 | protein_coding | tolerated(0.67) | benign(0) | TCGA-AG-A002-01 | Colorectum | rectum adenocarcinoma | Male | <65 | I/II | Unknown | Unknown | SD |
| SLC25A46 | SNV | Missense_Mutation | novel | c.1220A>C | p.Lys407Thr | p.K407T | Q96AG3 | protein_coding | deleterious(0.01) | probably_damaging(0.976) | TCGA-AG-A002-01 | Colorectum | rectum adenocarcinoma | Male | <65 | I/II | Unknown | Unknown | SD |
| SLC25A46 | insertion | In_Frame_Ins | novel | c.612_613insATTTTTTTCAAT | p.Leu204_Leu205insIlePhePheAsn | p.L204_L205insIFFN | Q96AG3 | protein_coding | TCGA-AM-5820-01 | Colorectum | colon adenocarcinoma | Female | <65 | I/II | Unknown | Unknown | SD | ||
| SLC25A46 | insertion | Nonsense_Mutation | novel | c.615_616insTAGG | p.Lys206Ter | p.K206* | Q96AG3 | protein_coding | TCGA-AM-5820-01 | Colorectum | colon adenocarcinoma | Female | <65 | I/II | Unknown | Unknown | SD |
| Page: 1 2 3 4 |
Top |
Related drugs of malignant transformation related genes |
| Identification of chemicals and drugs interact with genes involved in malignant transfromation |
| (DGIdb 4.0) |
| Entrez ID | Symbol | Category | Interaction Types | Drug Claim Name | Drug Name | PMIDs |
| Page: 1 |

Copyright 2023-Present -The University of Texas Health Science Center at Houston |