
|
|||||
|
 | |
| |
| |
| |
| |
| |
|
Gene: SLC16A3 |
Gene summary for SLC16A3 |
| Gene information | Species | Human | Gene symbol | SLC16A3 | Gene ID | 9123 |
| Gene name | solute carrier family 16 member 3 | |
| Gene Alias | MCT 3 | |
| Cytomap | 17q25.3 | |
| Gene Type | protein-coding | GO ID | GO:0006810 | UniProtAcc | A0A024R8U1 |
Top |
Malignant transformation analysis |
| Identification of the aberrant gene expression in precancerous and cancerous lesions by comparing the gene expression of stem-like cells in diseased tissues with normal stem cells |
| Entrez ID | Symbol | Replicates | Species | Organ | Tissue | Adj P-value | Log2FC | Malignancy |
| 9123 | SLC16A3 | P26T-E | Human | Esophagus | ESCC | 1.96e-38 | 1.15e+00 | 0.1276 |
| 9123 | SLC16A3 | P27T-E | Human | Esophagus | ESCC | 1.00e-08 | 2.38e-01 | 0.1055 |
| 9123 | SLC16A3 | P28T-E | Human | Esophagus | ESCC | 7.03e-48 | 1.05e+00 | 0.1149 |
| 9123 | SLC16A3 | P30T-E | Human | Esophagus | ESCC | 3.55e-17 | 1.14e+00 | 0.137 |
| 9123 | SLC16A3 | P31T-E | Human | Esophagus | ESCC | 9.83e-40 | 1.15e+00 | 0.1251 |
| 9123 | SLC16A3 | P32T-E | Human | Esophagus | ESCC | 9.06e-98 | 2.38e+00 | 0.1666 |
| 9123 | SLC16A3 | P36T-E | Human | Esophagus | ESCC | 7.25e-19 | 1.06e+00 | 0.1187 |
| 9123 | SLC16A3 | P37T-E | Human | Esophagus | ESCC | 5.33e-41 | 1.30e+00 | 0.1371 |
| 9123 | SLC16A3 | P38T-E | Human | Esophagus | ESCC | 4.80e-18 | 1.40e+00 | 0.127 |
| 9123 | SLC16A3 | P39T-E | Human | Esophagus | ESCC | 9.17e-34 | 7.67e-01 | 0.0894 |
| 9123 | SLC16A3 | P40T-E | Human | Esophagus | ESCC | 2.84e-08 | 3.26e-01 | 0.109 |
| 9123 | SLC16A3 | P42T-E | Human | Esophagus | ESCC | 1.15e-04 | 4.63e-01 | 0.1175 |
| 9123 | SLC16A3 | P44T-E | Human | Esophagus | ESCC | 1.53e-12 | 1.01e+00 | 0.1096 |
| 9123 | SLC16A3 | P47T-E | Human | Esophagus | ESCC | 1.21e-33 | 9.56e-01 | 0.1067 |
| 9123 | SLC16A3 | P48T-E | Human | Esophagus | ESCC | 4.38e-19 | 3.10e-01 | 0.0959 |
| 9123 | SLC16A3 | P49T-E | Human | Esophagus | ESCC | 3.68e-14 | 1.79e+00 | 0.1768 |
| 9123 | SLC16A3 | P52T-E | Human | Esophagus | ESCC | 1.05e-08 | 3.93e-01 | 0.1555 |
| 9123 | SLC16A3 | P54T-E | Human | Esophagus | ESCC | 5.89e-13 | 5.16e-01 | 0.0975 |
| 9123 | SLC16A3 | P56T-E | Human | Esophagus | ESCC | 7.79e-04 | 5.65e-01 | 0.1613 |
| 9123 | SLC16A3 | P57T-E | Human | Esophagus | ESCC | 9.60e-22 | 5.71e-01 | 0.0926 |
| Page: 1 2 3 4 5 6 |
| Tissue | Expression Dynamics | Abbreviation |
| Breast | 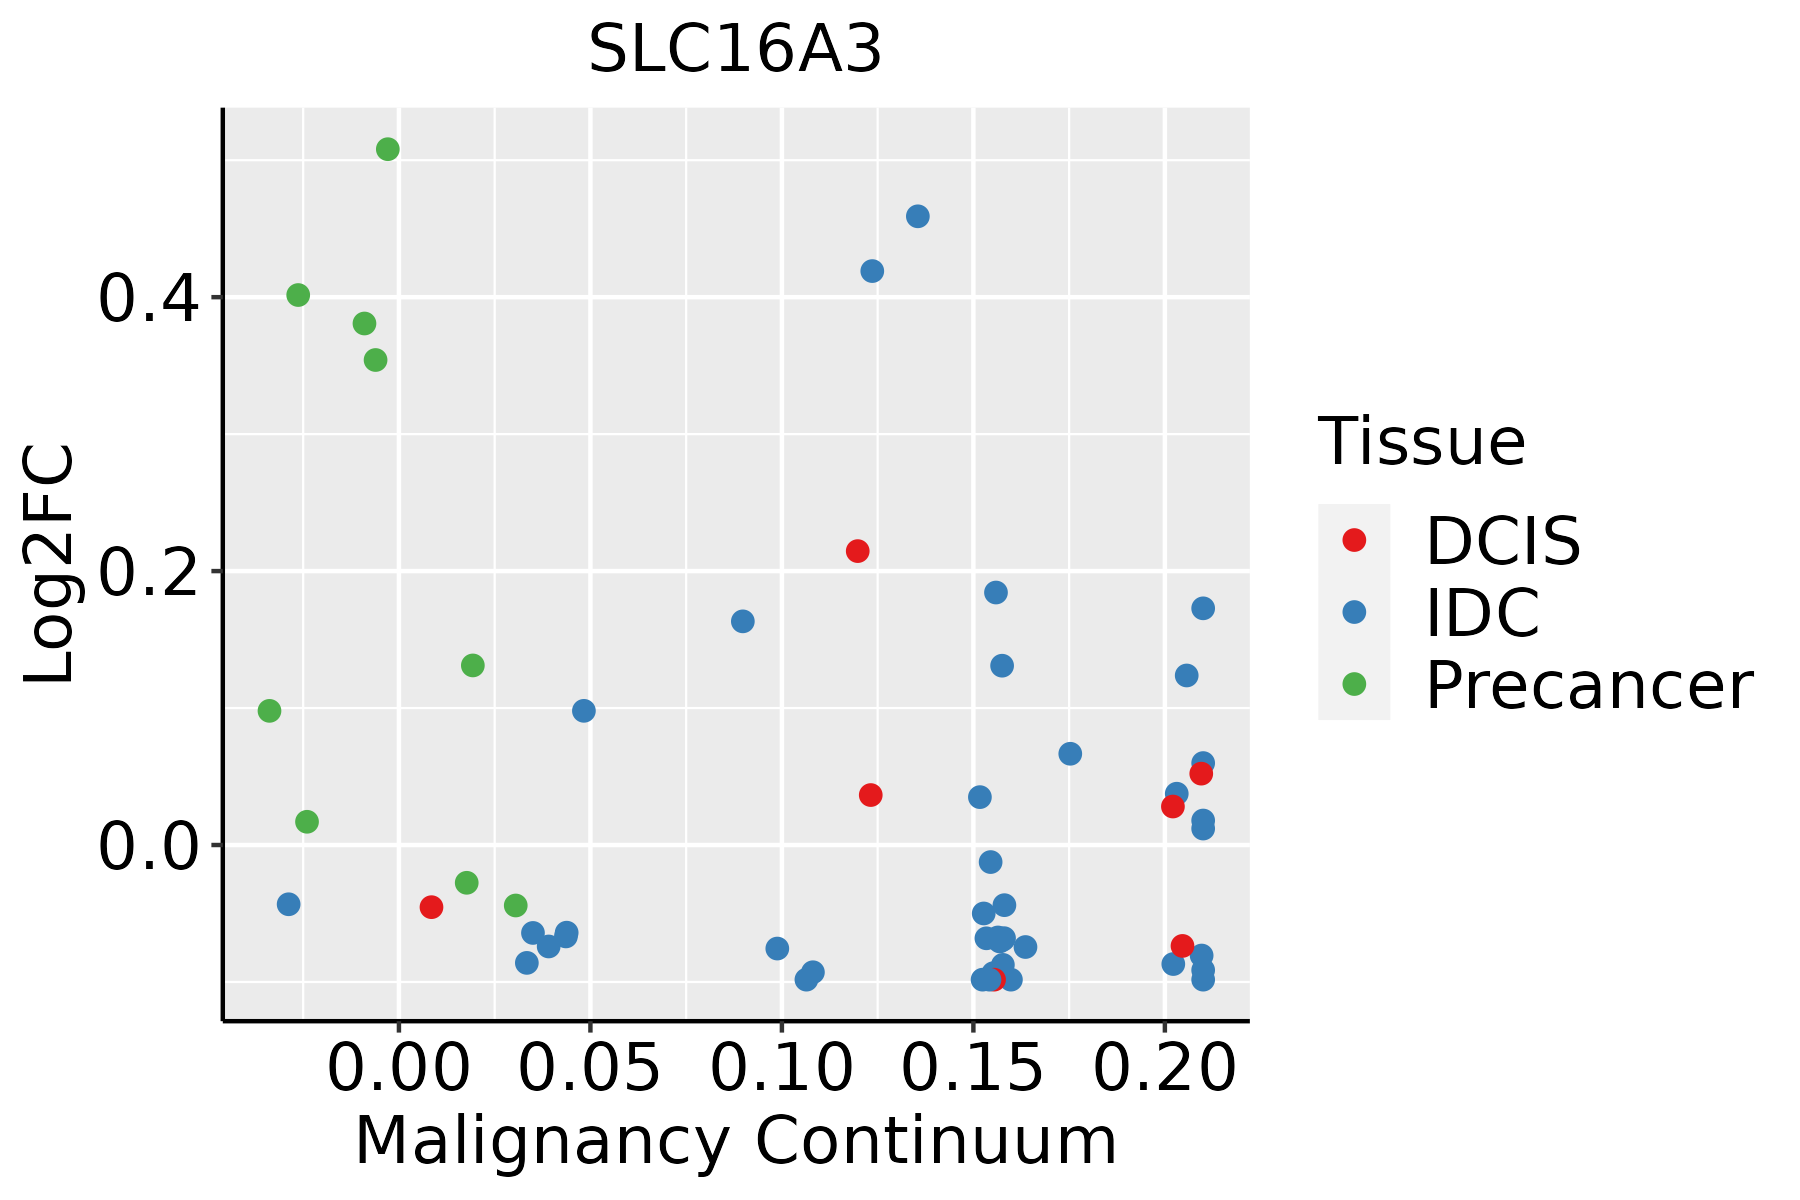 | IDC: Invasive ductal carcinoma |
| DCIS: Ductal carcinoma in situ | ||
| Precancer(BRCA1-mut): Precancerous lesion from BRCA1 mutation carriers | ||
| Colorectum (GSE201348) |  | FAP: Familial adenomatous polyposis |
| CRC: Colorectal cancer | ||
| Colorectum (HTA11) |  | AD: Adenomas |
| SER: Sessile serrated lesions | ||
| MSI-H: Microsatellite-high colorectal cancer | ||
| MSS: Microsatellite stable colorectal cancer | ||
| Esophagus | 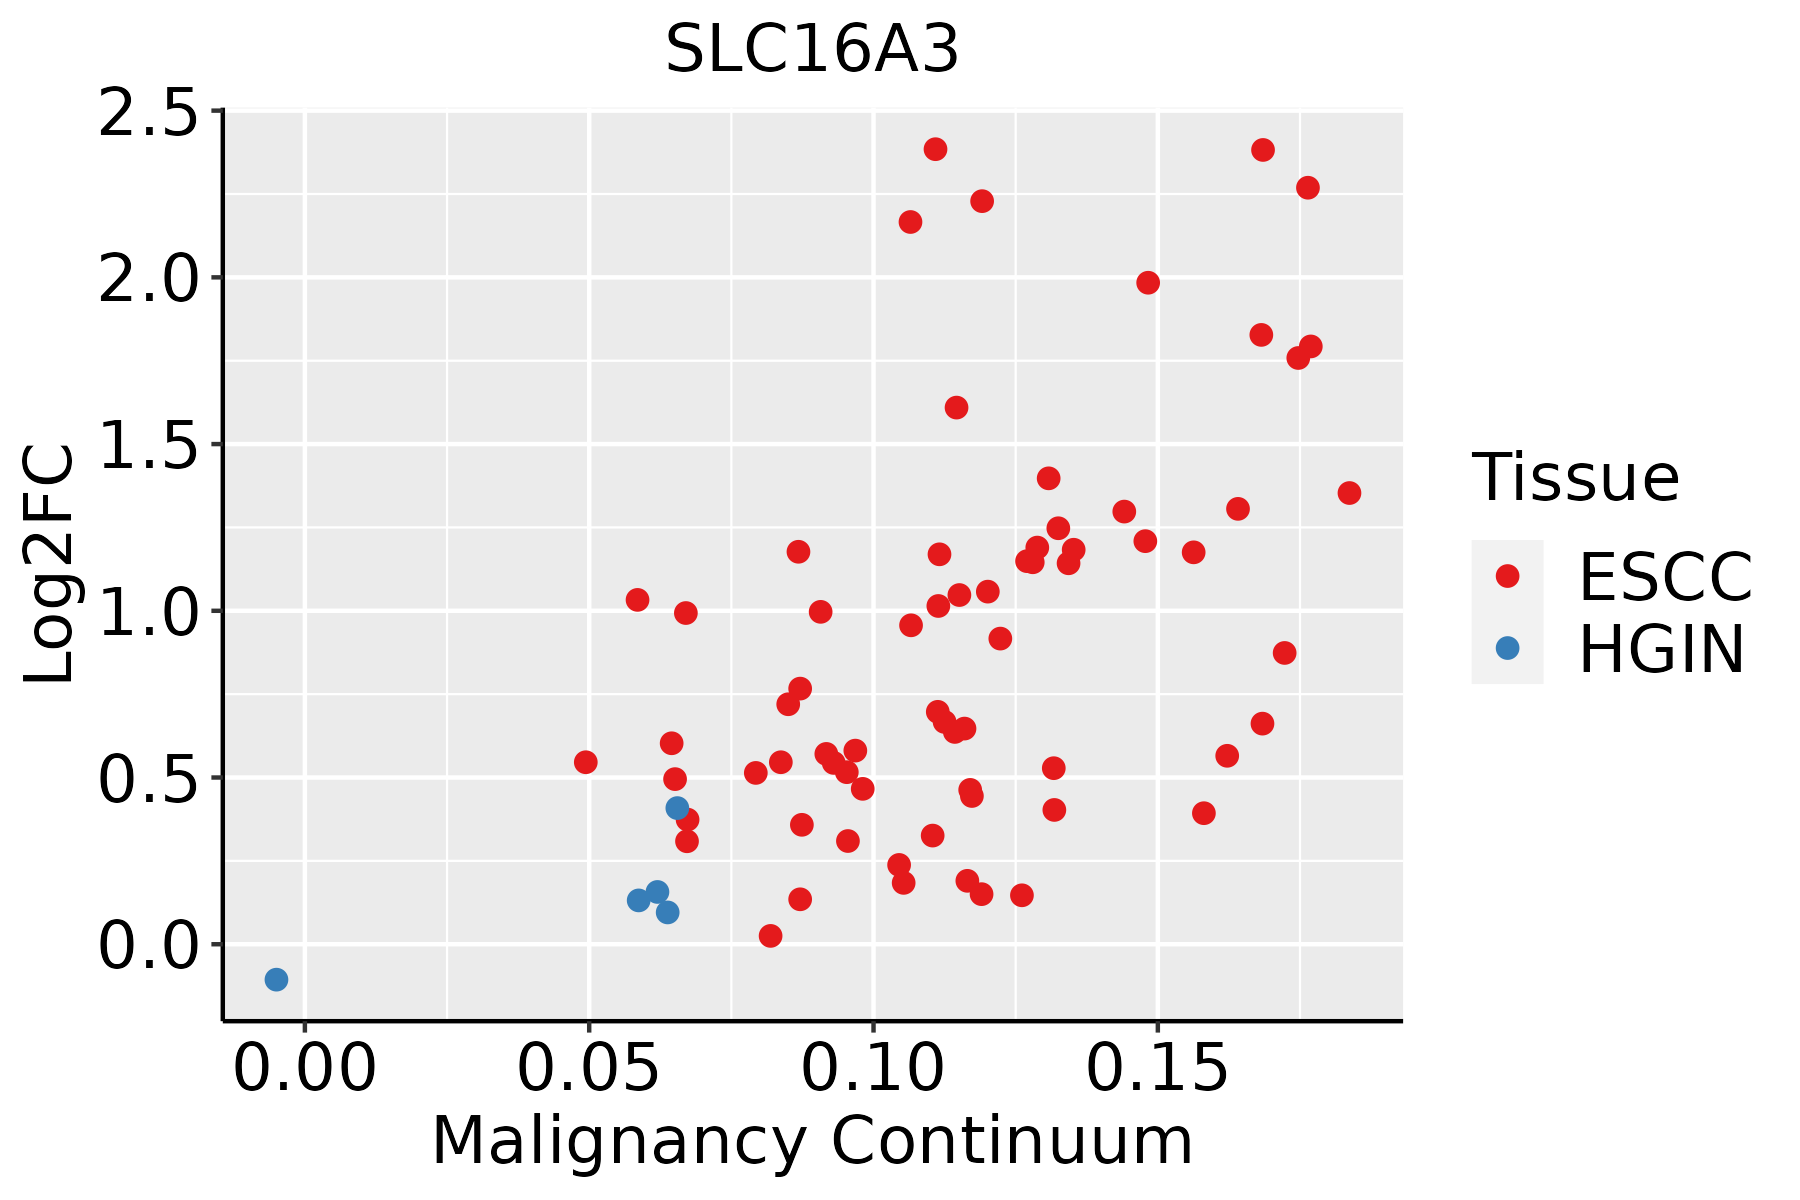 | ESCC: Esophageal squamous cell carcinoma |
| HGIN: High-grade intraepithelial neoplasias | ||
| LGIN: Low-grade intraepithelial neoplasias | ||
| Liver | 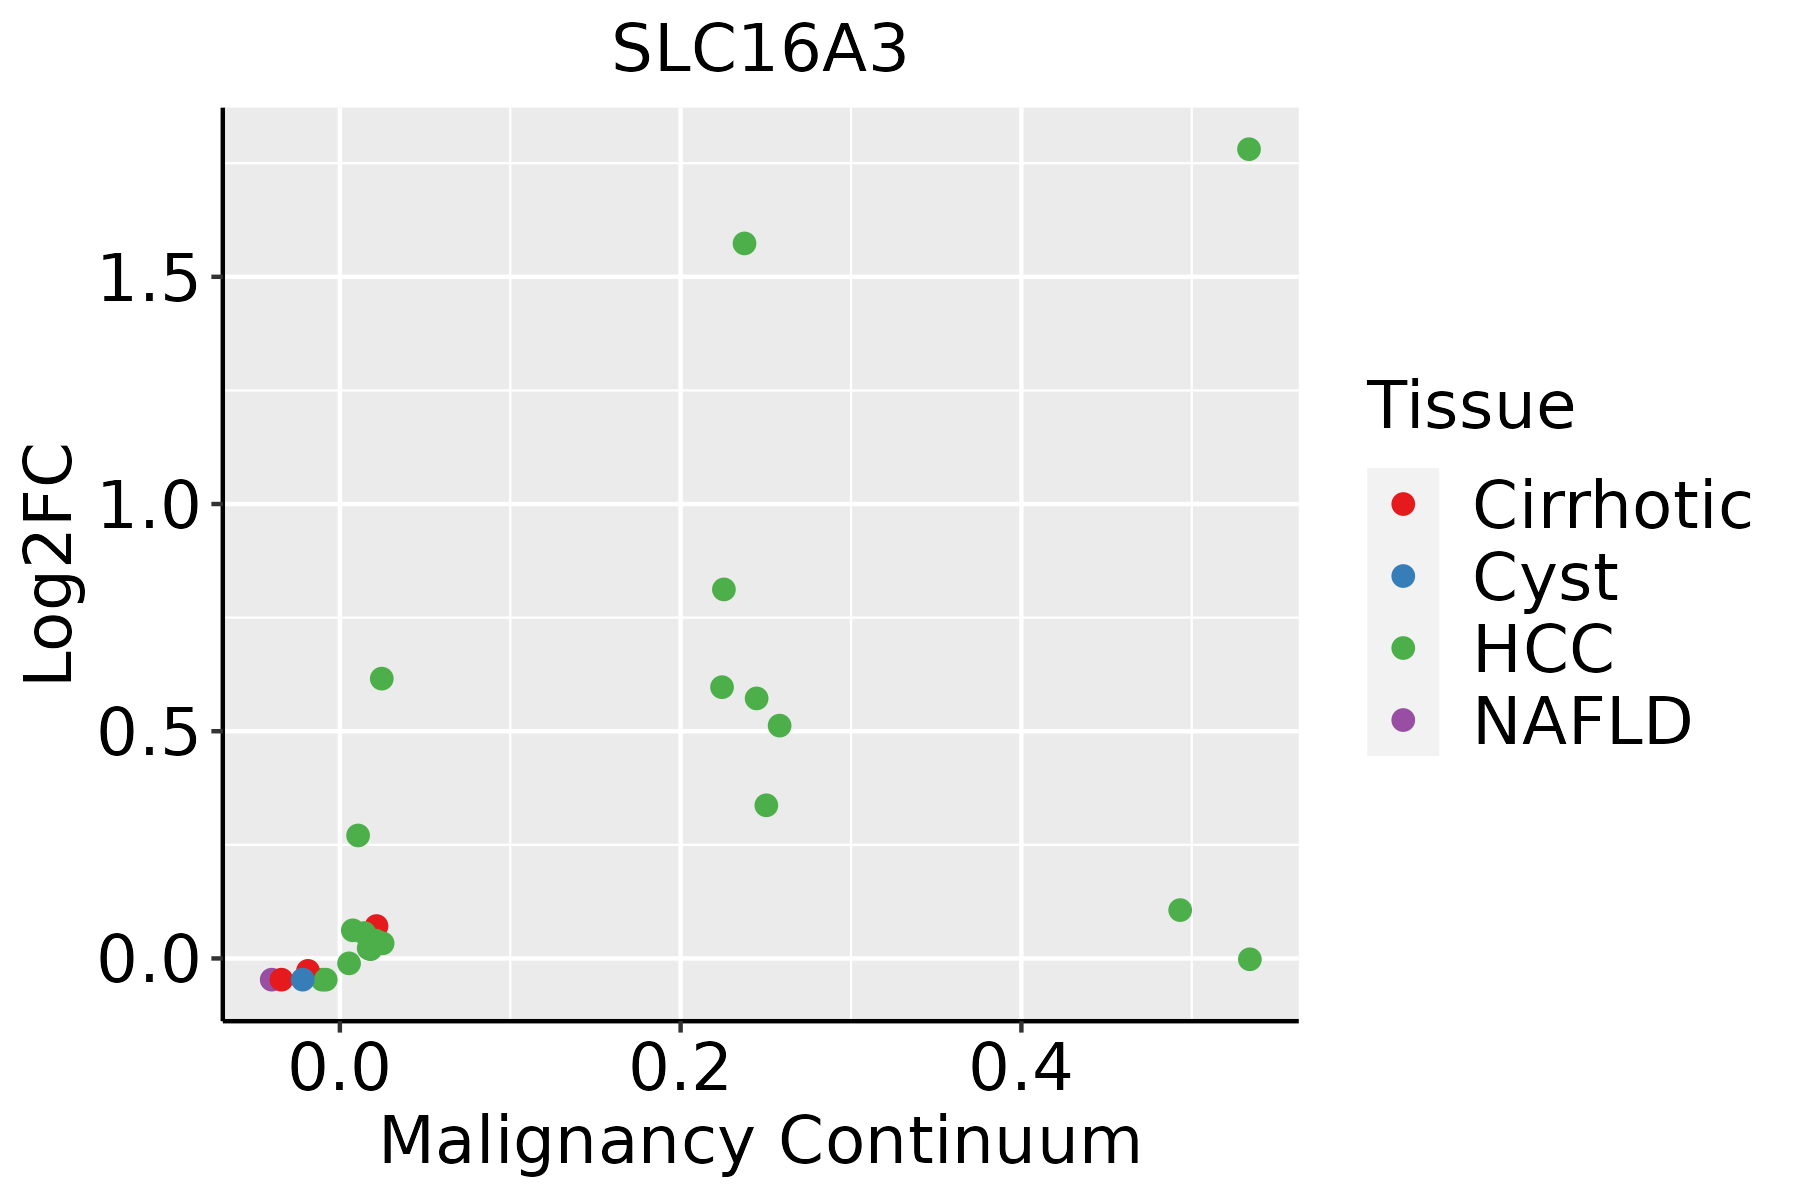 | HCC: Hepatocellular carcinoma |
| NAFLD: Non-alcoholic fatty liver disease | ||
| Oral Cavity |  | EOLP: Erosive Oral lichen planus |
| LP: leukoplakia | ||
| NEOLP: Non-erosive oral lichen planus | ||
| OSCC: Oral squamous cell carcinoma | ||
| Skin | 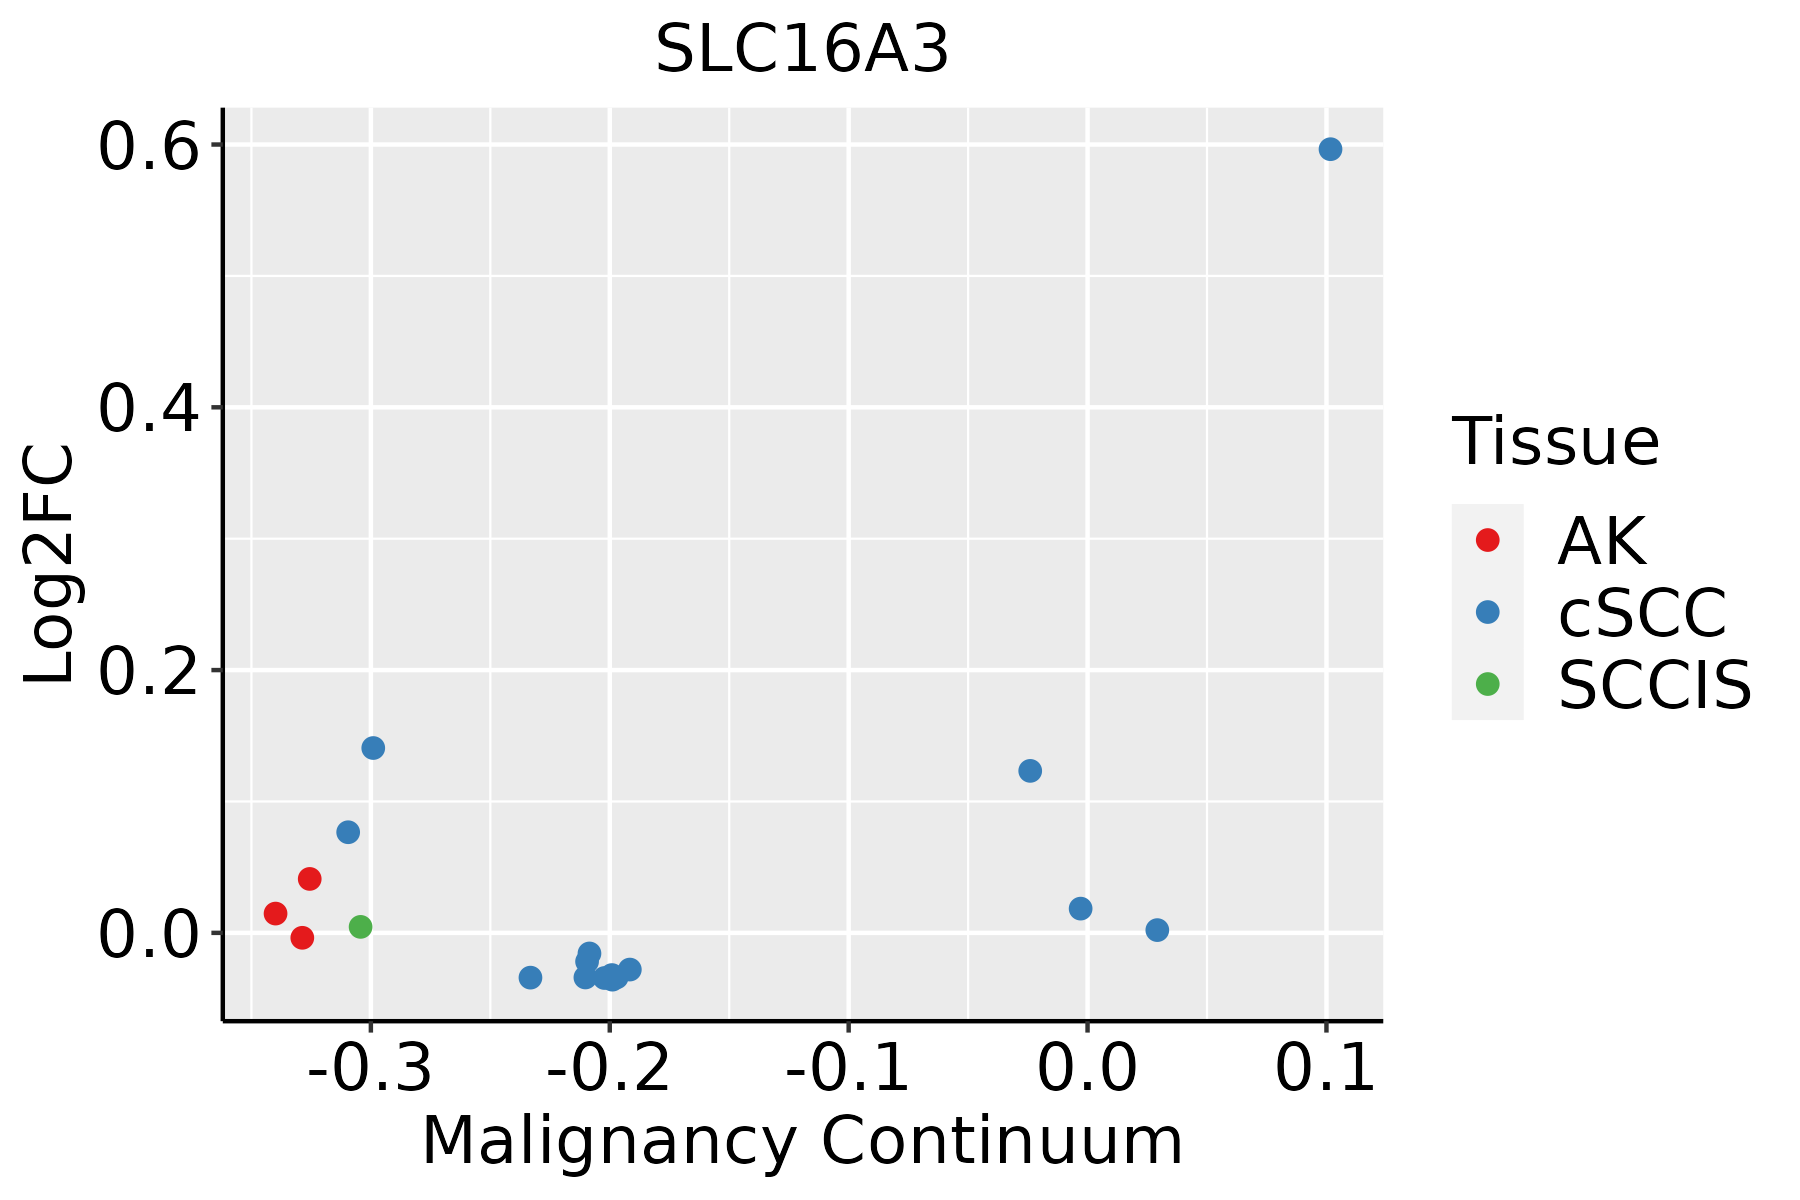 | AK: Actinic keratosis |
| cSCC: Cutaneous squamous cell carcinoma | ||
| SCCIS:squamous cell carcinoma in situ | ||
| Thyroid |  | ATC: Anaplastic thyroid cancer |
| HT: Hashimoto's thyroiditis | ||
| PTC: Papillary thyroid cancer |
| ∗log2FC in expression of this searched gene in stem-like cells from each diseased tissue sample relative to stem-like cells in normal samples in each tissue plotted against the malignancy continuum. Samples are colored based on if they are from different disease stage. |
Top |
Malignant transformation related pathway analysis |
| Find out the enriched GO biological processes and KEGG pathways involved in transition from healthy to precancer to cancer |
| Tissue | Disease Stage | Enriched GO biological Processes |
| Colorectum | AD |  |
| Colorectum | SER |  |
| Colorectum | MSS |  |
| Colorectum | MSI-H |  |
| Colorectum | FAP |  |
| ∗Top 15 enriched GO BP terms are showed in the bar plot of each disease state in each tissue. Each row represents a significant GO biological process which is colored according to the -log10(p.adjust). |
| Page: 1 2 3 4 5 6 7 8 9 |
| GO ID | Tissue | Disease Stage | Description | Gene Ratio | Bg Ratio | pvalue | p.adjust | Count |
| Page: 1 |
| Pathway ID | Tissue | Disease Stage | Description | Gene Ratio | Bg Ratio | pvalue | p.adjust | qvalue | Count |
| hsa052309 | Breast | Precancer | Central carbon metabolism in cancer | 13/684 | 70/8465 | 3.57e-03 | 2.17e-02 | 1.66e-02 | 13 |
| hsa0523012 | Breast | Precancer | Central carbon metabolism in cancer | 13/684 | 70/8465 | 3.57e-03 | 2.17e-02 | 1.66e-02 | 13 |
| hsa05230 | Colorectum | AD | Central carbon metabolism in cancer | 33/2092 | 70/8465 | 3.61e-05 | 3.19e-04 | 2.03e-04 | 33 |
| hsa052301 | Colorectum | AD | Central carbon metabolism in cancer | 33/2092 | 70/8465 | 3.61e-05 | 3.19e-04 | 2.03e-04 | 33 |
| hsa052302 | Colorectum | SER | Central carbon metabolism in cancer | 25/1580 | 70/8465 | 5.43e-04 | 4.51e-03 | 3.27e-03 | 25 |
| hsa052303 | Colorectum | SER | Central carbon metabolism in cancer | 25/1580 | 70/8465 | 5.43e-04 | 4.51e-03 | 3.27e-03 | 25 |
| hsa052304 | Colorectum | MSS | Central carbon metabolism in cancer | 25/1875 | 70/8465 | 6.50e-03 | 2.64e-02 | 1.62e-02 | 25 |
| hsa052305 | Colorectum | MSS | Central carbon metabolism in cancer | 25/1875 | 70/8465 | 6.50e-03 | 2.64e-02 | 1.62e-02 | 25 |
| hsa0523018 | Esophagus | ESCC | Central carbon metabolism in cancer | 50/4205 | 70/8465 | 1.70e-04 | 6.62e-04 | 3.39e-04 | 50 |
| hsa0523019 | Esophagus | ESCC | Central carbon metabolism in cancer | 50/4205 | 70/8465 | 1.70e-04 | 6.62e-04 | 3.39e-04 | 50 |
| hsa0523021 | Liver | HCC | Central carbon metabolism in cancer | 43/4020 | 70/8465 | 1.30e-02 | 3.19e-02 | 1.78e-02 | 43 |
| hsa0523031 | Liver | HCC | Central carbon metabolism in cancer | 43/4020 | 70/8465 | 1.30e-02 | 3.19e-02 | 1.78e-02 | 43 |
| hsa0523016 | Oral cavity | OSCC | Central carbon metabolism in cancer | 49/3704 | 70/8465 | 7.57e-06 | 3.59e-05 | 1.83e-05 | 49 |
| hsa0523017 | Oral cavity | OSCC | Central carbon metabolism in cancer | 49/3704 | 70/8465 | 7.57e-06 | 3.59e-05 | 1.83e-05 | 49 |
| hsa0523023 | Oral cavity | LP | Central carbon metabolism in cancer | 31/2418 | 70/8465 | 3.50e-03 | 1.46e-02 | 9.40e-03 | 31 |
| hsa0523033 | Oral cavity | LP | Central carbon metabolism in cancer | 31/2418 | 70/8465 | 3.50e-03 | 1.46e-02 | 9.40e-03 | 31 |
| Page: 1 |
Top |
Cell-cell communication analysis |
| Identification of potential cell-cell interactions between two cell types and their ligand-receptor pairs for different disease states |
| Ligand | Receptor | LRpair | Pathway | Tissue | Disease Stage |
| Page: 1 |
Top |
Single-cell gene regulatory network inference analysis |
| Find out the significant the regulons (TFs) and the target genes of each regulon across cell types for different disease states |
| TF | Cell Type | Tissue | Disease Stage | Target Gene | RSS | Regulon Activity |
| ∗The dot plots of a searched regulon are shown for all cell subpopulations in each disease state of each tissue based on the regulon specific score inferred using pySCENIC and by calculating the average expression. |
| Page: 1 |
Top |
Somatic mutation of malignant transformation related genes |
| Annotation of somatic variants for genes involved in malignant transformation |
| Hugo Symbol | Variant Class | Variant Classification | dbSNP RS | HGVSc | HGVSp | HGVSp Short | SWISSPROT | BIOTYPE | SIFT | PolyPhen | Tumor Sample Barcode | Tissue | Histology | Sex | Age | Stage | Therapy Types | Drugs | Outcome |
| SLC16A3 | deletion | In_Frame_Del | novel | c.19_30delNNNNNNNNNNNN | p.Asp7_Pro10del | p.D7_P10del | O15427 | protein_coding | TCGA-AC-A8OQ-01 | Breast | breast invasive carcinoma | Female | >=65 | I/II | Unknown | Unknown | SD | ||
| SLC16A3 | SNV | Missense_Mutation | c.1030N>G | p.Met344Val | p.M344V | O15427 | protein_coding | deleterious(0) | probably_damaging(0.996) | TCGA-Q1-A5R3-01 | Cervix | cervical & endocervical cancer | Female | <65 | I/II | Chemotherapy | cisplatin | PR | |
| SLC16A3 | SNV | Missense_Mutation | novel | c.701N>T | p.Ala234Val | p.A234V | O15427 | protein_coding | deleterious(0) | probably_damaging(0.924) | TCGA-A6-3809-01 | Colorectum | colon adenocarcinoma | Female | >=65 | I/II | Unknown | Unknown | SD |
| SLC16A3 | SNV | Missense_Mutation | rs751794791 | c.878N>G | p.Tyr293Cys | p.Y293C | O15427 | protein_coding | deleterious(0) | possibly_damaging(0.84) | TCGA-AZ-6601-01 | Colorectum | colon adenocarcinoma | Male | >=65 | I/II | Unknown | Unknown | PD |
| SLC16A3 | SNV | Missense_Mutation | c.302N>A | p.Gly101Asp | p.G101D | O15427 | protein_coding | deleterious(0) | probably_damaging(1) | TCGA-G4-6586-01 | Colorectum | colon adenocarcinoma | Female | >=65 | I/II | Unknown | Unknown | SD | |
| SLC16A3 | SNV | Missense_Mutation | rs754295601 | c.955N>A | p.Gly319Ser | p.G319S | O15427 | protein_coding | tolerated(0.53) | benign(0.072) | TCGA-A5-A2K3-01 | Endometrium | uterine corpus endometrioid carcinoma | Female | >=65 | I/II | Chemotherapy | carboplatin | SD |
| SLC16A3 | SNV | Missense_Mutation | novel | c.416N>T | p.Arg139Leu | p.R139L | O15427 | protein_coding | tolerated(0.26) | benign(0.053) | TCGA-AJ-A3EM-01 | Endometrium | uterine corpus endometrioid carcinoma | Female | >=65 | I/II | Unknown | Unknown | SD |
| SLC16A3 | SNV | Missense_Mutation | novel | c.1099G>A | p.Val367Met | p.V367M | O15427 | protein_coding | deleterious(0.04) | probably_damaging(1) | TCGA-D1-A16Y-01 | Endometrium | uterine corpus endometrioid carcinoma | Female | <65 | I/II | Unknown | Unknown | SD |
| SLC16A3 | SNV | Missense_Mutation | novel | c.22N>A | p.Glu8Lys | p.E8K | O15427 | protein_coding | tolerated(0.29) | benign(0.037) | TCGA-D1-A1O7-01 | Endometrium | uterine corpus endometrioid carcinoma | Female | <65 | I/II | Unknown | Unknown | SD |
| SLC16A3 | SNV | Missense_Mutation | novel | c.1178N>T | p.Ala393Val | p.A393V | O15427 | protein_coding | tolerated(0.4) | benign(0.01) | TCGA-E6-A1LX-01 | Endometrium | uterine corpus endometrioid carcinoma | Female | <65 | I/II | Unknown | Unknown | SD |
| Page: 1 2 3 |
Top |
Related drugs of malignant transformation related genes |
| Identification of chemicals and drugs interact with genes involved in malignant transfromation |
| (DGIdb 4.0) |
| Entrez ID | Symbol | Category | Interaction Types | Drug Claim Name | Drug Name | PMIDs |
| 9123 | SLC16A3 | DRUGGABLE GENOME, TRANSPORTER | STZ | STREPTOZOCIN | 12611763 |
| Page: 1 |

Copyright 2023-Present -The University of Texas Health Science Center at Houston |