
|
|||||
|
 | |
| |
| |
| |
| |
| |
|
Gene: SLAIN2 |
Gene summary for SLAIN2 |
| Gene information | Species | Human | Gene symbol | SLAIN2 | Gene ID | 57606 |
| Gene name | SLAIN motif family member 2 | |
| Gene Alias | KIAA1458 | |
| Cytomap | 4p11 | |
| Gene Type | protein-coding | GO ID | GO:0000226 | UniProtAcc | A0A024R9T6 |
Top |
Malignant transformation analysis |
| Identification of the aberrant gene expression in precancerous and cancerous lesions by comparing the gene expression of stem-like cells in diseased tissues with normal stem cells |
| Entrez ID | Symbol | Replicates | Species | Organ | Tissue | Adj P-value | Log2FC | Malignancy |
| 57606 | SLAIN2 | P9T-E | Human | Esophagus | ESCC | 7.42e-17 | 2.34e-01 | 0.1131 |
| 57606 | SLAIN2 | P10T-E | Human | Esophagus | ESCC | 8.01e-11 | 2.09e-01 | 0.116 |
| 57606 | SLAIN2 | P11T-E | Human | Esophagus | ESCC | 4.83e-16 | 7.39e-01 | 0.1426 |
| 57606 | SLAIN2 | P12T-E | Human | Esophagus | ESCC | 1.88e-25 | 3.90e-01 | 0.1122 |
| 57606 | SLAIN2 | P15T-E | Human | Esophagus | ESCC | 1.59e-21 | 3.45e-01 | 0.1149 |
| 57606 | SLAIN2 | P16T-E | Human | Esophagus | ESCC | 2.25e-21 | 2.42e-01 | 0.1153 |
| 57606 | SLAIN2 | P17T-E | Human | Esophagus | ESCC | 4.89e-07 | 2.56e-01 | 0.1278 |
| 57606 | SLAIN2 | P19T-E | Human | Esophagus | ESCC | 2.86e-12 | 7.54e-01 | 0.1662 |
| 57606 | SLAIN2 | P20T-E | Human | Esophagus | ESCC | 1.69e-08 | 1.63e-01 | 0.1124 |
| 57606 | SLAIN2 | P21T-E | Human | Esophagus | ESCC | 5.46e-27 | 4.54e-01 | 0.1617 |
| 57606 | SLAIN2 | P22T-E | Human | Esophagus | ESCC | 5.79e-13 | 1.16e-01 | 0.1236 |
| 57606 | SLAIN2 | P23T-E | Human | Esophagus | ESCC | 3.55e-23 | 4.43e-01 | 0.108 |
| 57606 | SLAIN2 | P24T-E | Human | Esophagus | ESCC | 1.60e-22 | 3.65e-01 | 0.1287 |
| 57606 | SLAIN2 | P26T-E | Human | Esophagus | ESCC | 2.08e-37 | 7.05e-01 | 0.1276 |
| 57606 | SLAIN2 | P27T-E | Human | Esophagus | ESCC | 1.27e-27 | 3.65e-01 | 0.1055 |
| 57606 | SLAIN2 | P28T-E | Human | Esophagus | ESCC | 5.51e-41 | 6.61e-01 | 0.1149 |
| 57606 | SLAIN2 | P30T-E | Human | Esophagus | ESCC | 1.39e-21 | 8.00e-01 | 0.137 |
| 57606 | SLAIN2 | P31T-E | Human | Esophagus | ESCC | 3.60e-25 | 4.85e-01 | 0.1251 |
| 57606 | SLAIN2 | P32T-E | Human | Esophagus | ESCC | 3.82e-23 | 4.41e-01 | 0.1666 |
| 57606 | SLAIN2 | P36T-E | Human | Esophagus | ESCC | 1.34e-17 | 5.23e-01 | 0.1187 |
| Page: 1 2 3 4 5 6 7 8 |
| Tissue | Expression Dynamics | Abbreviation |
| Colorectum (GSE201348) |  | FAP: Familial adenomatous polyposis |
| CRC: Colorectal cancer | ||
| Colorectum (HTA11) |  | AD: Adenomas |
| SER: Sessile serrated lesions | ||
| MSI-H: Microsatellite-high colorectal cancer | ||
| MSS: Microsatellite stable colorectal cancer | ||
| Esophagus |  | ESCC: Esophageal squamous cell carcinoma |
| HGIN: High-grade intraepithelial neoplasias | ||
| LGIN: Low-grade intraepithelial neoplasias | ||
| Liver | 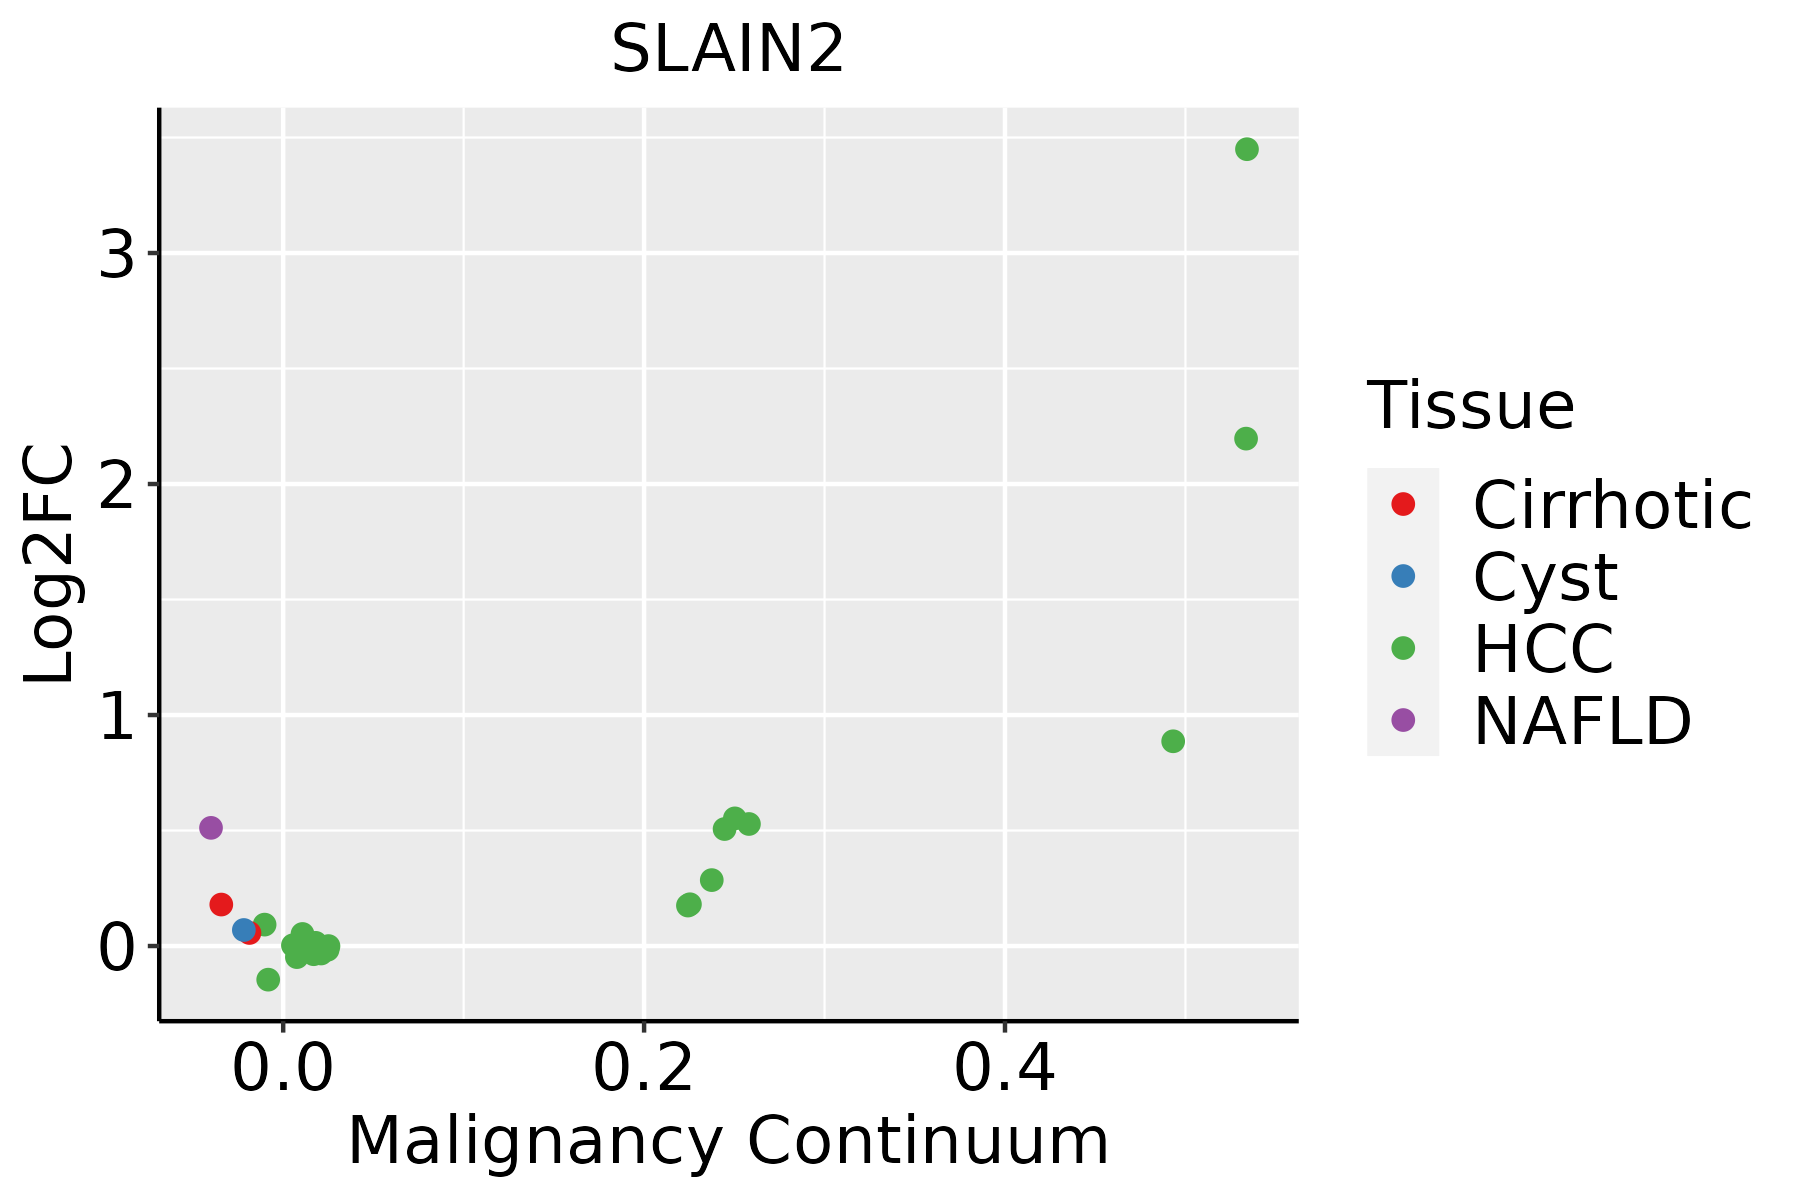 | HCC: Hepatocellular carcinoma |
| NAFLD: Non-alcoholic fatty liver disease | ||
| Oral Cavity |  | EOLP: Erosive Oral lichen planus |
| LP: leukoplakia | ||
| NEOLP: Non-erosive oral lichen planus | ||
| OSCC: Oral squamous cell carcinoma | ||
| Prostate |  | BPH: Benign Prostatic Hyperplasia |
| Skin | 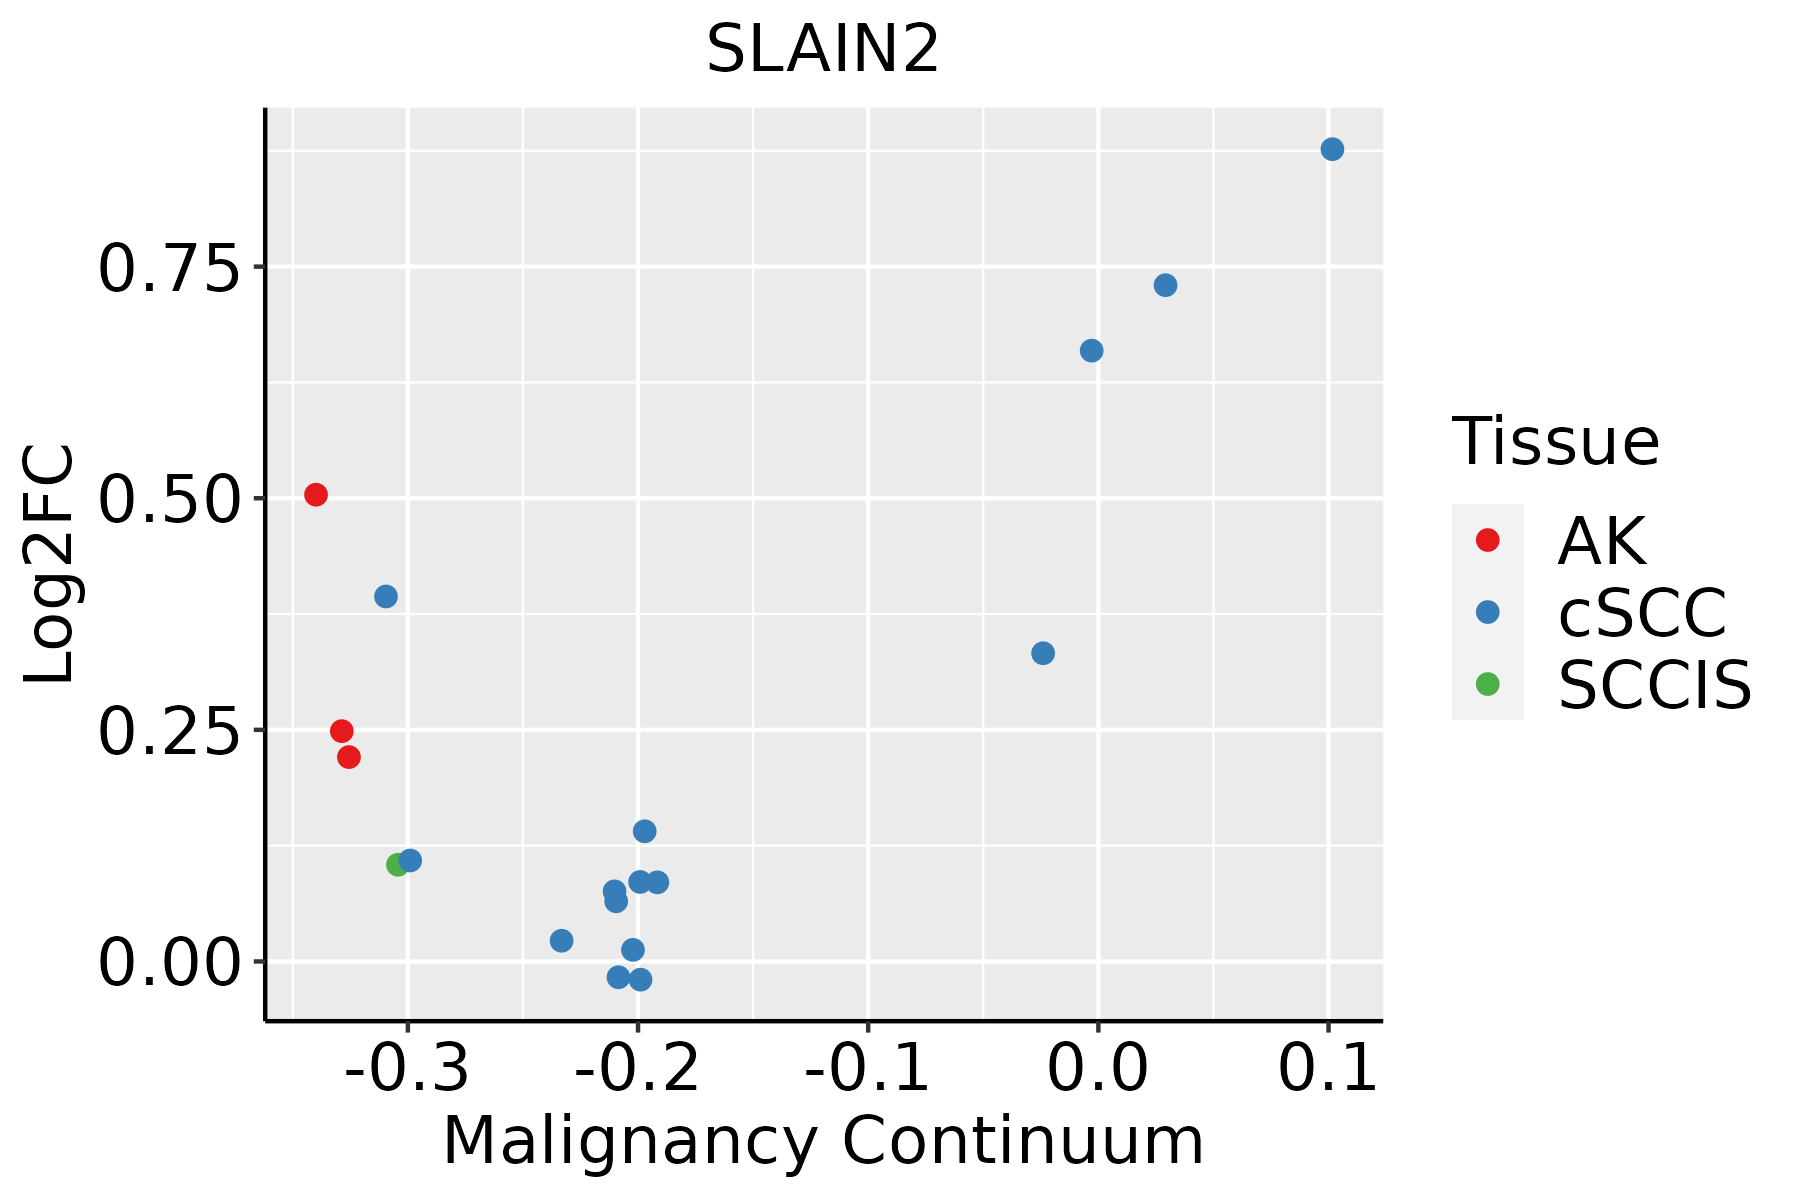 | AK: Actinic keratosis |
| cSCC: Cutaneous squamous cell carcinoma | ||
| SCCIS:squamous cell carcinoma in situ | ||
| Thyroid | 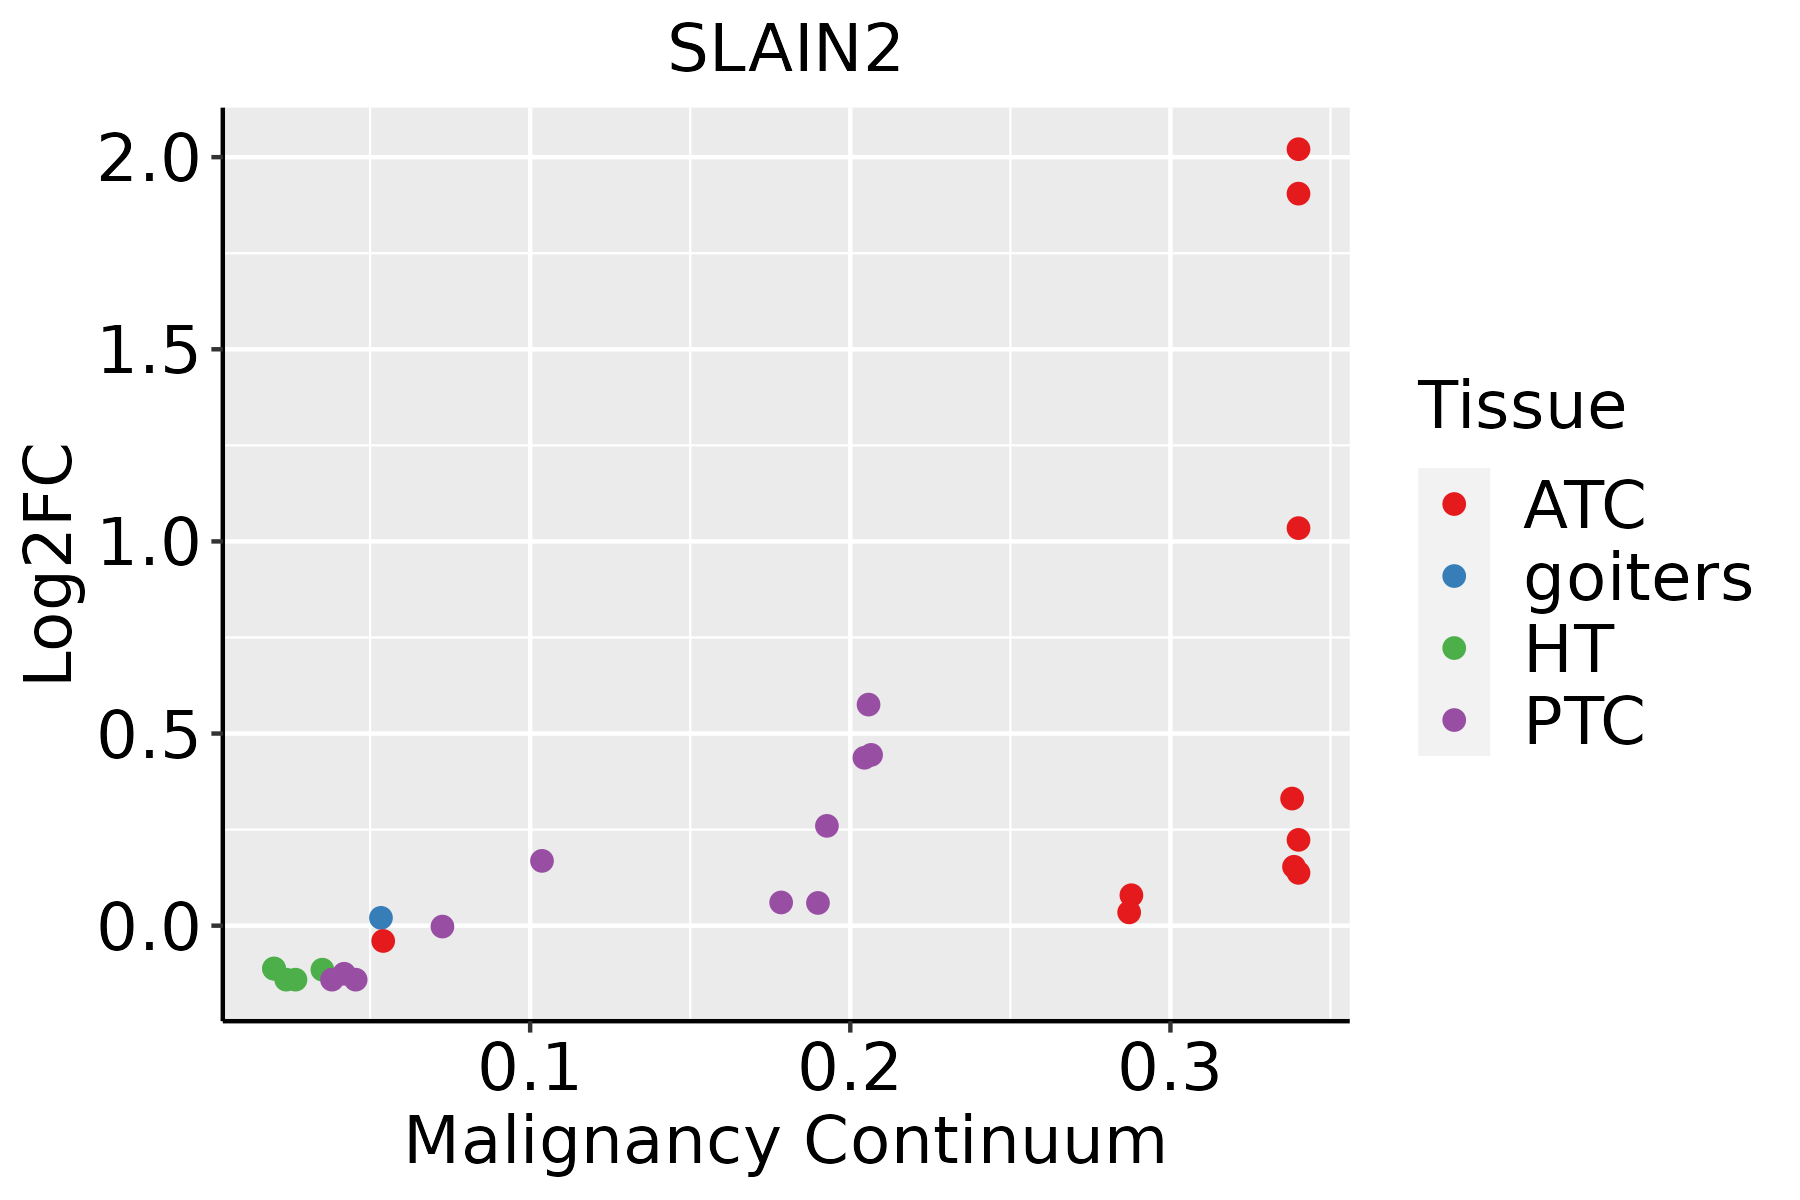 | ATC: Anaplastic thyroid cancer |
| HT: Hashimoto's thyroiditis | ||
| PTC: Papillary thyroid cancer |
| ∗log2FC in expression of this searched gene in stem-like cells from each diseased tissue sample relative to stem-like cells in normal samples in each tissue plotted against the malignancy continuum. Samples are colored based on if they are from different disease stage. |
Top |
Malignant transformation related pathway analysis |
| Find out the enriched GO biological processes and KEGG pathways involved in transition from healthy to precancer to cancer |
| Tissue | Disease Stage | Enriched GO biological Processes |
| Colorectum | AD |  |
| Colorectum | SER |  |
| Colorectum | MSS |  |
| Colorectum | MSI-H |  |
| Colorectum | FAP |  |
| ∗Top 15 enriched GO BP terms are showed in the bar plot of each disease state in each tissue. Each row represents a significant GO biological process which is colored according to the -log10(p.adjust). |
| Page: 1 2 3 4 5 6 7 8 9 |
| GO ID | Tissue | Disease Stage | Description | Gene Ratio | Bg Ratio | pvalue | p.adjust | Count |
| GO:1902903 | Colorectum | AD | regulation of supramolecular fiber organization | 139/3918 | 383/18723 | 2.01e-12 | 3.19e-10 | 139 |
| GO:0032271 | Colorectum | AD | regulation of protein polymerization | 94/3918 | 233/18723 | 1.01e-11 | 1.29e-09 | 94 |
| GO:0051258 | Colorectum | AD | protein polymerization | 112/3918 | 297/18723 | 1.85e-11 | 2.27e-09 | 112 |
| GO:0043254 | Colorectum | AD | regulation of protein-containing complex assembly | 148/3918 | 428/18723 | 2.64e-11 | 3.18e-09 | 148 |
| GO:1902905 | Colorectum | AD | positive regulation of supramolecular fiber organization | 85/3918 | 209/18723 | 5.95e-11 | 6.33e-09 | 85 |
| GO:0051495 | Colorectum | AD | positive regulation of cytoskeleton organization | 89/3918 | 226/18723 | 1.61e-10 | 1.56e-08 | 89 |
| GO:0032273 | Colorectum | AD | positive regulation of protein polymerization | 62/3918 | 138/18723 | 1.94e-10 | 1.76e-08 | 62 |
| GO:0031334 | Colorectum | AD | positive regulation of protein-containing complex assembly | 91/3918 | 237/18723 | 4.78e-10 | 3.99e-08 | 91 |
| GO:0070507 | Colorectum | AD | regulation of microtubule cytoskeleton organization | 44/3918 | 148/18723 | 7.05e-03 | 4.31e-02 | 44 |
| GO:19029032 | Colorectum | MSS | regulation of supramolecular fiber organization | 121/3467 | 383/18723 | 3.63e-10 | 3.28e-08 | 121 |
| GO:00322712 | Colorectum | MSS | regulation of protein polymerization | 83/3467 | 233/18723 | 3.99e-10 | 3.49e-08 | 83 |
| GO:00432542 | Colorectum | MSS | regulation of protein-containing complex assembly | 130/3467 | 428/18723 | 1.38e-09 | 1.03e-07 | 130 |
| GO:19029052 | Colorectum | MSS | positive regulation of supramolecular fiber organization | 75/3467 | 209/18723 | 1.89e-09 | 1.35e-07 | 75 |
| GO:00313342 | Colorectum | MSS | positive regulation of protein-containing complex assembly | 82/3467 | 237/18723 | 2.49e-09 | 1.75e-07 | 82 |
| GO:00512582 | Colorectum | MSS | protein polymerization | 97/3467 | 297/18723 | 2.98e-09 | 2.07e-07 | 97 |
| GO:00322732 | Colorectum | MSS | positive regulation of protein polymerization | 55/3467 | 138/18723 | 3.84e-09 | 2.55e-07 | 55 |
| GO:00514952 | Colorectum | MSS | positive regulation of cytoskeleton organization | 78/3467 | 226/18723 | 6.86e-09 | 4.32e-07 | 78 |
| GO:00432544 | Colorectum | FAP | regulation of protein-containing complex assembly | 101/2622 | 428/18723 | 5.18e-08 | 4.07e-06 | 101 |
| GO:19029034 | Colorectum | FAP | regulation of supramolecular fiber organization | 92/2622 | 383/18723 | 8.48e-08 | 5.77e-06 | 92 |
| GO:00322714 | Colorectum | FAP | regulation of protein polymerization | 62/2622 | 233/18723 | 2.64e-07 | 1.53e-05 | 62 |
| Page: 1 2 3 4 5 6 7 8 9 10 11 12 |
| Pathway ID | Tissue | Disease Stage | Description | Gene Ratio | Bg Ratio | pvalue | p.adjust | qvalue | Count |
| Page: 1 |
Top |
Cell-cell communication analysis |
| Identification of potential cell-cell interactions between two cell types and their ligand-receptor pairs for different disease states |
| Ligand | Receptor | LRpair | Pathway | Tissue | Disease Stage |
| Page: 1 |
Top |
Single-cell gene regulatory network inference analysis |
| Find out the significant the regulons (TFs) and the target genes of each regulon across cell types for different disease states |
| TF | Cell Type | Tissue | Disease Stage | Target Gene | RSS | Regulon Activity |
| ∗The dot plots of a searched regulon are shown for all cell subpopulations in each disease state of each tissue based on the regulon specific score inferred using pySCENIC and by calculating the average expression. |
| Page: 1 |
Top |
Somatic mutation of malignant transformation related genes |
| Annotation of somatic variants for genes involved in malignant transformation |
| Hugo Symbol | Variant Class | Variant Classification | dbSNP RS | HGVSc | HGVSp | HGVSp Short | SWISSPROT | BIOTYPE | SIFT | PolyPhen | Tumor Sample Barcode | Tissue | Histology | Sex | Age | Stage | Therapy Types | Drugs | Outcome |
| SLAIN2 | SNV | Missense_Mutation | c.488N>C | p.Val163Ala | p.V163A | Q9P270 | protein_coding | deleterious(0.03) | benign(0.121) | TCGA-A8-A094-01 | Breast | breast invasive carcinoma | Female | >=65 | I/II | Unknown | Unknown | SD | |
| SLAIN2 | insertion | Nonsense_Mutation | novel | c.1662_1663insATTTTCAAATATTGAACCAACCTTGCATCTTGGAATAAATCCTCCTTA | p.Leu554_Ala555insIlePheLysTyrTerThrAsnLeuAlaSerTrpAsnLysSerSerLeu | p.L554_A555insIFKY*TNLASWNKSSL | Q9P270 | protein_coding | TCGA-A2-A0CP-01 | Breast | breast invasive carcinoma | Female | <65 | I/II | Chemotherapy | cytoxan | SD | ||
| SLAIN2 | SNV | Missense_Mutation | novel | c.154G>A | p.Ala52Thr | p.A52T | Q9P270 | protein_coding | tolerated(0.14) | benign(0.005) | TCGA-MA-AA42-01 | Cervix | cervical & endocervical cancer | Female | >=65 | I/II | Unknown | Unknown | SD |
| SLAIN2 | SNV | Missense_Mutation | rs750212863 | c.1094G>A | p.Arg365Gln | p.R365Q | Q9P270 | protein_coding | tolerated(0.06) | probably_damaging(0.996) | TCGA-AA-3870-01 | Colorectum | colon adenocarcinoma | Female | >=65 | III/IV | Chemotherapy | folinic | CR |
| SLAIN2 | SNV | Missense_Mutation | rs774856780 | c.1337N>A | p.Arg446His | p.R446H | Q9P270 | protein_coding | deleterious(0) | benign(0.058) | TCGA-CM-6171-01 | Colorectum | colon adenocarcinoma | Female | >=65 | I/II | Unknown | Unknown | SD |
| SLAIN2 | SNV | Missense_Mutation | c.1613N>T | p.Arg538Ile | p.R538I | Q9P270 | protein_coding | deleterious(0) | probably_damaging(0.994) | TCGA-D5-6930-01 | Colorectum | colon adenocarcinoma | Male | >=65 | I/II | Unknown | Unknown | SD | |
| SLAIN2 | SNV | Missense_Mutation | rs866212190 | c.1055N>T | p.Pro352Leu | p.P352L | Q9P270 | protein_coding | tolerated(0.09) | probably_damaging(0.998) | TCGA-EI-6884-01 | Colorectum | rectum adenocarcinoma | Male | >=65 | III/IV | Chemotherapy | 5 | SD |
| SLAIN2 | SNV | Missense_Mutation | novel | c.1052G>A | p.Arg351Gln | p.R351Q | Q9P270 | protein_coding | tolerated(0.1) | possibly_damaging(0.744) | TCGA-EI-6917-01 | Colorectum | rectum adenocarcinoma | Male | <65 | III/IV | Chemotherapy | 5fluorouracil+oxaciplatina+l-folinian | SD |
| SLAIN2 | SNV | Missense_Mutation | novel | c.552G>T | p.Gln184His | p.Q184H | Q9P270 | protein_coding | tolerated(0.13) | benign(0.007) | TCGA-F5-6814-01 | Colorectum | rectum adenocarcinoma | Male | <65 | I/II | Unknown | Unknown | SD |
| SLAIN2 | insertion | Nonsense_Mutation | novel | c.1148_1149insGTGA | p.Ser383ArgfsTer2 | p.S383Rfs*2 | Q9P270 | protein_coding | TCGA-AM-5820-01 | Colorectum | colon adenocarcinoma | Female | <65 | I/II | Unknown | Unknown | SD |
| Page: 1 2 3 4 5 |
Top |
Related drugs of malignant transformation related genes |
| Identification of chemicals and drugs interact with genes involved in malignant transfromation |
| (DGIdb 4.0) |
| Entrez ID | Symbol | Category | Interaction Types | Drug Claim Name | Drug Name | PMIDs |
| Page: 1 |

Copyright 2023-Present -The University of Texas Health Science Center at Houston |