| Tissue | Expression Dynamics | Abbreviation |
| Cervix | 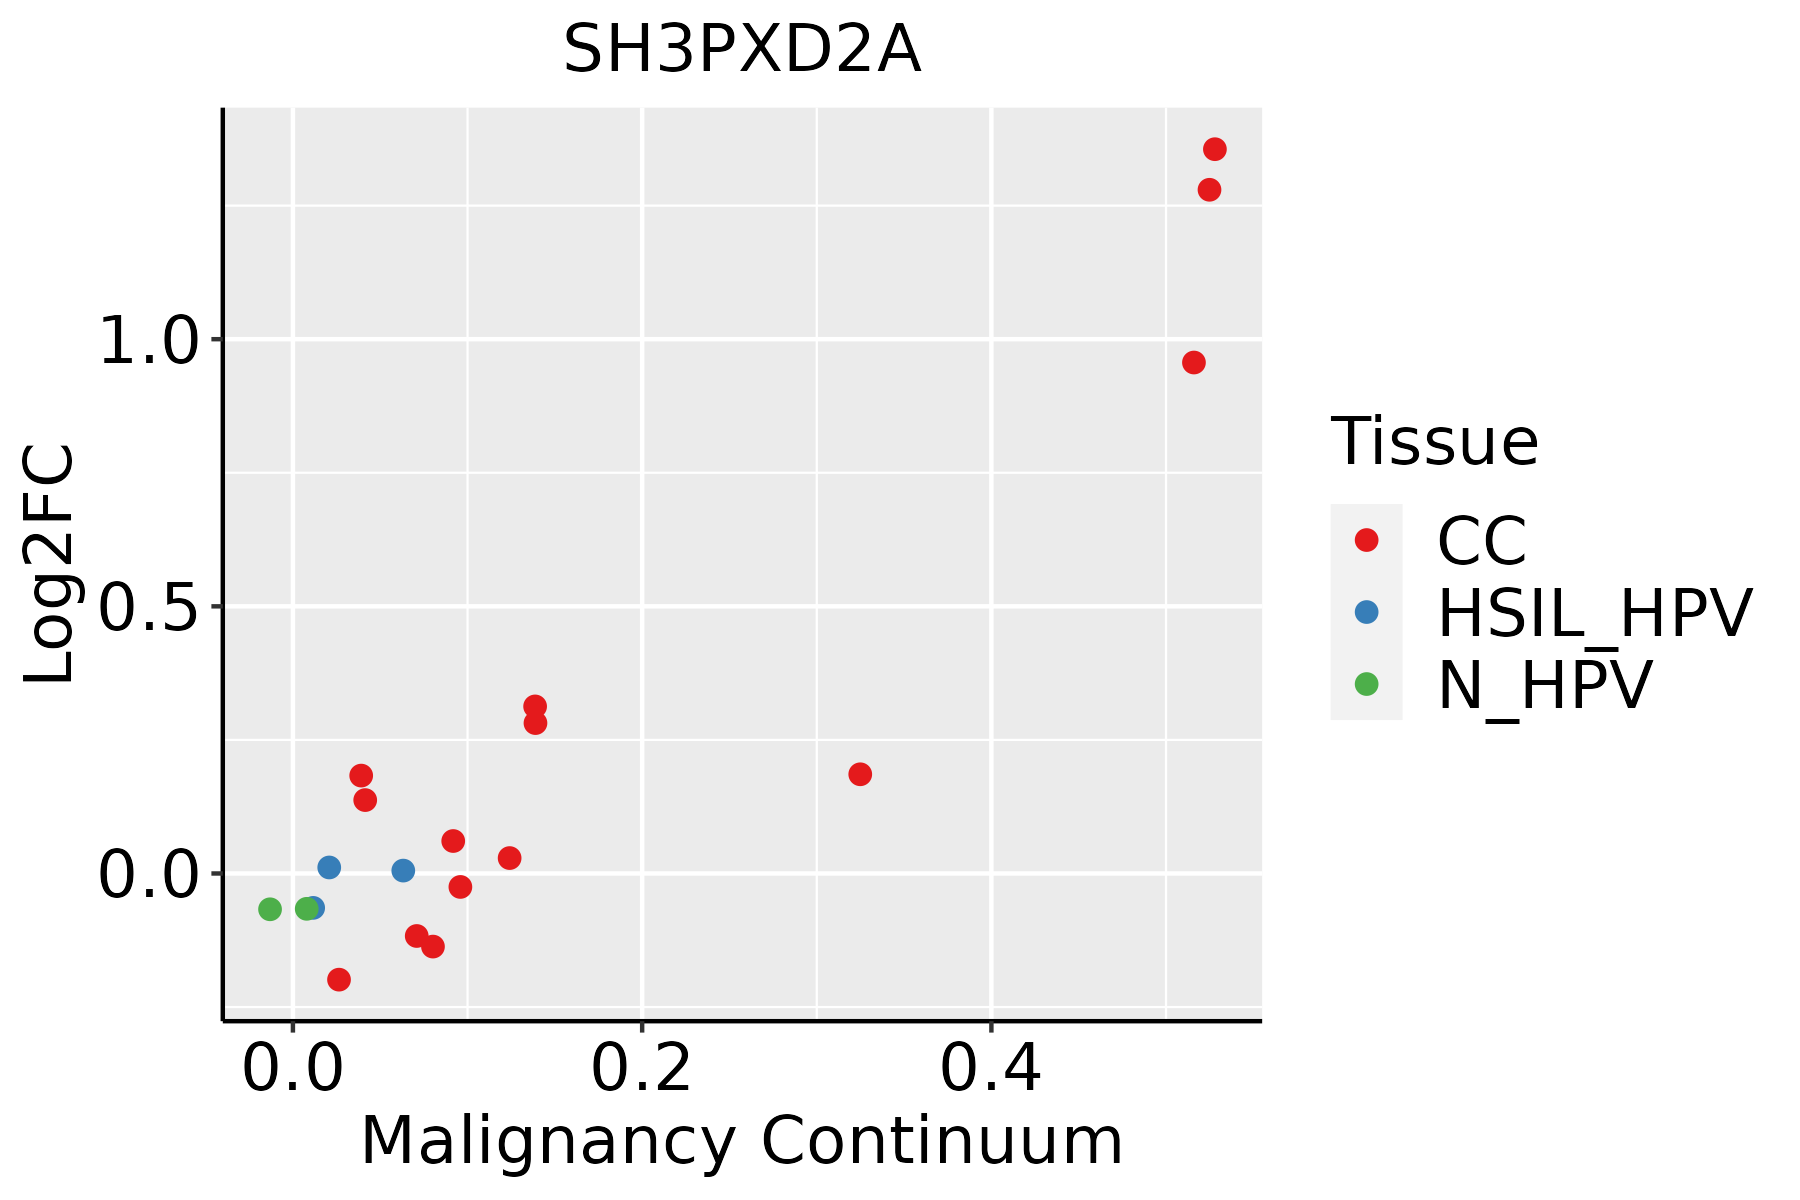 | CC: Cervix cancer |
| HSIL_HPV: HPV-infected high-grade squamous intraepithelial lesions |
| N_HPV: HPV-infected normal cervix |
| Colorectum (GSE201348) |  | FAP: Familial adenomatous polyposis |
| CRC: Colorectal cancer |
| Colorectum (HTA11) | 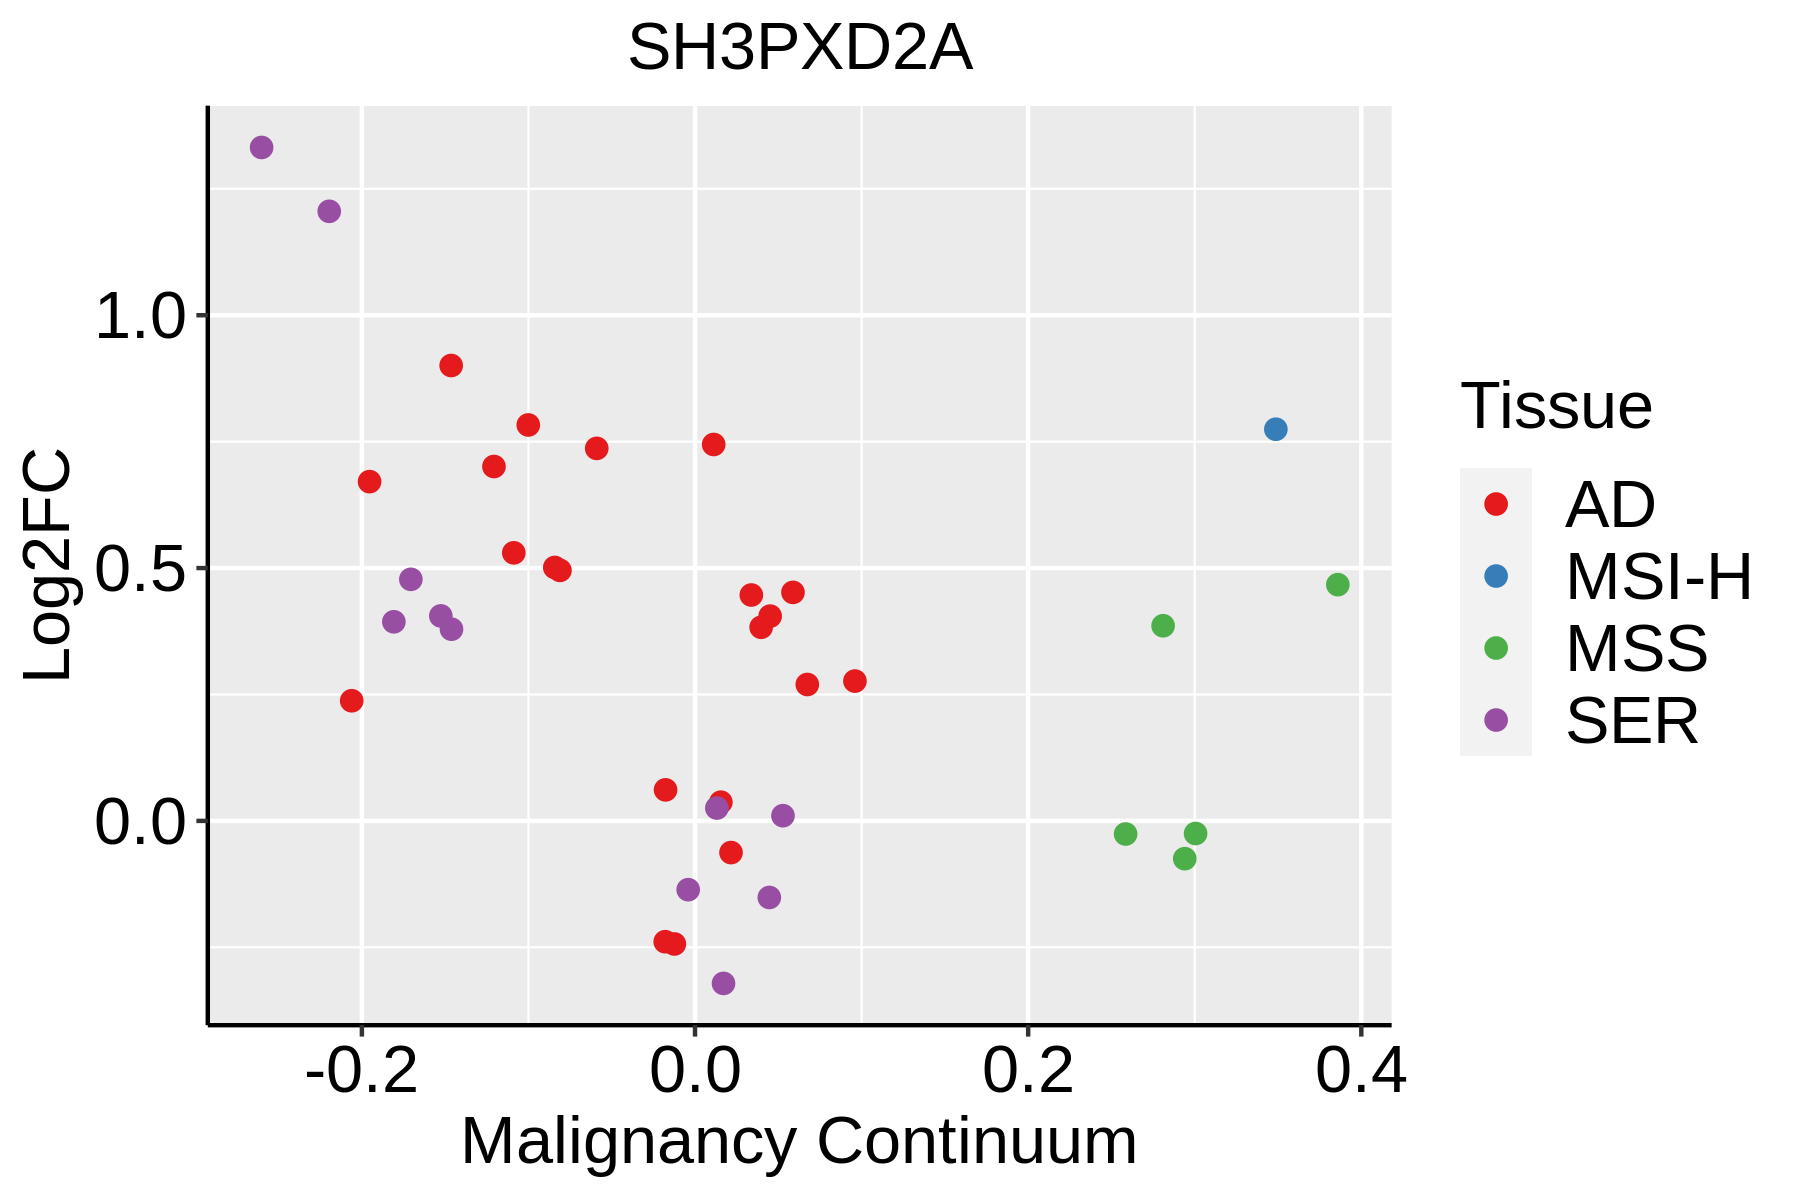 | AD: Adenomas |
| SER: Sessile serrated lesions |
| MSI-H: Microsatellite-high colorectal cancer |
| MSS: Microsatellite stable colorectal cancer |
| Esophagus |  | ESCC: Esophageal squamous cell carcinoma |
| HGIN: High-grade intraepithelial neoplasias |
| LGIN: Low-grade intraepithelial neoplasias |
| Liver |  | HCC: Hepatocellular carcinoma |
| NAFLD: Non-alcoholic fatty liver disease |
| Oral Cavity | 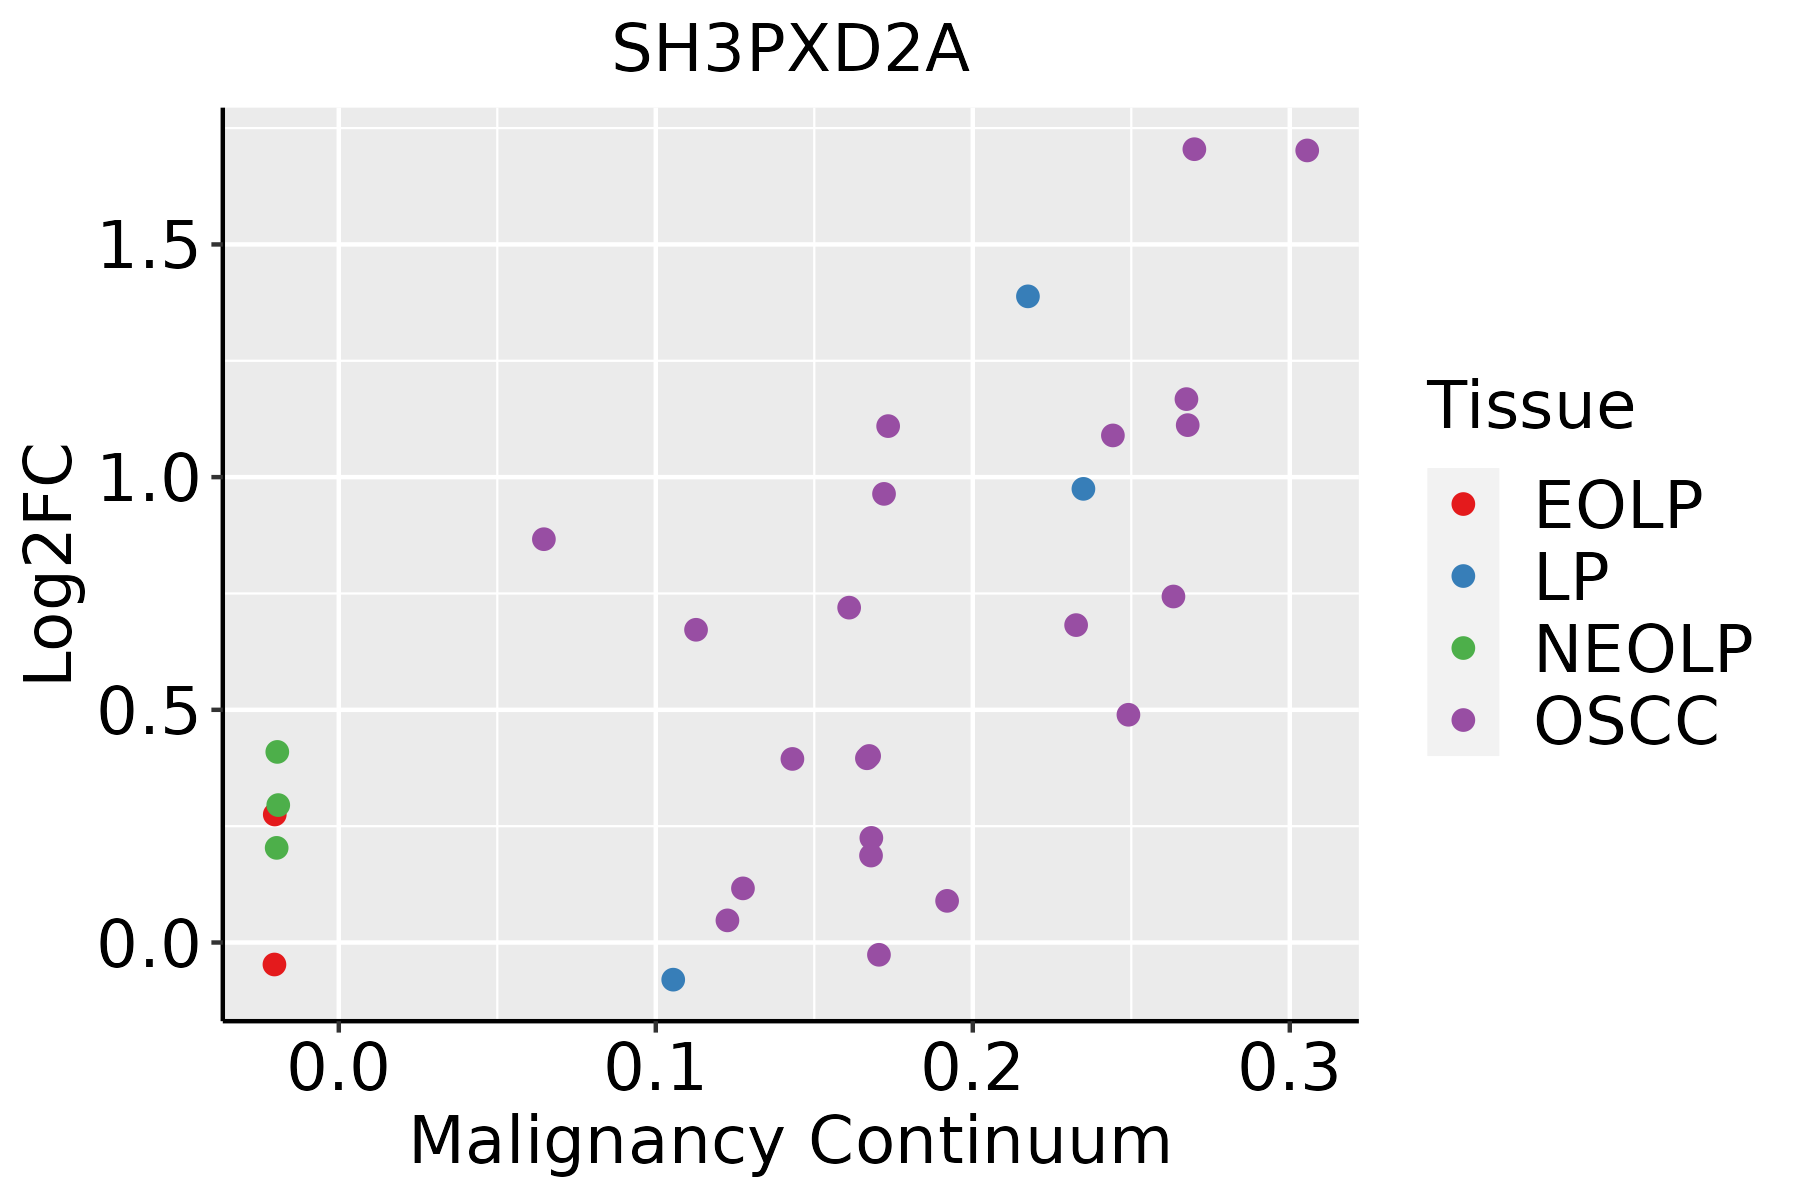 | EOLP: Erosive Oral lichen planus |
| LP: leukoplakia |
| NEOLP: Non-erosive oral lichen planus |
| OSCC: Oral squamous cell carcinoma |
| Prostate | 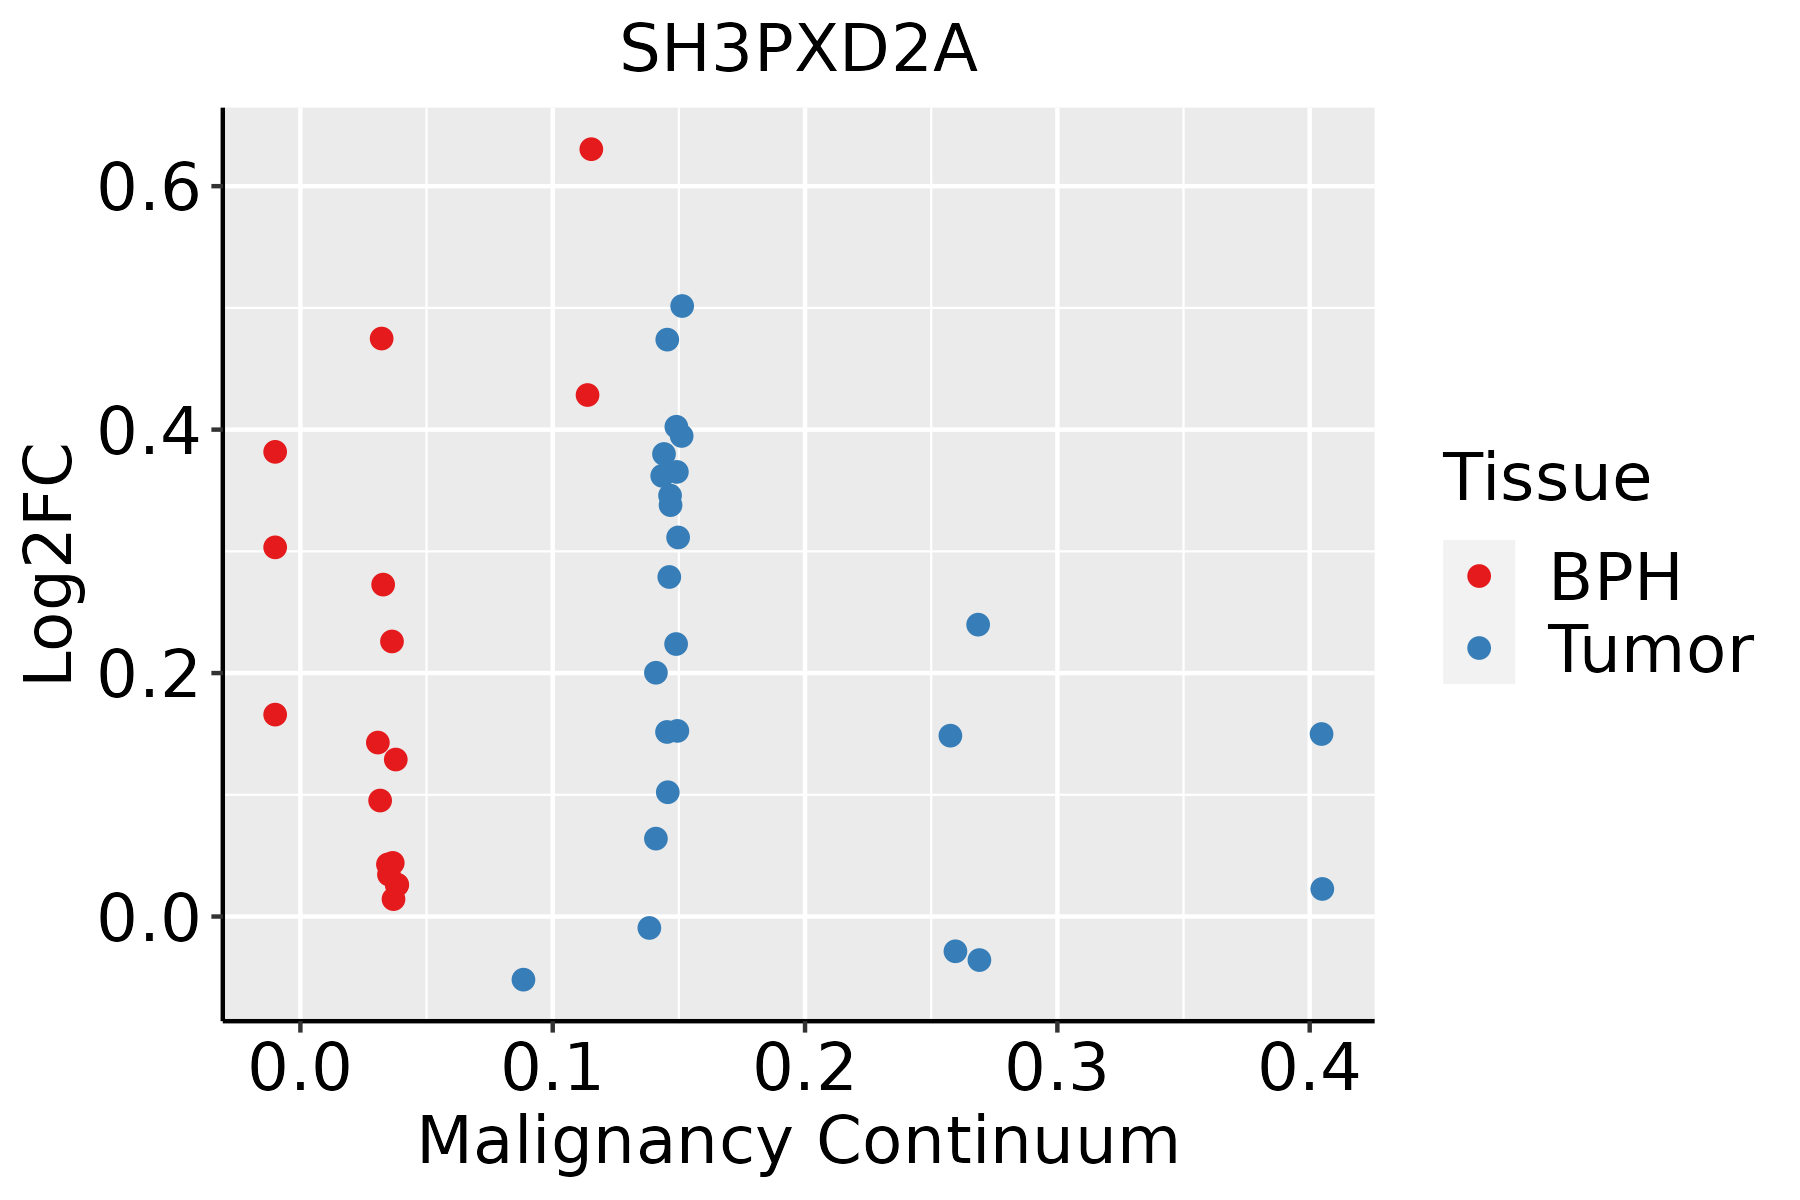 | BPH: Benign Prostatic Hyperplasia |
| Skin | 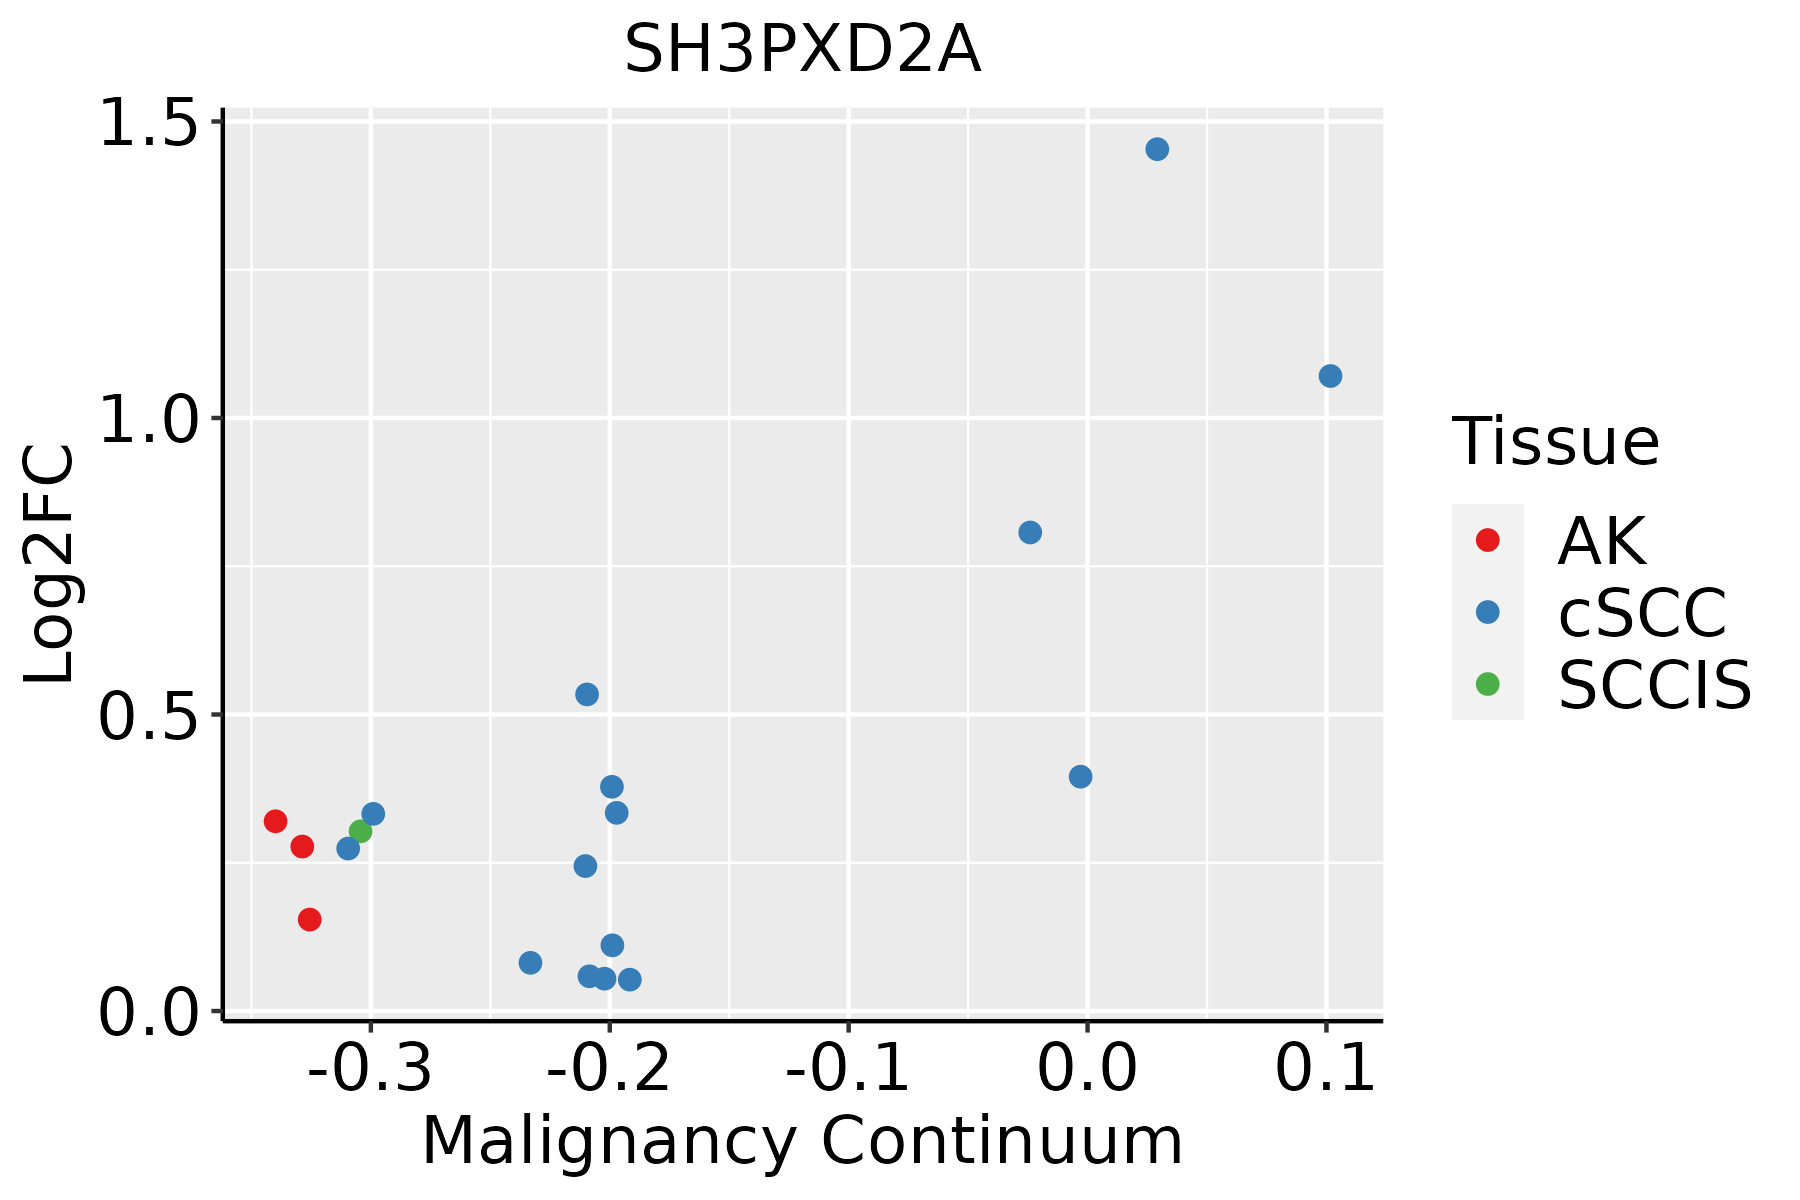 | AK: Actinic keratosis |
| cSCC: Cutaneous squamous cell carcinoma |
| SCCIS:squamous cell carcinoma in situ |
| Thyroid | 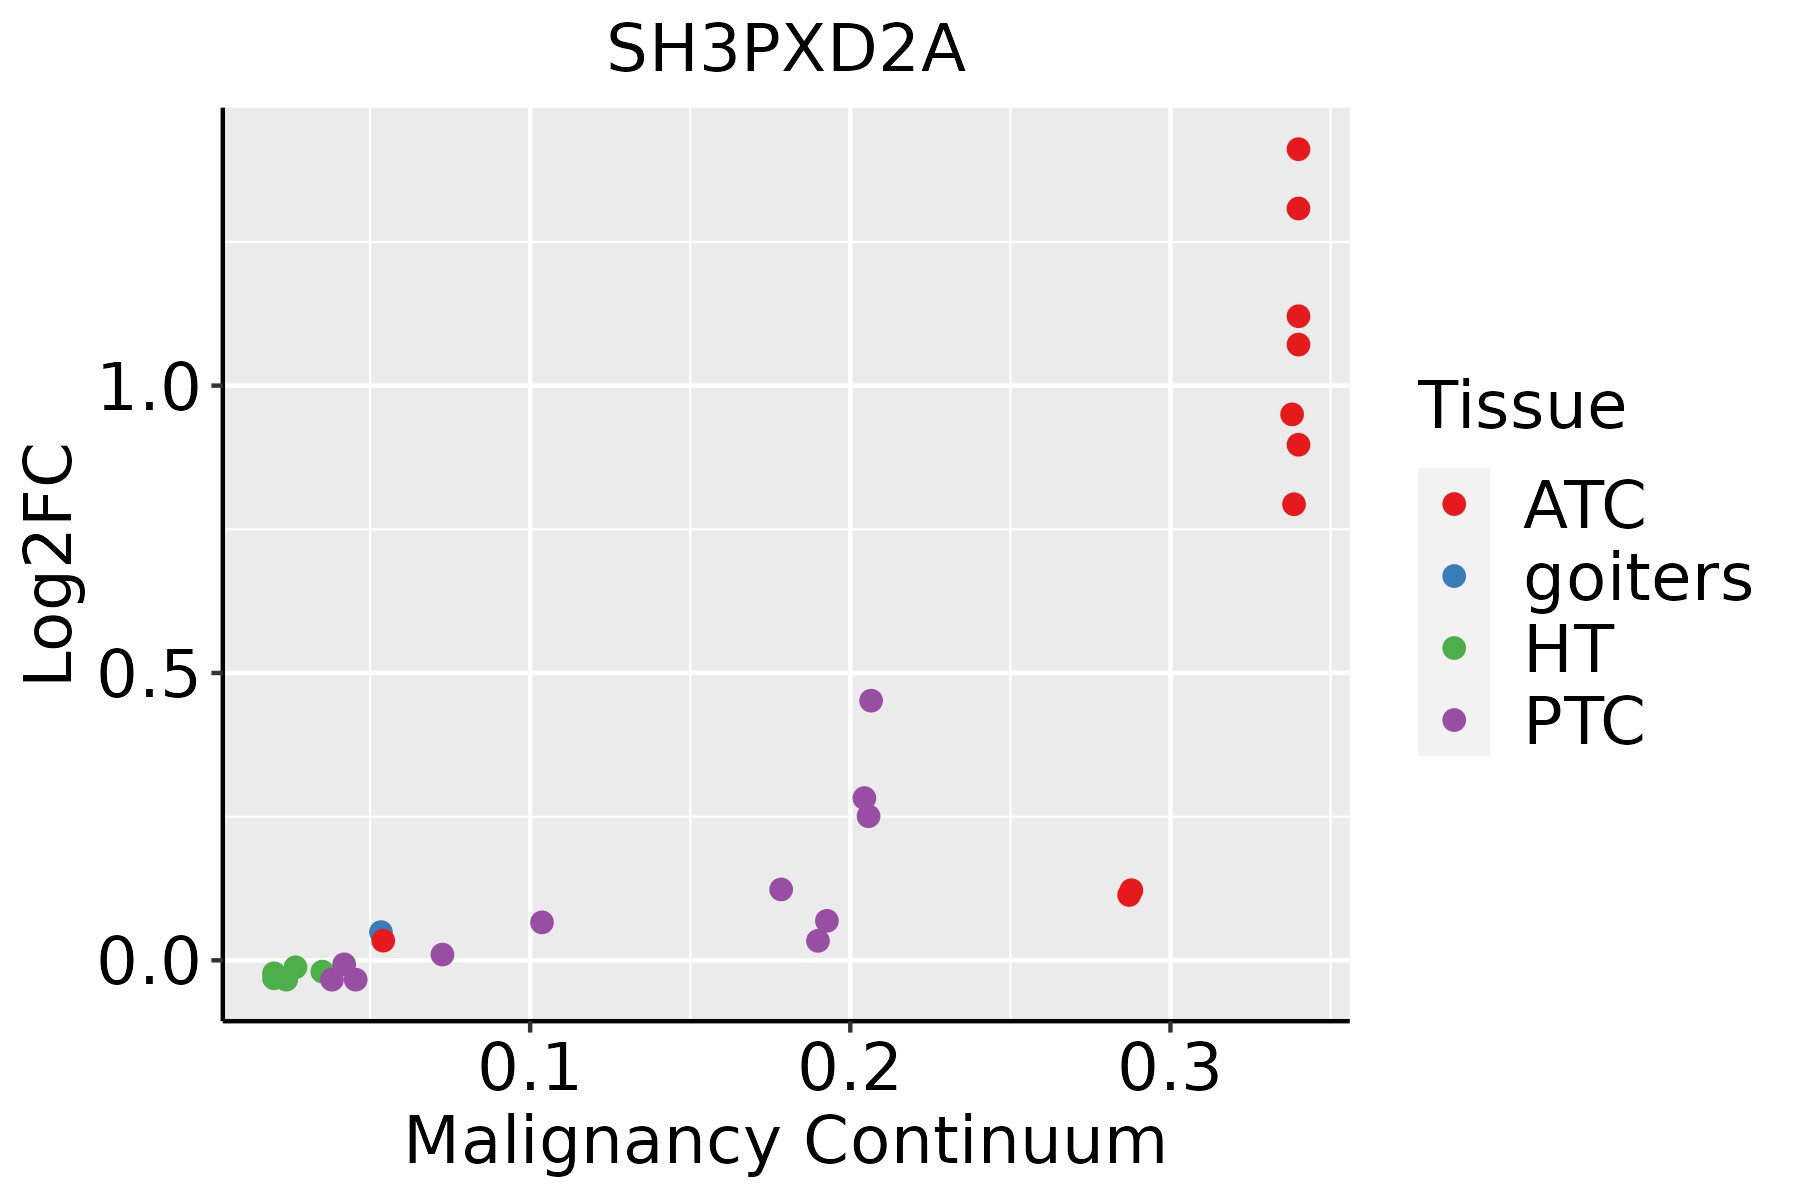 | ATC: Anaplastic thyroid cancer |
| HT: Hashimoto's thyroiditis |
| PTC: Papillary thyroid cancer |
| GO ID | Tissue | Disease Stage | Description | Gene Ratio | Bg Ratio | pvalue | p.adjust | Count |
| GO:003009910 | Cervix | CC | myeloid cell differentiation | 83/2311 | 381/18723 | 1.31e-07 | 6.42e-06 | 83 |
| GO:00025738 | Cervix | CC | myeloid leukocyte differentiation | 47/2311 | 208/18723 | 2.48e-05 | 4.27e-04 | 47 |
| GO:00017018 | Cervix | CC | in utero embryonic development | 71/2311 | 367/18723 | 7.21e-05 | 1.00e-03 | 71 |
| GO:00725939 | Cervix | CC | reactive oxygen species metabolic process | 47/2311 | 239/18723 | 7.74e-04 | 6.87e-03 | 47 |
| GO:0000768 | Cervix | CC | syncytium formation by plasma membrane fusion | 15/2311 | 55/18723 | 2.14e-03 | 1.54e-02 | 15 |
| GO:0140253 | Cervix | CC | cell-cell fusion | 15/2311 | 55/18723 | 2.14e-03 | 1.54e-02 | 15 |
| GO:00069491 | Cervix | CC | syncytium formation | 15/2311 | 57/18723 | 3.13e-03 | 2.05e-02 | 15 |
| GO:0006801 | Cervix | CC | superoxide metabolic process | 17/2311 | 74/18723 | 7.73e-03 | 4.10e-02 | 17 |
| GO:0030316 | Cervix | CC | osteoclast differentiation | 20/2311 | 94/18723 | 9.92e-03 | 4.86e-02 | 20 |
| GO:0030099 | Colorectum | AD | myeloid cell differentiation | 119/3918 | 381/18723 | 1.24e-06 | 4.01e-05 | 119 |
| GO:0001701 | Colorectum | AD | in utero embryonic development | 110/3918 | 367/18723 | 2.36e-05 | 4.62e-04 | 110 |
| GO:0072593 | Colorectum | AD | reactive oxygen species metabolic process | 73/3918 | 239/18723 | 2.79e-04 | 3.42e-03 | 73 |
| GO:0002573 | Colorectum | AD | myeloid leukocyte differentiation | 60/3918 | 208/18723 | 4.03e-03 | 2.81e-02 | 60 |
| GO:00725931 | Colorectum | SER | reactive oxygen species metabolic process | 61/2897 | 239/18723 | 3.63e-05 | 9.39e-04 | 61 |
| GO:00300991 | Colorectum | SER | myeloid cell differentiation | 80/2897 | 381/18723 | 2.28e-03 | 2.18e-02 | 80 |
| GO:00017011 | Colorectum | SER | in utero embryonic development | 77/2897 | 367/18723 | 2.77e-03 | 2.48e-02 | 77 |
| GO:00017013 | Colorectum | FAP | in utero embryonic development | 81/2622 | 367/18723 | 1.58e-05 | 4.10e-04 | 81 |
| GO:00300994 | Colorectum | FAP | myeloid cell differentiation | 81/2622 | 381/18723 | 6.33e-05 | 1.22e-03 | 81 |
| GO:00300995 | Colorectum | CRC | myeloid cell differentiation | 66/2078 | 381/18723 | 1.59e-04 | 2.87e-03 | 66 |
| GO:00025733 | Colorectum | CRC | myeloid leukocyte differentiation | 36/2078 | 208/18723 | 4.57e-03 | 3.57e-02 | 36 |
| Hugo Symbol | Variant Class | Variant Classification | dbSNP RS | HGVSc | HGVSp | HGVSp Short | SWISSPROT | BIOTYPE | SIFT | PolyPhen | Tumor Sample Barcode | Tissue | Histology | Sex | Age | Stage | Therapy Types | Drugs | Outcome |
| SH3PXD2A | SNV | Missense_Mutation | novel | c.2608G>A | p.Glu870Lys | p.E870K | Q5TCZ1 | protein_coding | tolerated(0.57) | benign(0.048) | TCGA-5L-AAT1-01 | Breast | breast invasive carcinoma | Female | <65 | III/IV | Hormone Therapy | letrozol | SD |
| SH3PXD2A | SNV | Missense_Mutation | novel | c.739N>A | p.Gln247Lys | p.Q247K | Q5TCZ1 | protein_coding | tolerated(0.12) | probably_damaging(0.946) | TCGA-A2-A25A-01 | Breast | breast invasive carcinoma | Female | <65 | I/II | Unspecific | Cytoxan | SD |
| SH3PXD2A | SNV | Missense_Mutation | | c.1133C>G | p.Ser378Cys | p.S378C | Q5TCZ1 | protein_coding | deleterious(0) | probably_damaging(0.988) | TCGA-AC-A2B8-01 | Breast | breast invasive carcinoma | Female | >=65 | I/II | Chemotherapy | chemo | PD |
| SH3PXD2A | SNV | Missense_Mutation | rs553552960 | c.1090G>A | p.Val364Met | p.V364M | Q5TCZ1 | protein_coding | tolerated(0.28) | benign(0.005) | TCGA-AO-A128-01 | Breast | breast invasive carcinoma | Female | <65 | I/II | Chemotherapy | doxorubicin | SD |
| SH3PXD2A | SNV | Missense_Mutation | | c.1996N>G | p.Ile666Val | p.I666V | Q5TCZ1 | protein_coding | tolerated_low_confidence(0.43) | benign(0) | TCGA-BH-A0BT-01 | Breast | breast invasive carcinoma | Female | <65 | I/II | Chemotherapy | adriamycin | CR |
| SH3PXD2A | SNV | Missense_Mutation | | c.778N>C | p.Glu260Gln | p.E260Q | Q5TCZ1 | protein_coding | deleterious(0) | possibly_damaging(0.844) | TCGA-C8-A12T-01 | Breast | breast invasive carcinoma | Female | <65 | I/II | Unknown | Unknown | SD |
| SH3PXD2A | SNV | Missense_Mutation | novel | c.1665N>C | p.Glu555Asp | p.E555D | Q5TCZ1 | protein_coding | tolerated_low_confidence(0.49) | benign(0) | TCGA-C8-A8HP-01 | Breast | breast invasive carcinoma | Female | <65 | III/IV | Chemotherapy | 5-fluorouracil | CR |
| SH3PXD2A | SNV | Missense_Mutation | | c.2421N>C | p.Lys807Asn | p.K807N | Q5TCZ1 | protein_coding | tolerated(0.13) | benign(0.003) | TCGA-D8-A1JA-01 | Breast | breast invasive carcinoma | Female | <65 | III/IV | Chemotherapy | adriamycin | PD |
| SH3PXD2A | SNV | Missense_Mutation | rs369836291 | c.2981G>A | p.Arg994His | p.R994H | Q5TCZ1 | protein_coding | tolerated(0.08) | possibly_damaging(0.674) | TCGA-E9-A295-01 | Breast | breast invasive carcinoma | Female | >=65 | I/II | Hormone Therapy | tamoxiphen | SD |
| SH3PXD2A | insertion | Frame_Shift_Ins | novel | c.2162_2163insCCAGCCAGGGT | p.Pro722GlnfsTer17 | p.P722Qfs*17 | Q5TCZ1 | protein_coding | | | TCGA-AN-A0FS-01 | Breast | breast invasive carcinoma | Female | <65 | I/II | Unknown | Unknown | SD |


