
|
|||||
|
 | |
| |
| |
| |
| |
| |
|
Gene: SFXN4 |
Gene summary for SFXN4 |
| Gene information | Species | Human | Gene symbol | SFXN4 | Gene ID | 119559 |
| Gene name | sideroflexin 4 | |
| Gene Alias | BCRM1 | |
| Cytomap | 10q26.11 | |
| Gene Type | protein-coding | GO ID | GO:0006810 | UniProtAcc | Q6P4A7 |
Top |
Malignant transformation analysis |
| Identification of the aberrant gene expression in precancerous and cancerous lesions by comparing the gene expression of stem-like cells in diseased tissues with normal stem cells |
| Entrez ID | Symbol | Replicates | Species | Organ | Tissue | Adj P-value | Log2FC | Malignancy |
| 119559 | SFXN4 | P36T-E | Human | Esophagus | ESCC | 8.14e-13 | 5.00e-01 | 0.1187 |
| 119559 | SFXN4 | P37T-E | Human | Esophagus | ESCC | 2.17e-14 | 2.95e-01 | 0.1371 |
| 119559 | SFXN4 | P38T-E | Human | Esophagus | ESCC | 1.87e-04 | 2.11e-01 | 0.127 |
| 119559 | SFXN4 | P39T-E | Human | Esophagus | ESCC | 3.12e-10 | 2.83e-01 | 0.0894 |
| 119559 | SFXN4 | P40T-E | Human | Esophagus | ESCC | 4.83e-02 | 1.47e-01 | 0.109 |
| 119559 | SFXN4 | P42T-E | Human | Esophagus | ESCC | 1.08e-06 | 2.99e-01 | 0.1175 |
| 119559 | SFXN4 | P44T-E | Human | Esophagus | ESCC | 8.83e-08 | 2.23e-01 | 0.1096 |
| 119559 | SFXN4 | P47T-E | Human | Esophagus | ESCC | 2.22e-08 | 1.83e-01 | 0.1067 |
| 119559 | SFXN4 | P48T-E | Human | Esophagus | ESCC | 4.59e-19 | 3.43e-01 | 0.0959 |
| 119559 | SFXN4 | P49T-E | Human | Esophagus | ESCC | 6.41e-06 | 8.12e-01 | 0.1768 |
| 119559 | SFXN4 | P52T-E | Human | Esophagus | ESCC | 5.57e-17 | 3.48e-01 | 0.1555 |
| 119559 | SFXN4 | P54T-E | Human | Esophagus | ESCC | 8.43e-18 | 5.01e-01 | 0.0975 |
| 119559 | SFXN4 | P56T-E | Human | Esophagus | ESCC | 1.47e-09 | 1.27e+00 | 0.1613 |
| 119559 | SFXN4 | P57T-E | Human | Esophagus | ESCC | 8.98e-14 | 2.11e-01 | 0.0926 |
| 119559 | SFXN4 | P61T-E | Human | Esophagus | ESCC | 2.96e-12 | 1.29e-01 | 0.099 |
| 119559 | SFXN4 | P62T-E | Human | Esophagus | ESCC | 1.02e-27 | 6.28e-01 | 0.1302 |
| 119559 | SFXN4 | P65T-E | Human | Esophagus | ESCC | 9.47e-15 | 2.60e-01 | 0.0978 |
| 119559 | SFXN4 | P74T-E | Human | Esophagus | ESCC | 1.27e-18 | 4.73e-01 | 0.1479 |
| 119559 | SFXN4 | P75T-E | Human | Esophagus | ESCC | 2.14e-29 | 6.00e-01 | 0.1125 |
| 119559 | SFXN4 | P76T-E | Human | Esophagus | ESCC | 8.44e-24 | 5.35e-01 | 0.1207 |
| Page: 1 2 3 4 5 |
| Tissue | Expression Dynamics | Abbreviation |
| Colorectum (GSE201348) |  | FAP: Familial adenomatous polyposis |
| CRC: Colorectal cancer | ||
| Colorectum (HTA11) |  | AD: Adenomas |
| SER: Sessile serrated lesions | ||
| MSI-H: Microsatellite-high colorectal cancer | ||
| MSS: Microsatellite stable colorectal cancer | ||
| Esophagus | 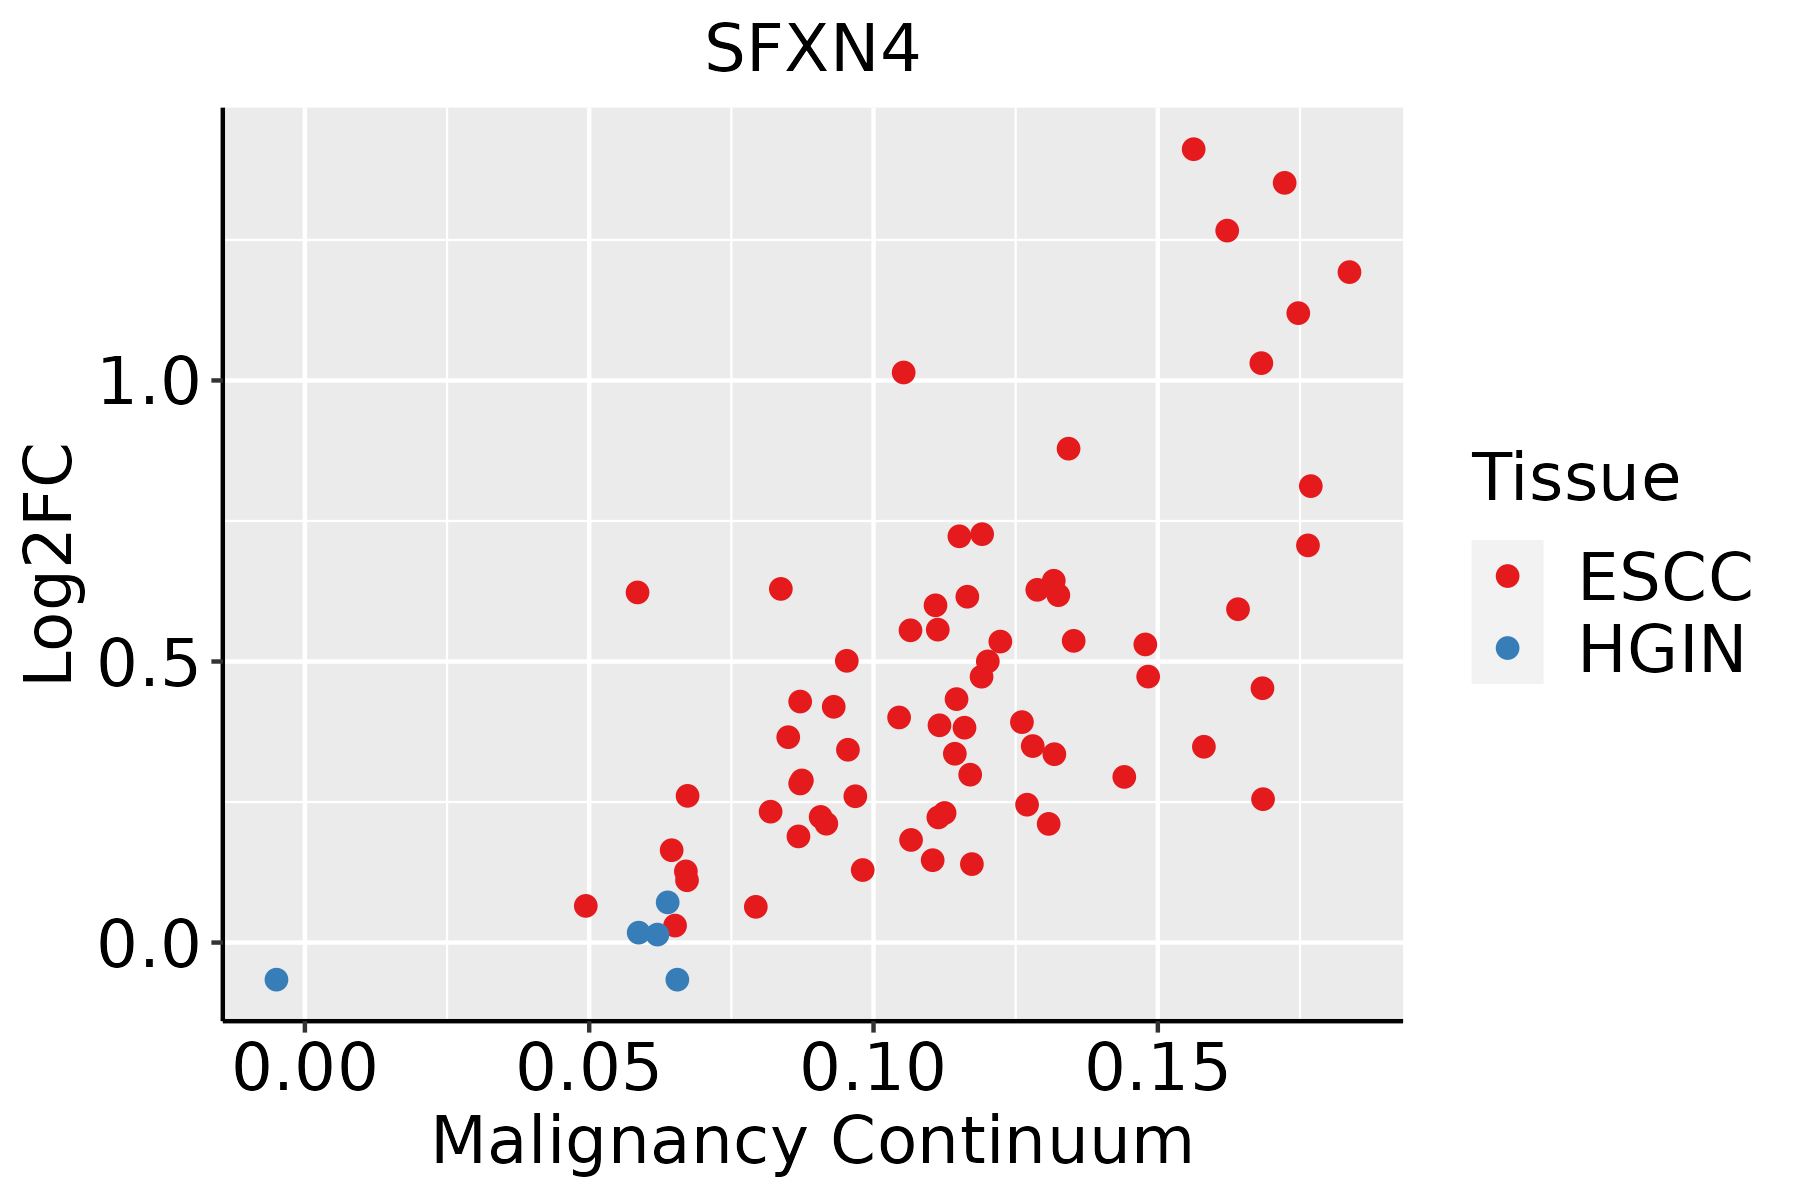 | ESCC: Esophageal squamous cell carcinoma |
| HGIN: High-grade intraepithelial neoplasias | ||
| LGIN: Low-grade intraepithelial neoplasias | ||
| Liver |  | HCC: Hepatocellular carcinoma |
| NAFLD: Non-alcoholic fatty liver disease | ||
| Oral Cavity | 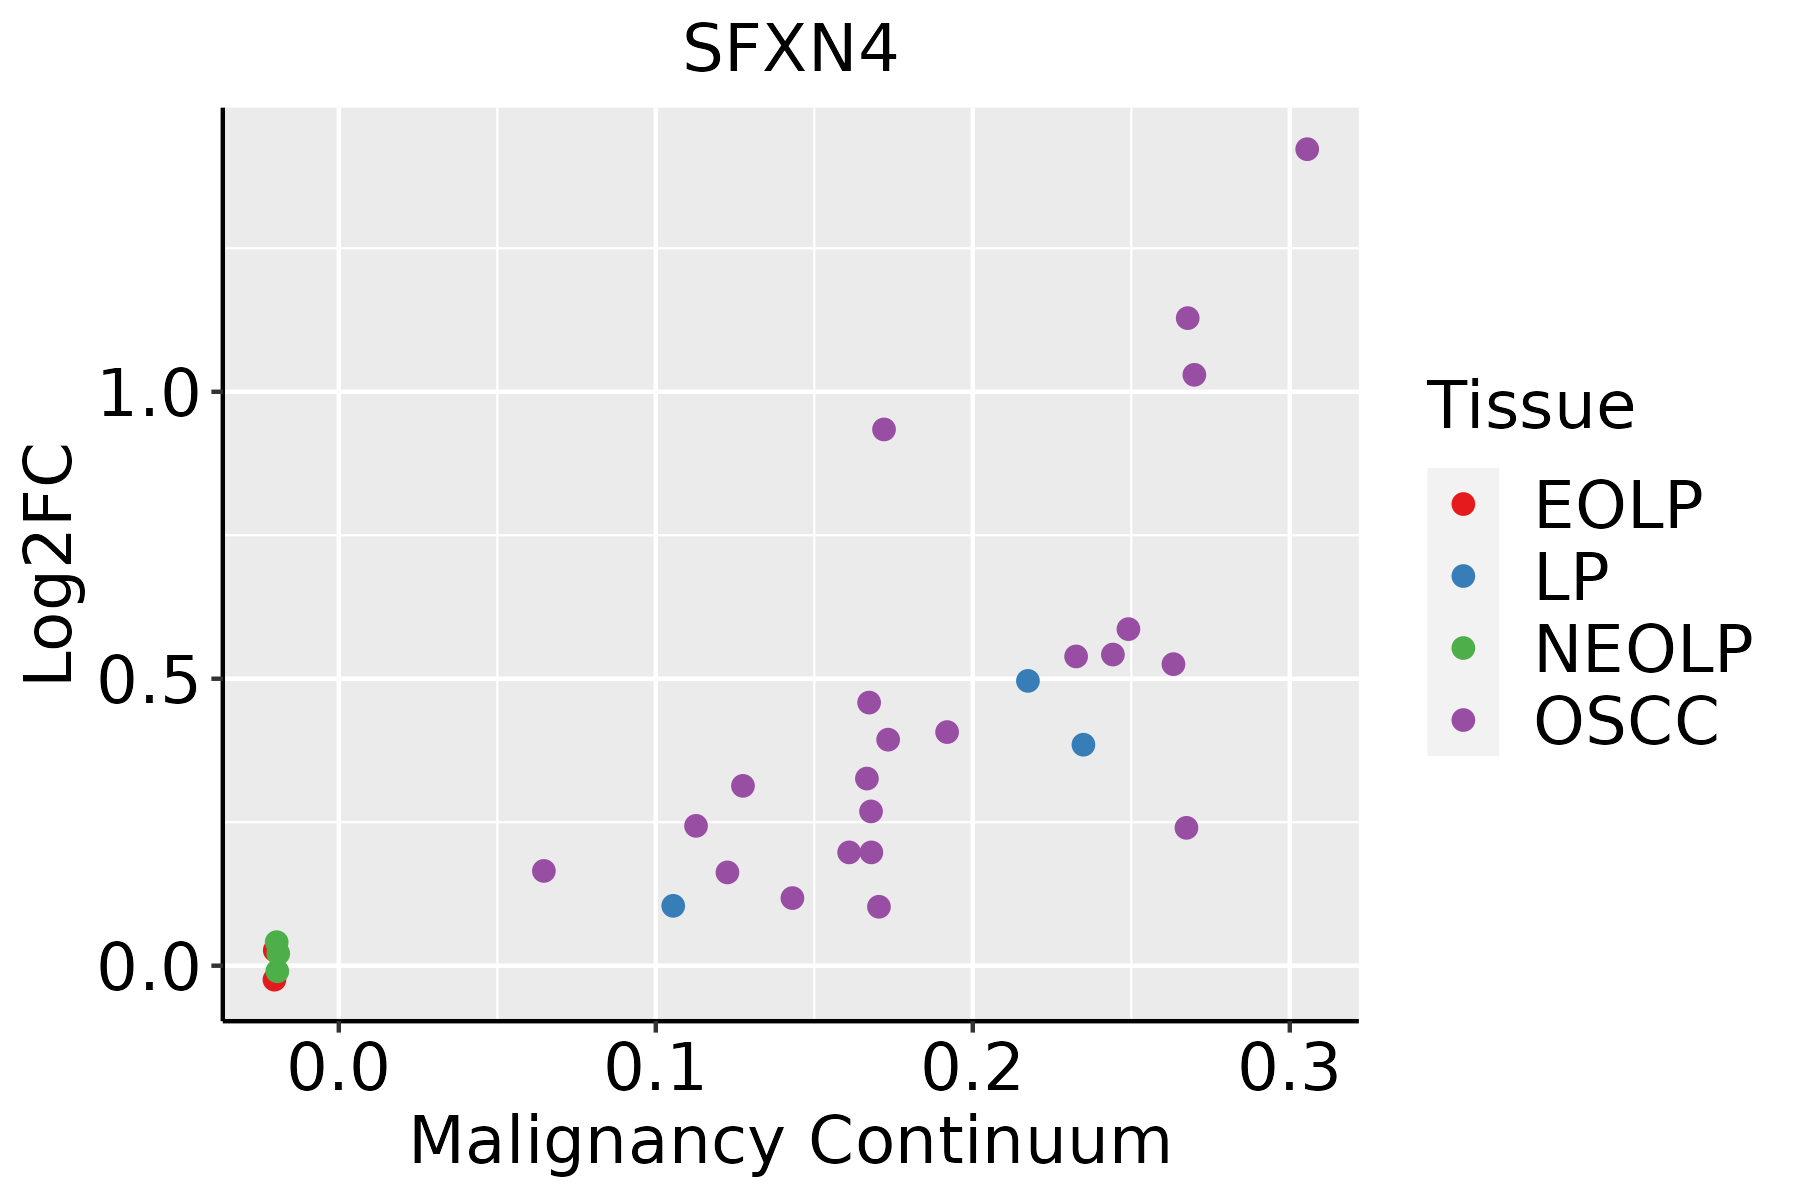 | EOLP: Erosive Oral lichen planus |
| LP: leukoplakia | ||
| NEOLP: Non-erosive oral lichen planus | ||
| OSCC: Oral squamous cell carcinoma |
| ∗log2FC in expression of this searched gene in stem-like cells from each diseased tissue sample relative to stem-like cells in normal samples in each tissue plotted against the malignancy continuum. Samples are colored based on if they are from different disease stage. |
Top |
Malignant transformation related pathway analysis |
| Find out the enriched GO biological processes and KEGG pathways involved in transition from healthy to precancer to cancer |
| Tissue | Disease Stage | Enriched GO biological Processes |
| Colorectum | AD |  |
| Colorectum | SER |  |
| Colorectum | MSS |  |
| Colorectum | MSI-H |  |
| Colorectum | FAP |  |
| ∗Top 15 enriched GO BP terms are showed in the bar plot of each disease state in each tissue. Each row represents a significant GO biological process which is colored according to the -log10(p.adjust). |
| Page: 1 2 3 4 5 6 7 8 9 |
| GO ID | Tissue | Disease Stage | Description | Gene Ratio | Bg Ratio | pvalue | p.adjust | Count |
| GO:0006839 | Colorectum | AD | mitochondrial transport | 102/3918 | 254/18723 | 1.87e-12 | 3.08e-10 | 102 |
| GO:1990542 | Colorectum | AD | mitochondrial transmembrane transport | 47/3918 | 102/18723 | 1.09e-08 | 6.52e-07 | 47 |
| GO:00068392 | Colorectum | MSS | mitochondrial transport | 93/3467 | 254/18723 | 6.14e-12 | 9.82e-10 | 93 |
| GO:19905422 | Colorectum | MSS | mitochondrial transmembrane transport | 41/3467 | 102/18723 | 2.70e-07 | 1.11e-05 | 41 |
| GO:19905423 | Colorectum | FAP | mitochondrial transmembrane transport | 29/2622 | 102/18723 | 1.09e-04 | 1.80e-03 | 29 |
| GO:00068394 | Colorectum | FAP | mitochondrial transport | 55/2622 | 254/18723 | 5.58e-04 | 6.24e-03 | 55 |
| GO:0006839110 | Esophagus | ESCC | mitochondrial transport | 187/8552 | 254/18723 | 8.35e-20 | 9.81e-18 | 187 |
| GO:1990542110 | Esophagus | ESCC | mitochondrial transmembrane transport | 72/8552 | 102/18723 | 2.94e-07 | 4.23e-06 | 72 |
| GO:000683912 | Liver | HCC | mitochondrial transport | 184/7958 | 254/18723 | 2.30e-22 | 3.83e-20 | 184 |
| GO:199054212 | Liver | HCC | mitochondrial transmembrane transport | 78/7958 | 102/18723 | 2.73e-12 | 1.26e-10 | 78 |
| GO:000683918 | Oral cavity | OSCC | mitochondrial transport | 162/7305 | 254/18723 | 8.96e-16 | 6.52e-14 | 162 |
| GO:199054218 | Oral cavity | OSCC | mitochondrial transmembrane transport | 56/7305 | 102/18723 | 8.06e-04 | 4.32e-03 | 56 |
| GO:000683919 | Oral cavity | LP | mitochondrial transport | 119/4623 | 254/18723 | 1.06e-14 | 1.33e-12 | 119 |
| GO:199054219 | Oral cavity | LP | mitochondrial transmembrane transport | 37/4623 | 102/18723 | 5.93e-03 | 3.53e-02 | 37 |
| Page: 1 |
| Pathway ID | Tissue | Disease Stage | Description | Gene Ratio | Bg Ratio | pvalue | p.adjust | qvalue | Count |
| Page: 1 |
Top |
Cell-cell communication analysis |
| Identification of potential cell-cell interactions between two cell types and their ligand-receptor pairs for different disease states |
| Ligand | Receptor | LRpair | Pathway | Tissue | Disease Stage |
| Page: 1 |
Top |
Single-cell gene regulatory network inference analysis |
| Find out the significant the regulons (TFs) and the target genes of each regulon across cell types for different disease states |
| TF | Cell Type | Tissue | Disease Stage | Target Gene | RSS | Regulon Activity |
| ∗The dot plots of a searched regulon are shown for all cell subpopulations in each disease state of each tissue based on the regulon specific score inferred using pySCENIC and by calculating the average expression. |
| Page: 1 |
Top |
Somatic mutation of malignant transformation related genes |
| Annotation of somatic variants for genes involved in malignant transformation |
| Hugo Symbol | Variant Class | Variant Classification | dbSNP RS | HGVSc | HGVSp | HGVSp Short | SWISSPROT | BIOTYPE | SIFT | PolyPhen | Tumor Sample Barcode | Tissue | Histology | Sex | Age | Stage | Therapy Types | Drugs | Outcome |
| SFXN4 | SNV | Missense_Mutation | rs751311051 | c.239N>T | p.Ser80Leu | p.S80L | Q6P4A7 | protein_coding | tolerated(1) | benign(0.001) | TCGA-GM-A3XN-01 | Breast | breast invasive carcinoma | Female | <65 | III/IV | Chemotherapy | paclitaxel | CR |
| SFXN4 | insertion | In_Frame_Ins | novel | c.365_366insGGGGAGATGTTGGCGTCAGACAAGCCTGGGCCCTCATCC | p.Phe122delinsLeuGlyArgCysTrpArgGlnThrSerLeuGlyProHisPro | p.F122delinsLGRCWRQTSLGPHP | Q6P4A7 | protein_coding | TCGA-A2-A0CP-01 | Breast | breast invasive carcinoma | Female | <65 | I/II | Chemotherapy | cytoxan | SD | ||
| SFXN4 | SNV | Missense_Mutation | c.306N>A | p.Asn102Lys | p.N102K | Q6P4A7 | protein_coding | tolerated(1) | benign(0.006) | TCGA-EK-A3GJ-01 | Cervix | cervical & endocervical cancer | Female | <65 | I/II | Unknown | Unknown | SD | |
| SFXN4 | SNV | Missense_Mutation | c.275G>C | p.Ser92Thr | p.S92T | Q6P4A7 | protein_coding | deleterious(0.05) | benign(0.322) | TCGA-AA-3673-01 | Colorectum | colon adenocarcinoma | Female | <65 | I/II | Unknown | Unknown | SD | |
| SFXN4 | SNV | Missense_Mutation | novel | c.776C>G | p.Thr259Ser | p.T259S | Q6P4A7 | protein_coding | tolerated(0.07) | benign(0.259) | TCGA-AA-3877-01 | Colorectum | colon adenocarcinoma | Female | >=65 | I/II | Unknown | Unknown | SD |
| SFXN4 | SNV | Missense_Mutation | novel | c.491G>A | p.Arg164Lys | p.R164K | Q6P4A7 | protein_coding | tolerated(1) | benign(0.137) | TCGA-AA-A029-01 | Colorectum | colon adenocarcinoma | Male | >=65 | I/II | Unknown | Unknown | SD |
| SFXN4 | SNV | Missense_Mutation | c.335C>A | p.Ala112Glu | p.A112E | Q6P4A7 | protein_coding | deleterious(0) | probably_damaging(0.98) | TCGA-AD-6964-01 | Colorectum | colon adenocarcinoma | Male | <65 | III/IV | Chemotherapy | folfox | PD | |
| SFXN4 | SNV | Missense_Mutation | rs747282264 | c.746C>T | p.Thr249Met | p.T249M | Q6P4A7 | protein_coding | deleterious(0) | probably_damaging(0.998) | TCGA-F5-6814-01 | Colorectum | rectum adenocarcinoma | Male | <65 | I/II | Unknown | Unknown | SD |
| SFXN4 | SNV | Missense_Mutation | novel | c.790N>A | p.Pro264Thr | p.P264T | Q6P4A7 | protein_coding | tolerated(0.07) | probably_damaging(0.997) | TCGA-A5-A0G1-01 | Endometrium | uterine corpus endometrioid carcinoma | Female | >=65 | I/II | Unknown | Unknown | SD |
| SFXN4 | SNV | Missense_Mutation | rs368065380 | c.377N>T | p.Thr126Met | p.T126M | Q6P4A7 | protein_coding | tolerated(0.7) | benign(0) | TCGA-AJ-A3OK-01 | Endometrium | uterine corpus endometrioid carcinoma | Female | >=65 | I/II | Chemotherapy | carboplatin | CR |
| Page: 1 2 3 4 |
Top |
Related drugs of malignant transformation related genes |
| Identification of chemicals and drugs interact with genes involved in malignant transfromation |
| (DGIdb 4.0) |
| Entrez ID | Symbol | Category | Interaction Types | Drug Claim Name | Drug Name | PMIDs |
| Page: 1 |

Copyright 2023-Present -The University of Texas Health Science Center at Houston |