
|
|||||
|
 | |
| |
| |
| |
| |
| |
|
Gene: SFR1 |
Gene summary for SFR1 |
| Gene information | Species | Human | Gene symbol | SFR1 | Gene ID | 119392 |
| Gene name | SWI5 dependent homologous recombination repair protein 1 | |
| Gene Alias | C10orf78 | |
| Cytomap | 10q25.1 | |
| Gene Type | protein-coding | GO ID | GO:0000724 | UniProtAcc | Q86XK3 |
Top |
Malignant transformation analysis |
| Identification of the aberrant gene expression in precancerous and cancerous lesions by comparing the gene expression of stem-like cells in diseased tissues with normal stem cells |
| Entrez ID | Symbol | Replicates | Species | Organ | Tissue | Adj P-value | Log2FC | Malignancy |
| 119392 | SFR1 | P74T-E | Human | Esophagus | ESCC | 7.09e-07 | 1.70e-01 | 0.1479 |
| 119392 | SFR1 | P75T-E | Human | Esophagus | ESCC | 7.57e-13 | 2.73e-01 | 0.1125 |
| 119392 | SFR1 | P76T-E | Human | Esophagus | ESCC | 9.02e-11 | 2.45e-01 | 0.1207 |
| 119392 | SFR1 | P79T-E | Human | Esophagus | ESCC | 1.97e-10 | 2.19e-01 | 0.1154 |
| 119392 | SFR1 | P80T-E | Human | Esophagus | ESCC | 6.96e-12 | 3.12e-01 | 0.155 |
| 119392 | SFR1 | P82T-E | Human | Esophagus | ESCC | 8.26e-10 | 3.84e-01 | 0.1072 |
| 119392 | SFR1 | P83T-E | Human | Esophagus | ESCC | 1.14e-30 | 6.47e-01 | 0.1738 |
| 119392 | SFR1 | P84T-E | Human | Esophagus | ESCC | 8.33e-03 | 2.25e-01 | 0.0933 |
| 119392 | SFR1 | P89T-E | Human | Esophagus | ESCC | 1.89e-19 | 8.38e-01 | 0.1752 |
| 119392 | SFR1 | P91T-E | Human | Esophagus | ESCC | 1.72e-16 | 1.10e+00 | 0.1828 |
| 119392 | SFR1 | P107T-E | Human | Esophagus | ESCC | 1.47e-28 | 4.92e-01 | 0.171 |
| 119392 | SFR1 | P127T-E | Human | Esophagus | ESCC | 8.31e-06 | 1.10e-01 | 0.0826 |
| 119392 | SFR1 | P128T-E | Human | Esophagus | ESCC | 2.22e-25 | 7.35e-01 | 0.1241 |
| 119392 | SFR1 | P130T-E | Human | Esophagus | ESCC | 8.77e-25 | 4.92e-01 | 0.1676 |
| 119392 | SFR1 | C04 | Human | Oral cavity | OSCC | 8.66e-18 | 8.25e-01 | 0.2633 |
| 119392 | SFR1 | C21 | Human | Oral cavity | OSCC | 1.08e-25 | 9.22e-01 | 0.2678 |
| 119392 | SFR1 | C30 | Human | Oral cavity | OSCC | 9.72e-45 | 1.74e+00 | 0.3055 |
| 119392 | SFR1 | C38 | Human | Oral cavity | OSCC | 1.45e-05 | 4.83e-01 | 0.172 |
| 119392 | SFR1 | C46 | Human | Oral cavity | OSCC | 3.10e-07 | 2.92e-01 | 0.1673 |
| 119392 | SFR1 | C51 | Human | Oral cavity | OSCC | 4.35e-05 | 1.88e-01 | 0.2674 |
| Page: 1 2 3 4 |
| Tissue | Expression Dynamics | Abbreviation |
| Esophagus | 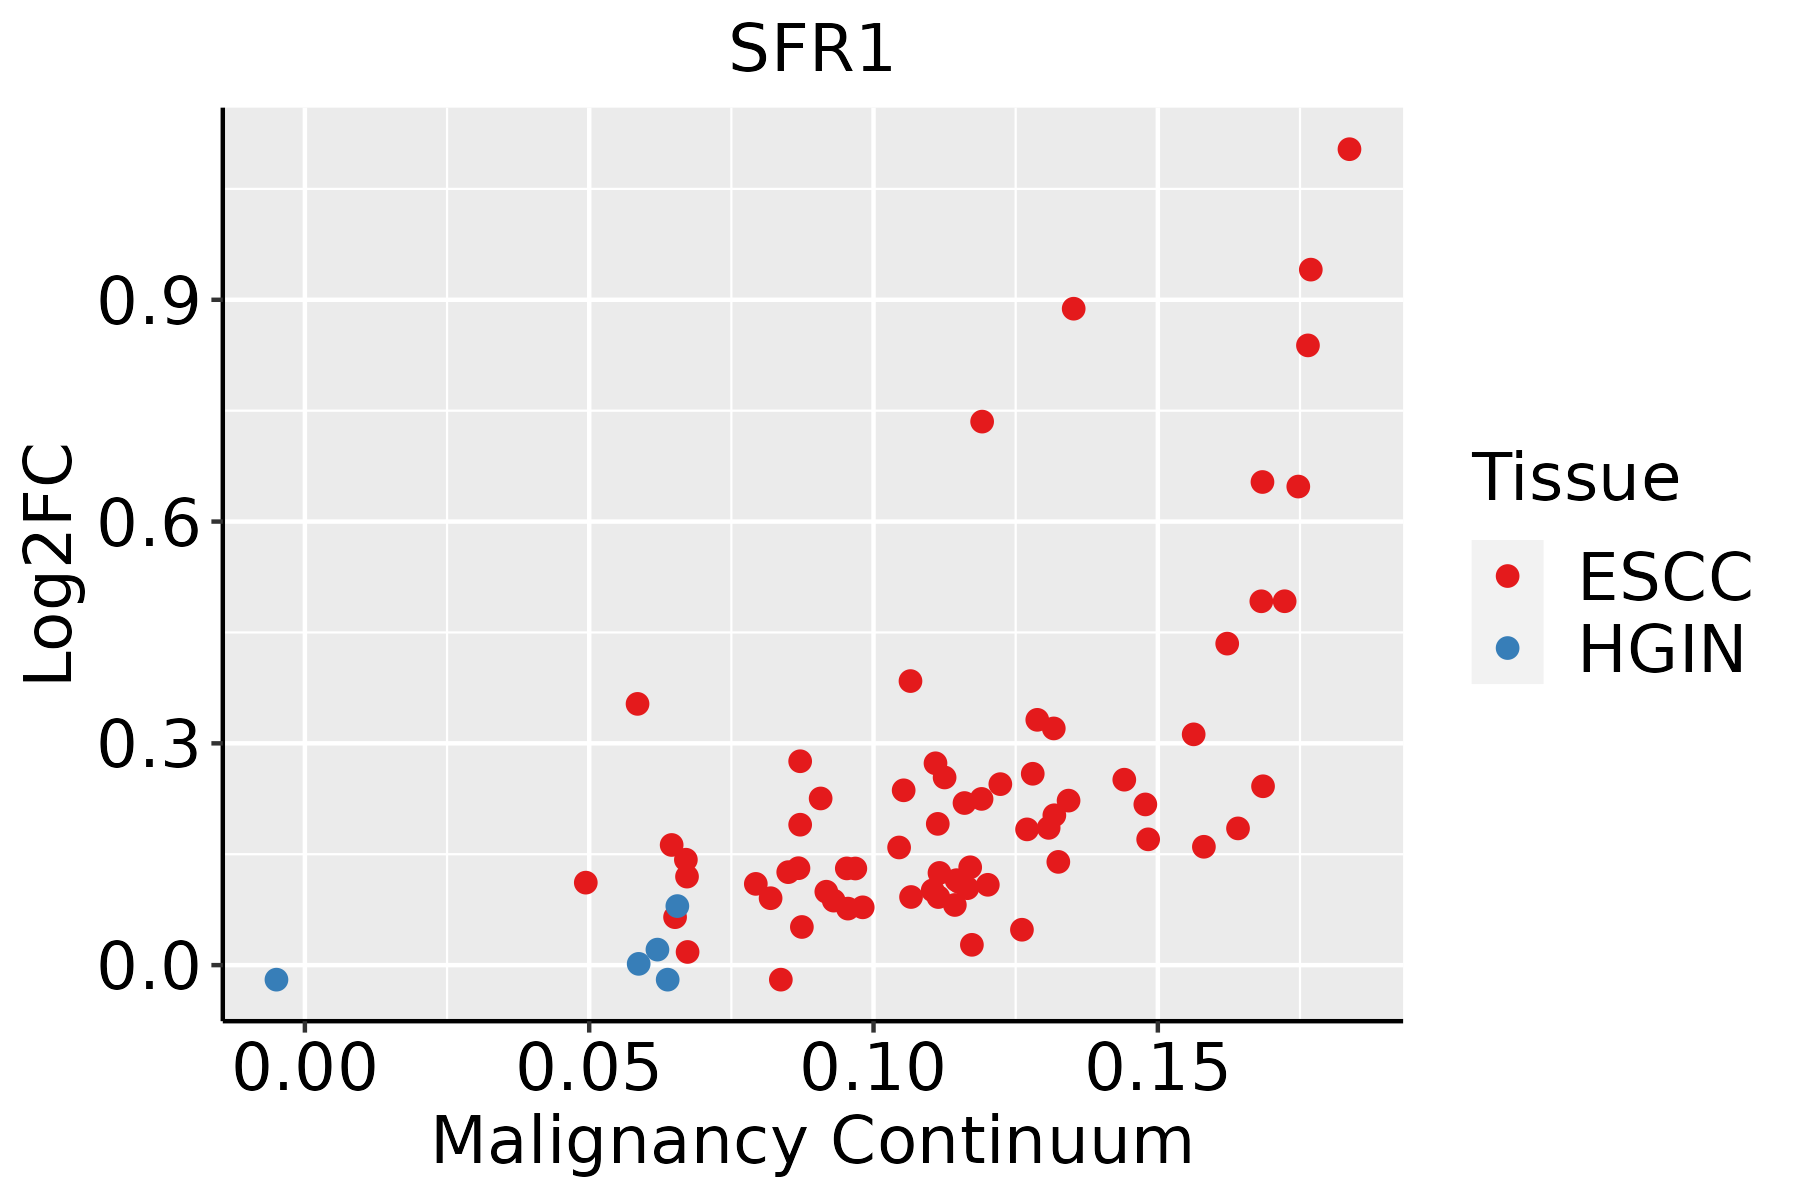 | ESCC: Esophageal squamous cell carcinoma |
| HGIN: High-grade intraepithelial neoplasias | ||
| LGIN: Low-grade intraepithelial neoplasias | ||
| Oral Cavity | 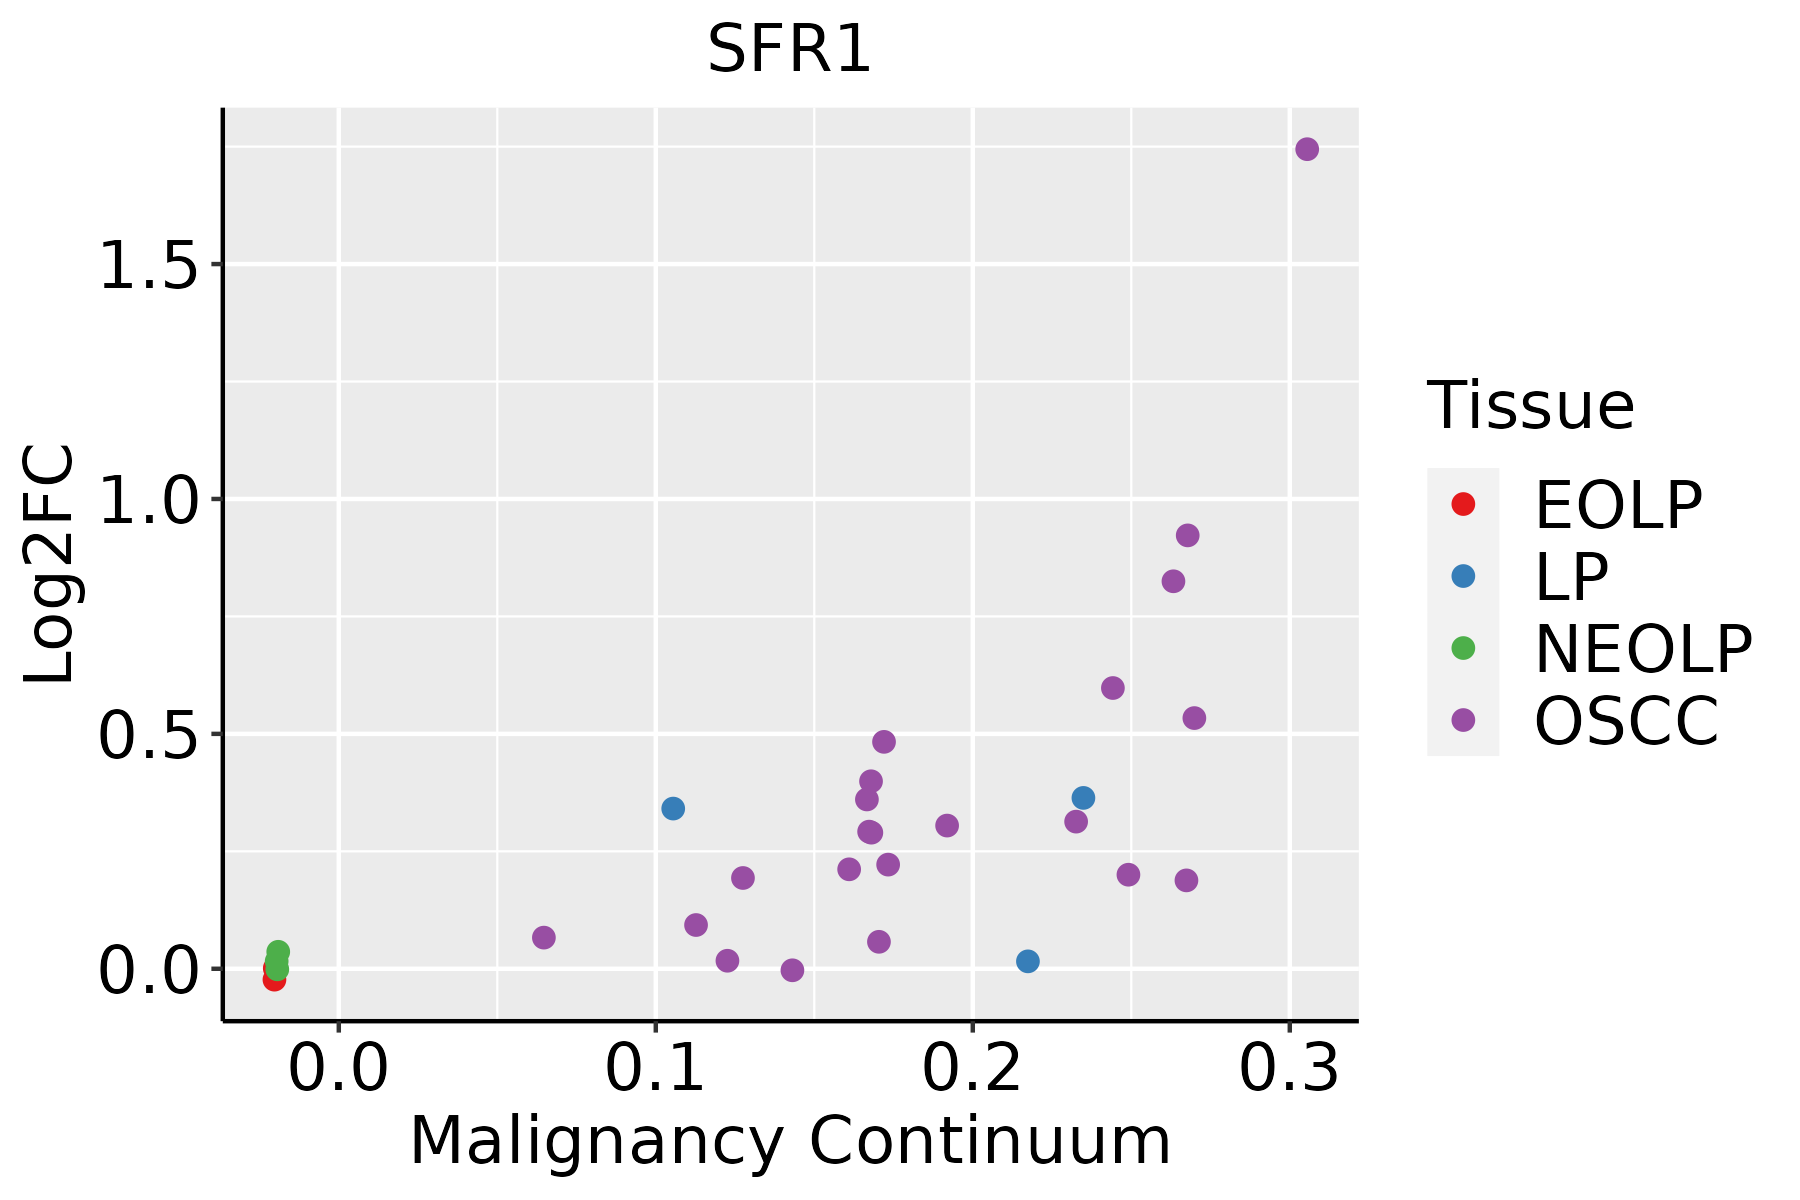 | EOLP: Erosive Oral lichen planus |
| LP: leukoplakia | ||
| NEOLP: Non-erosive oral lichen planus | ||
| OSCC: Oral squamous cell carcinoma |
| ∗log2FC in expression of this searched gene in stem-like cells from each diseased tissue sample relative to stem-like cells in normal samples in each tissue plotted against the malignancy continuum. Samples are colored based on if they are from different disease stage. |
Top |
Malignant transformation related pathway analysis |
| Find out the enriched GO biological processes and KEGG pathways involved in transition from healthy to precancer to cancer |
| Tissue | Disease Stage | Enriched GO biological Processes |
| Colorectum | AD |  |
| Colorectum | SER |  |
| Colorectum | MSS |  |
| Colorectum | MSI-H |  |
| Colorectum | FAP |  |
| ∗Top 15 enriched GO BP terms are showed in the bar plot of each disease state in each tissue. Each row represents a significant GO biological process which is colored according to the -log10(p.adjust). |
| Page: 1 2 3 4 5 6 7 8 9 |
| GO ID | Tissue | Disease Stage | Description | Gene Ratio | Bg Ratio | pvalue | p.adjust | Count |
| GO:00063024 | Esophagus | ESCC | double-strand break repair | 152/8552 | 251/18723 | 1.33e-06 | 1.62e-05 | 152 |
| GO:00063101 | Esophagus | ESCC | DNA recombination | 168/8552 | 305/18723 | 5.58e-04 | 3.05e-03 | 168 |
| GO:00007241 | Esophagus | ESCC | double-strand break repair via homologous recombination | 79/8552 | 138/18723 | 4.05e-03 | 1.62e-02 | 79 |
| GO:00007251 | Esophagus | ESCC | recombinational repair | 80/8552 | 140/18723 | 4.10e-03 | 1.63e-02 | 80 |
| GO:00436275 | Esophagus | ESCC | response to estrogen | 45/8552 | 75/18723 | 8.75e-03 | 3.08e-02 | 45 |
| GO:00063023 | Oral cavity | OSCC | double-strand break repair | 132/7305 | 251/18723 | 7.93e-06 | 8.52e-05 | 132 |
| GO:0006310 | Oral cavity | OSCC | DNA recombination | 147/7305 | 305/18723 | 6.33e-04 | 3.56e-03 | 147 |
| GO:0000725 | Oral cavity | OSCC | recombinational repair | 70/7305 | 140/18723 | 5.22e-03 | 2.03e-02 | 70 |
| GO:0000724 | Oral cavity | OSCC | double-strand break repair via homologous recombination | 69/7305 | 138/18723 | 5.52e-03 | 2.14e-02 | 69 |
| Page: 1 |
| Pathway ID | Tissue | Disease Stage | Description | Gene Ratio | Bg Ratio | pvalue | p.adjust | qvalue | Count |
| Page: 1 |
Top |
Cell-cell communication analysis |
| Identification of potential cell-cell interactions between two cell types and their ligand-receptor pairs for different disease states |
| Ligand | Receptor | LRpair | Pathway | Tissue | Disease Stage |
| Page: 1 |
Top |
Single-cell gene regulatory network inference analysis |
| Find out the significant the regulons (TFs) and the target genes of each regulon across cell types for different disease states |
| TF | Cell Type | Tissue | Disease Stage | Target Gene | RSS | Regulon Activity |
| ∗The dot plots of a searched regulon are shown for all cell subpopulations in each disease state of each tissue based on the regulon specific score inferred using pySCENIC and by calculating the average expression. |
| Page: 1 |
Top |
Somatic mutation of malignant transformation related genes |
| Annotation of somatic variants for genes involved in malignant transformation |
| Hugo Symbol | Variant Class | Variant Classification | dbSNP RS | HGVSc | HGVSp | HGVSp Short | SWISSPROT | BIOTYPE | SIFT | PolyPhen | Tumor Sample Barcode | Tissue | Histology | Sex | Age | Stage | Therapy Types | Drugs | Outcome |
| SFR1 | SNV | Missense_Mutation | c.579G>C | p.Lys193Asn | p.K193N | Q86XK3 | protein_coding | tolerated(0.31) | possibly_damaging(0.679) | TCGA-AC-A23H-01 | Breast | breast invasive carcinoma | Female | >=65 | I/II | Unknown | Unknown | PD | |
| SFR1 | SNV | Missense_Mutation | novel | c.715G>A | p.Glu239Lys | p.E239K | Q86XK3 | protein_coding | deleterious(0) | benign(0.43) | TCGA-BH-A0B6-01 | Breast | breast invasive carcinoma | Female | <65 | I/II | Unknown | Unknown | SD |
| SFR1 | insertion | In_Frame_Ins | novel | c.340_341insCTAAGT | p.Asn114delinsThrLysTyr | p.N114delinsTKY | Q86XK3 | protein_coding | TCGA-AN-A04C-01 | Breast | breast invasive carcinoma | Female | <65 | I/II | Unknown | Unknown | SD | ||
| SFR1 | insertion | Frame_Shift_Ins | novel | c.342_343insTGTGGCAGTGGTGGTTTAAATTCTACGGAAGG | p.Leu115CysfsTer12 | p.L115Cfs*12 | Q86XK3 | protein_coding | TCGA-AN-A04C-01 | Breast | breast invasive carcinoma | Female | <65 | I/II | Unknown | Unknown | SD | ||
| SFR1 | SNV | Missense_Mutation | c.613N>A | p.Glu205Lys | p.E205K | Q86XK3 | protein_coding | deleterious(0.03) | probably_damaging(0.999) | TCGA-IR-A3LK-01 | Cervix | cervical & endocervical cancer | Female | >=65 | I/II | Chemotherapy | cisplatin | PD | |
| SFR1 | SNV | Missense_Mutation | novel | c.263N>A | p.Ala88Glu | p.A88E | Q86XK3 | protein_coding | tolerated(0.35) | benign(0.005) | TCGA-AM-5820-01 | Colorectum | colon adenocarcinoma | Female | <65 | I/II | Unknown | Unknown | SD |
| SFR1 | SNV | Missense_Mutation | rs775374637 | c.647N>C | p.Lys216Thr | p.K216T | Q86XK3 | protein_coding | deleterious(0) | probably_damaging(0.999) | TCGA-CA-6718-01 | Colorectum | colon adenocarcinoma | Male | <65 | I/II | Unknown | Unknown | PD |
| SFR1 | SNV | Missense_Mutation | novel | c.16N>G | p.Lys6Glu | p.K6E | Q86XK3 | protein_coding | tolerated_low_confidence(1) | benign(0) | TCGA-AG-3726-01 | Colorectum | rectum adenocarcinoma | Female | <65 | I/II | Unknown | Unknown | SD |
| SFR1 | SNV | Missense_Mutation | novel | c.235A>C | p.Asn79His | p.N79H | Q86XK3 | protein_coding | deleterious(0.02) | possibly_damaging(0.823) | TCGA-F5-6814-01 | Colorectum | rectum adenocarcinoma | Male | <65 | I/II | Unknown | Unknown | SD |
| SFR1 | insertion | In_Frame_Ins | novel | c.264_265insATAAAG | p.Ala88_Ser89insIleLys | p.A88_S89insIK | Q86XK3 | protein_coding | TCGA-AM-5820-01 | Colorectum | colon adenocarcinoma | Female | <65 | I/II | Unknown | Unknown | SD |
| Page: 1 2 3 |
Top |
Related drugs of malignant transformation related genes |
| Identification of chemicals and drugs interact with genes involved in malignant transfromation |
| (DGIdb 4.0) |
| Entrez ID | Symbol | Category | Interaction Types | Drug Claim Name | Drug Name | PMIDs |
| Page: 1 |

Copyright 2023-Present -The University of Texas Health Science Center at Houston |