
|
|||||
|
 | |
| |
| |
| |
| |
| |
|
Gene: RRNAD1 |
Gene summary for RRNAD1 |
| Gene information | Species | Human | Gene symbol | RRNAD1 | Gene ID | 51093 |
| Gene name | methyltransferase like 25B | |
| Gene Alias | C1orf66 | |
| Cytomap | 1q23.1 | |
| Gene Type | protein-coding | GO ID | GO:0000154 | UniProtAcc | Q96FB5 |
Top |
Malignant transformation analysis |
| Identification of the aberrant gene expression in precancerous and cancerous lesions by comparing the gene expression of stem-like cells in diseased tissues with normal stem cells |
| Entrez ID | Symbol | Replicates | Species | Organ | Tissue | Adj P-value | Log2FC | Malignancy |
| 51093 | RRNAD1 | P54T-E | Human | Esophagus | ESCC | 4.80e-06 | 1.34e-01 | 0.0975 |
| 51093 | RRNAD1 | P56T-E | Human | Esophagus | ESCC | 1.23e-02 | 5.03e-01 | 0.1613 |
| 51093 | RRNAD1 | P57T-E | Human | Esophagus | ESCC | 1.16e-14 | 2.61e-01 | 0.0926 |
| 51093 | RRNAD1 | P61T-E | Human | Esophagus | ESCC | 3.40e-16 | 3.51e-01 | 0.099 |
| 51093 | RRNAD1 | P62T-E | Human | Esophagus | ESCC | 7.32e-26 | 4.67e-01 | 0.1302 |
| 51093 | RRNAD1 | P65T-E | Human | Esophagus | ESCC | 1.22e-17 | 2.14e-01 | 0.0978 |
| 51093 | RRNAD1 | P74T-E | Human | Esophagus | ESCC | 3.78e-21 | 4.12e-01 | 0.1479 |
| 51093 | RRNAD1 | P75T-E | Human | Esophagus | ESCC | 1.12e-17 | 3.33e-01 | 0.1125 |
| 51093 | RRNAD1 | P76T-E | Human | Esophagus | ESCC | 1.94e-05 | 2.06e-01 | 0.1207 |
| 51093 | RRNAD1 | P79T-E | Human | Esophagus | ESCC | 1.34e-11 | 1.11e-01 | 0.1154 |
| 51093 | RRNAD1 | P80T-E | Human | Esophagus | ESCC | 1.35e-20 | 4.45e-01 | 0.155 |
| 51093 | RRNAD1 | P82T-E | Human | Esophagus | ESCC | 4.06e-05 | 1.99e-01 | 0.1072 |
| 51093 | RRNAD1 | P83T-E | Human | Esophagus | ESCC | 1.24e-18 | 4.42e-01 | 0.1738 |
| 51093 | RRNAD1 | P89T-E | Human | Esophagus | ESCC | 1.64e-07 | 3.96e-01 | 0.1752 |
| 51093 | RRNAD1 | P91T-E | Human | Esophagus | ESCC | 1.04e-04 | 4.51e-01 | 0.1828 |
| 51093 | RRNAD1 | P107T-E | Human | Esophagus | ESCC | 3.82e-14 | 2.64e-01 | 0.171 |
| 51093 | RRNAD1 | P127T-E | Human | Esophagus | ESCC | 1.89e-25 | 1.39e-01 | 0.0826 |
| 51093 | RRNAD1 | P128T-E | Human | Esophagus | ESCC | 4.73e-13 | 4.95e-01 | 0.1241 |
| 51093 | RRNAD1 | P130T-E | Human | Esophagus | ESCC | 6.36e-26 | 5.68e-01 | 0.1676 |
| 51093 | RRNAD1 | S43 | Human | Liver | Cirrhotic | 3.66e-02 | -3.03e-02 | -0.0187 |
| Page: 1 2 3 4 |
| Tissue | Expression Dynamics | Abbreviation |
| Esophagus | 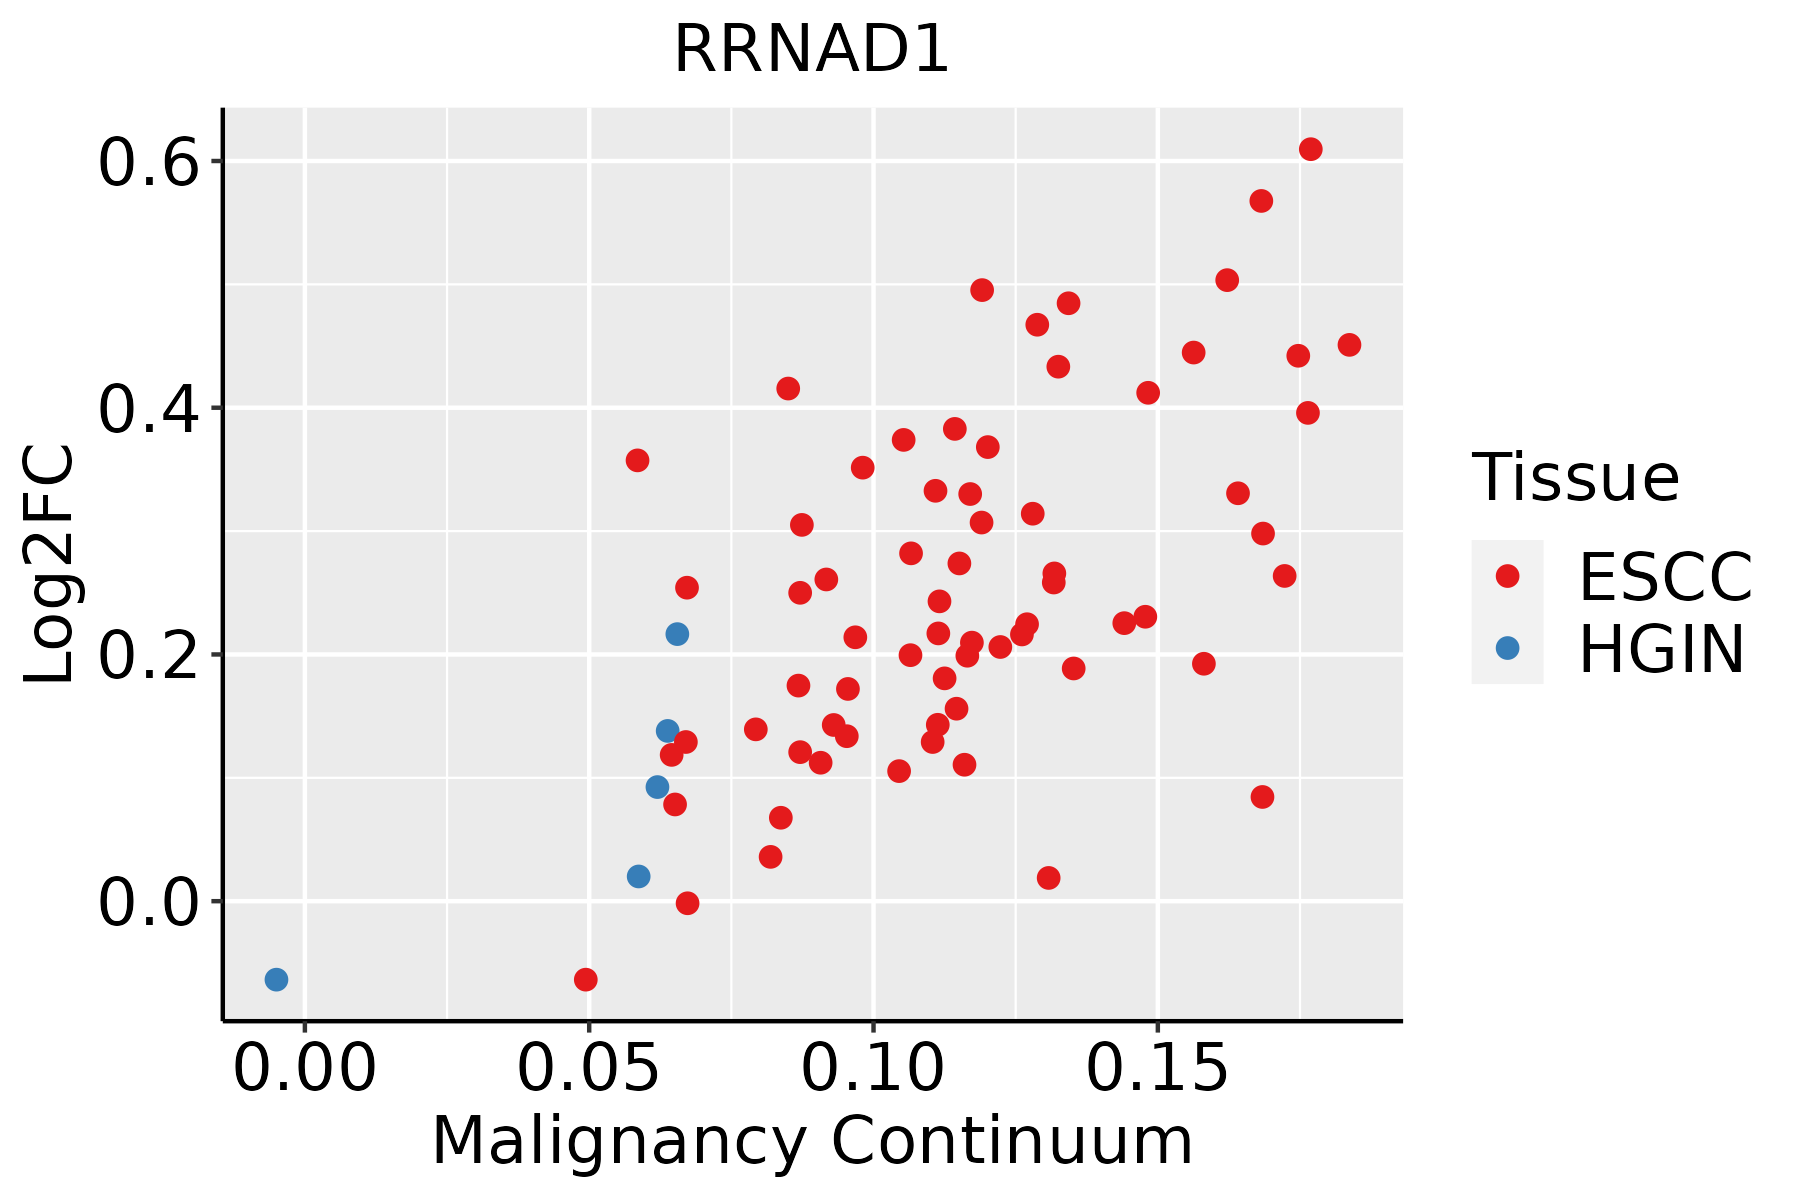 | ESCC: Esophageal squamous cell carcinoma |
| HGIN: High-grade intraepithelial neoplasias | ||
| LGIN: Low-grade intraepithelial neoplasias | ||
| Liver |  | HCC: Hepatocellular carcinoma |
| NAFLD: Non-alcoholic fatty liver disease |
| ∗log2FC in expression of this searched gene in stem-like cells from each diseased tissue sample relative to stem-like cells in normal samples in each tissue plotted against the malignancy continuum. Samples are colored based on if they are from different disease stage. |
Top |
Malignant transformation related pathway analysis |
| Find out the enriched GO biological processes and KEGG pathways involved in transition from healthy to precancer to cancer |
| Tissue | Disease Stage | Enriched GO biological Processes |
| Colorectum | AD |  |
| Colorectum | SER |  |
| Colorectum | MSS |  |
| Colorectum | MSI-H |  |
| Colorectum | FAP |  |
| ∗Top 15 enriched GO BP terms are showed in the bar plot of each disease state in each tissue. Each row represents a significant GO biological process which is colored according to the -log10(p.adjust). |
| Page: 1 2 3 4 5 6 7 8 9 |
| GO ID | Tissue | Disease Stage | Description | Gene Ratio | Bg Ratio | pvalue | p.adjust | Count |
| Page: 1 |
| Pathway ID | Tissue | Disease Stage | Description | Gene Ratio | Bg Ratio | pvalue | p.adjust | qvalue | Count |
| Page: 1 |
Top |
Cell-cell communication analysis |
| Identification of potential cell-cell interactions between two cell types and their ligand-receptor pairs for different disease states |
| Ligand | Receptor | LRpair | Pathway | Tissue | Disease Stage |
| Page: 1 |
Top |
Single-cell gene regulatory network inference analysis |
| Find out the significant the regulons (TFs) and the target genes of each regulon across cell types for different disease states |
| TF | Cell Type | Tissue | Disease Stage | Target Gene | RSS | Regulon Activity |
| ∗The dot plots of a searched regulon are shown for all cell subpopulations in each disease state of each tissue based on the regulon specific score inferred using pySCENIC and by calculating the average expression. |
| Page: 1 |
Top |
Somatic mutation of malignant transformation related genes |
| Annotation of somatic variants for genes involved in malignant transformation |
| Hugo Symbol | Variant Class | Variant Classification | dbSNP RS | HGVSc | HGVSp | HGVSp Short | SWISSPROT | BIOTYPE | SIFT | PolyPhen | Tumor Sample Barcode | Tissue | Histology | Sex | Age | Stage | Therapy Types | Drugs | Outcome |
| RRNAD1 | SNV | Missense_Mutation | c.1314T>G | p.His438Gln | p.H438Q | Q96FB5 | protein_coding | tolerated(0.77) | benign(0.003) | TCGA-AN-A0FX-01 | Breast | breast invasive carcinoma | Female | <65 | I/II | Unknown | Unknown | SD | |
| RRNAD1 | SNV | Missense_Mutation | c.530N>C | p.Leu177Ser | p.L177S | Q96FB5 | protein_coding | deleterious(0) | probably_damaging(0.999) | TCGA-AO-A128-01 | Breast | breast invasive carcinoma | Female | <65 | I/II | Chemotherapy | doxorubicin | SD | |
| RRNAD1 | SNV | Missense_Mutation | c.111N>G | p.Ile37Met | p.I37M | Q96FB5 | protein_coding | deleterious(0) | probably_damaging(0.975) | TCGA-BH-A18P-01 | Breast | breast invasive carcinoma | Female | <65 | I/II | Unknown | Unknown | PD | |
| RRNAD1 | SNV | Missense_Mutation | novel | c.1013N>G | p.Thr338Ser | p.T338S | Q96FB5 | protein_coding | tolerated(0.15) | benign(0.018) | TCGA-GM-A3XL-01 | Breast | breast invasive carcinoma | Female | <65 | I/II | Chemotherapy | fluorouracil | CR |
| RRNAD1 | insertion | Frame_Shift_Ins | novel | c.373_374insCCCTTTTTTTT | p.Phe126LeufsTer24 | p.F126Lfs*24 | Q96FB5 | protein_coding | TCGA-A8-A07U-01 | Breast | breast invasive carcinoma | Female | >=65 | III/IV | Chemotherapy | 5-fluorouracil | SD | ||
| RRNAD1 | insertion | Frame_Shift_Ins | novel | c.375_376insGCTGACATAAATAATATTTCTT | p.Phe126AlafsTer19 | p.F126Afs*19 | Q96FB5 | protein_coding | TCGA-A8-A07U-01 | Breast | breast invasive carcinoma | Female | >=65 | III/IV | Chemotherapy | 5-fluorouracil | SD | ||
| RRNAD1 | insertion | Nonsense_Mutation | novel | c.1324_1325insAAGTCCCAGCCCCAACATCTTCTGGGCCTAGCTAATCACTGTTG | p.Leu442GlnfsTer12 | p.L442Qfs*12 | Q96FB5 | protein_coding | TCGA-A8-A09E-01 | Breast | breast invasive carcinoma | Female | >=65 | III/IV | Hormone Therapy | anastrozole | SD | ||
| RRNAD1 | insertion | In_Frame_Ins | novel | c.1382_1383insACCACCACA | p.Met461delinsIleProProGln | p.M461delinsIPPQ | Q96FB5 | protein_coding | TCGA-AN-A03X-01 | Breast | breast invasive carcinoma | Female | >=65 | I/II | Unknown | Unknown | SD | ||
| RRNAD1 | SNV | Missense_Mutation | novel | c.1383N>T | p.Met461Ile | p.M461I | Q96FB5 | protein_coding | tolerated_low_confidence(0.2) | benign(0) | TCGA-JW-A5VL-01 | Cervix | cervical & endocervical cancer | Female | <65 | I/II | Unknown | Unknown | SD |
| RRNAD1 | SNV | Missense_Mutation | c.1015N>G | p.His339Asp | p.H339D | Q96FB5 | protein_coding | deleterious(0) | possibly_damaging(0.858) | TCGA-Q1-A5R2-01 | Cervix | cervical & endocervical cancer | Female | <65 | I/II | Chemotherapy | cisplatin | PR |
| Page: 1 2 3 4 5 6 |
Top |
Related drugs of malignant transformation related genes |
| Identification of chemicals and drugs interact with genes involved in malignant transfromation |
| (DGIdb 4.0) |
| Entrez ID | Symbol | Category | Interaction Types | Drug Claim Name | Drug Name | PMIDs |
| Page: 1 |

Copyright 2023-Present -The University of Texas Health Science Center at Houston |