
|
|||||
|
 | |
| |
| |
| |
| |
| |
|
Gene: RFC4 |
Gene summary for RFC4 |
| Gene information | Species | Human | Gene symbol | RFC4 | Gene ID | 5984 |
| Gene name | replication factor C subunit 4 | |
| Gene Alias | A1 | |
| Cytomap | 3q27.3 | |
| Gene Type | protein-coding | GO ID | GO:0006139 | UniProtAcc | P35249 |
Top |
Malignant transformation analysis |
| Identification of the aberrant gene expression in precancerous and cancerous lesions by comparing the gene expression of stem-like cells in diseased tissues with normal stem cells |
| Entrez ID | Symbol | Replicates | Species | Organ | Tissue | Adj P-value | Log2FC | Malignancy |
| 5984 | RFC4 | P52T-E | Human | Esophagus | ESCC | 9.17e-48 | 1.06e+00 | 0.1555 |
| 5984 | RFC4 | P54T-E | Human | Esophagus | ESCC | 2.08e-19 | 4.98e-01 | 0.0975 |
| 5984 | RFC4 | P56T-E | Human | Esophagus | ESCC | 8.27e-06 | 8.18e-01 | 0.1613 |
| 5984 | RFC4 | P57T-E | Human | Esophagus | ESCC | 8.09e-03 | 1.26e-01 | 0.0926 |
| 5984 | RFC4 | P61T-E | Human | Esophagus | ESCC | 7.09e-09 | 4.08e-01 | 0.099 |
| 5984 | RFC4 | P62T-E | Human | Esophagus | ESCC | 1.83e-17 | 4.91e-01 | 0.1302 |
| 5984 | RFC4 | P65T-E | Human | Esophagus | ESCC | 7.27e-12 | 3.10e-01 | 0.0978 |
| 5984 | RFC4 | P74T-E | Human | Esophagus | ESCC | 8.45e-27 | 9.31e-01 | 0.1479 |
| 5984 | RFC4 | P75T-E | Human | Esophagus | ESCC | 6.16e-20 | 5.63e-01 | 0.1125 |
| 5984 | RFC4 | P76T-E | Human | Esophagus | ESCC | 2.10e-36 | 9.29e-01 | 0.1207 |
| 5984 | RFC4 | P79T-E | Human | Esophagus | ESCC | 7.61e-34 | 8.41e-01 | 0.1154 |
| 5984 | RFC4 | P80T-E | Human | Esophagus | ESCC | 1.48e-31 | 1.00e+00 | 0.155 |
| 5984 | RFC4 | P83T-E | Human | Esophagus | ESCC | 1.22e-42 | 1.92e+00 | 0.1738 |
| 5984 | RFC4 | P84T-E | Human | Esophagus | ESCC | 1.54e-04 | 4.23e-01 | 0.0933 |
| 5984 | RFC4 | P89T-E | Human | Esophagus | ESCC | 9.61e-12 | 7.61e-01 | 0.1752 |
| 5984 | RFC4 | P91T-E | Human | Esophagus | ESCC | 2.09e-17 | 1.74e+00 | 0.1828 |
| 5984 | RFC4 | P107T-E | Human | Esophagus | ESCC | 5.19e-33 | 1.04e+00 | 0.171 |
| 5984 | RFC4 | P126T-E | Human | Esophagus | ESCC | 2.30e-04 | 4.68e-01 | 0.1125 |
| 5984 | RFC4 | P127T-E | Human | Esophagus | ESCC | 3.62e-14 | 2.16e-01 | 0.0826 |
| 5984 | RFC4 | P128T-E | Human | Esophagus | ESCC | 2.89e-23 | 6.65e-01 | 0.1241 |
| Page: 1 2 3 4 5 |
| Tissue | Expression Dynamics | Abbreviation |
| Esophagus | 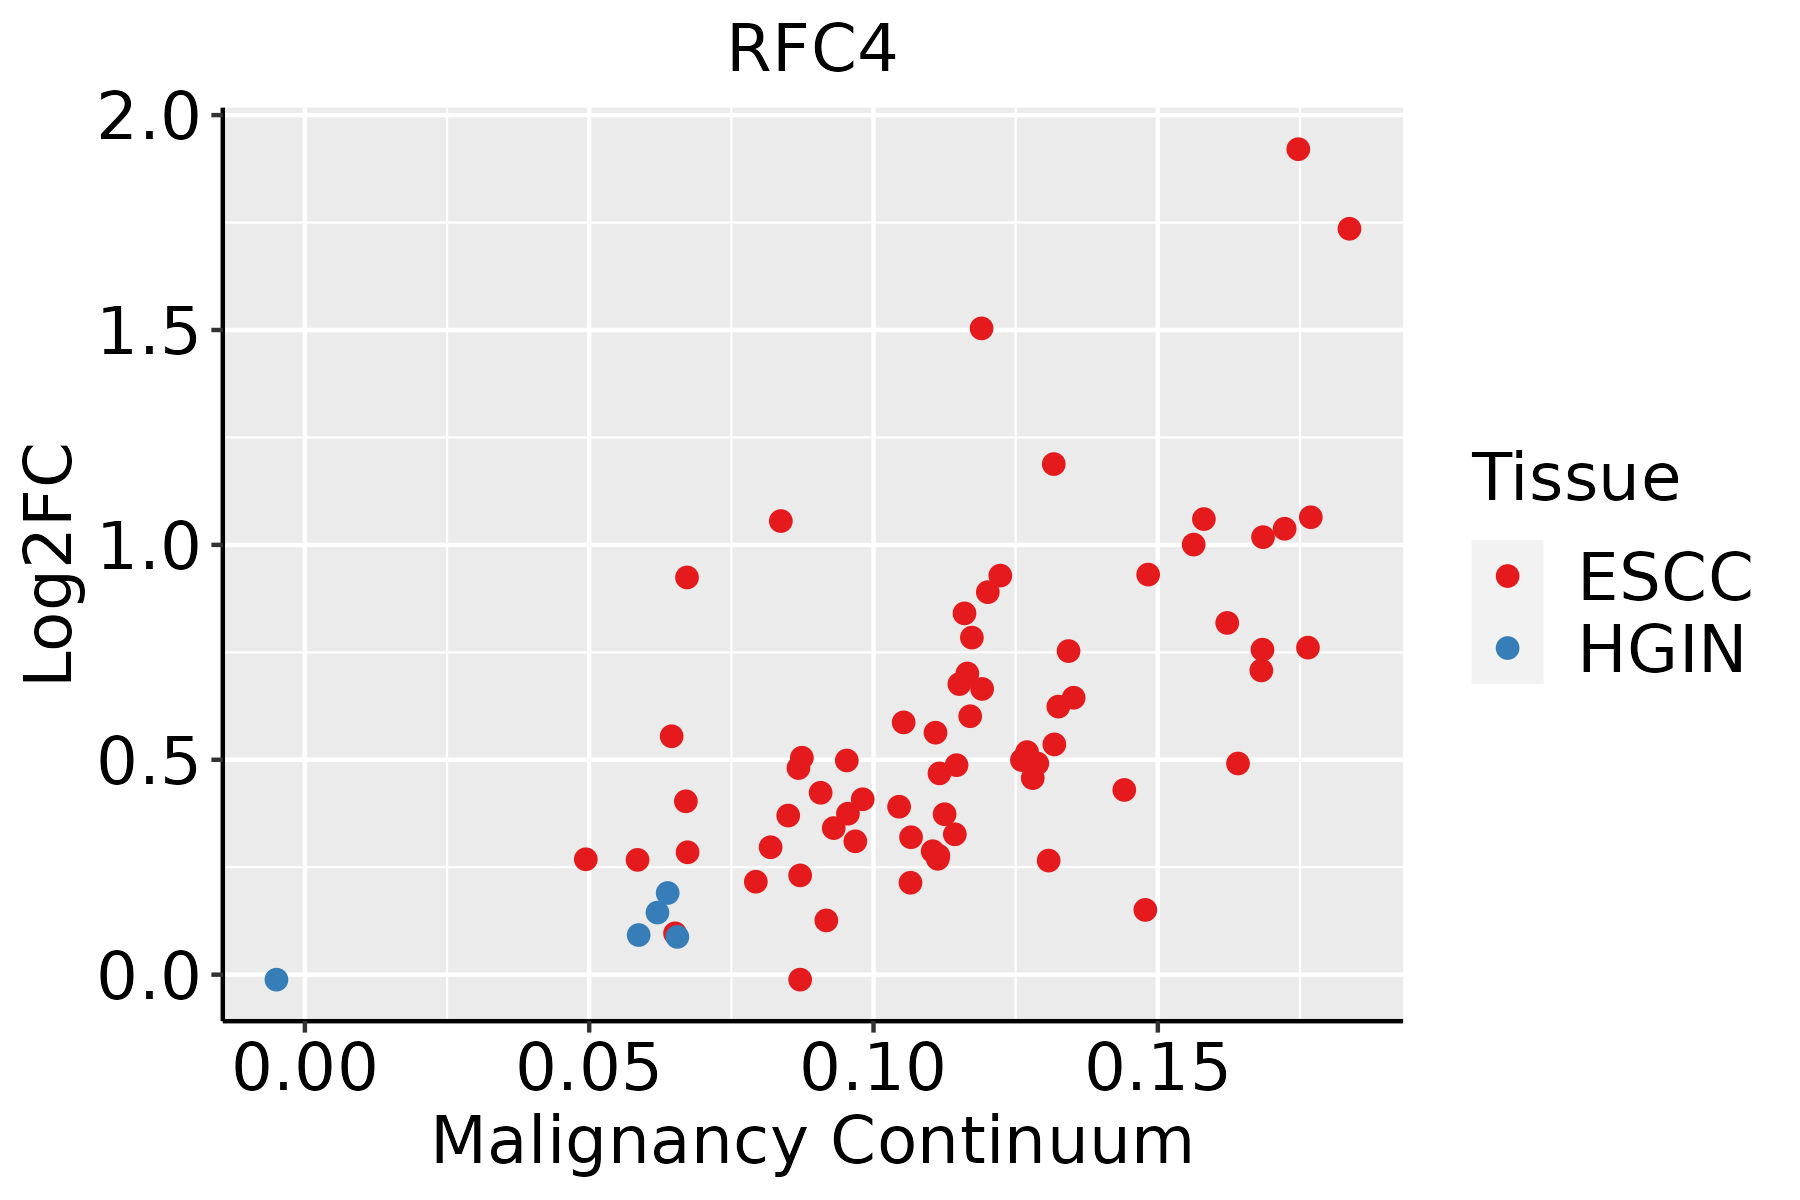 | ESCC: Esophageal squamous cell carcinoma |
| HGIN: High-grade intraepithelial neoplasias | ||
| LGIN: Low-grade intraepithelial neoplasias | ||
| Liver | 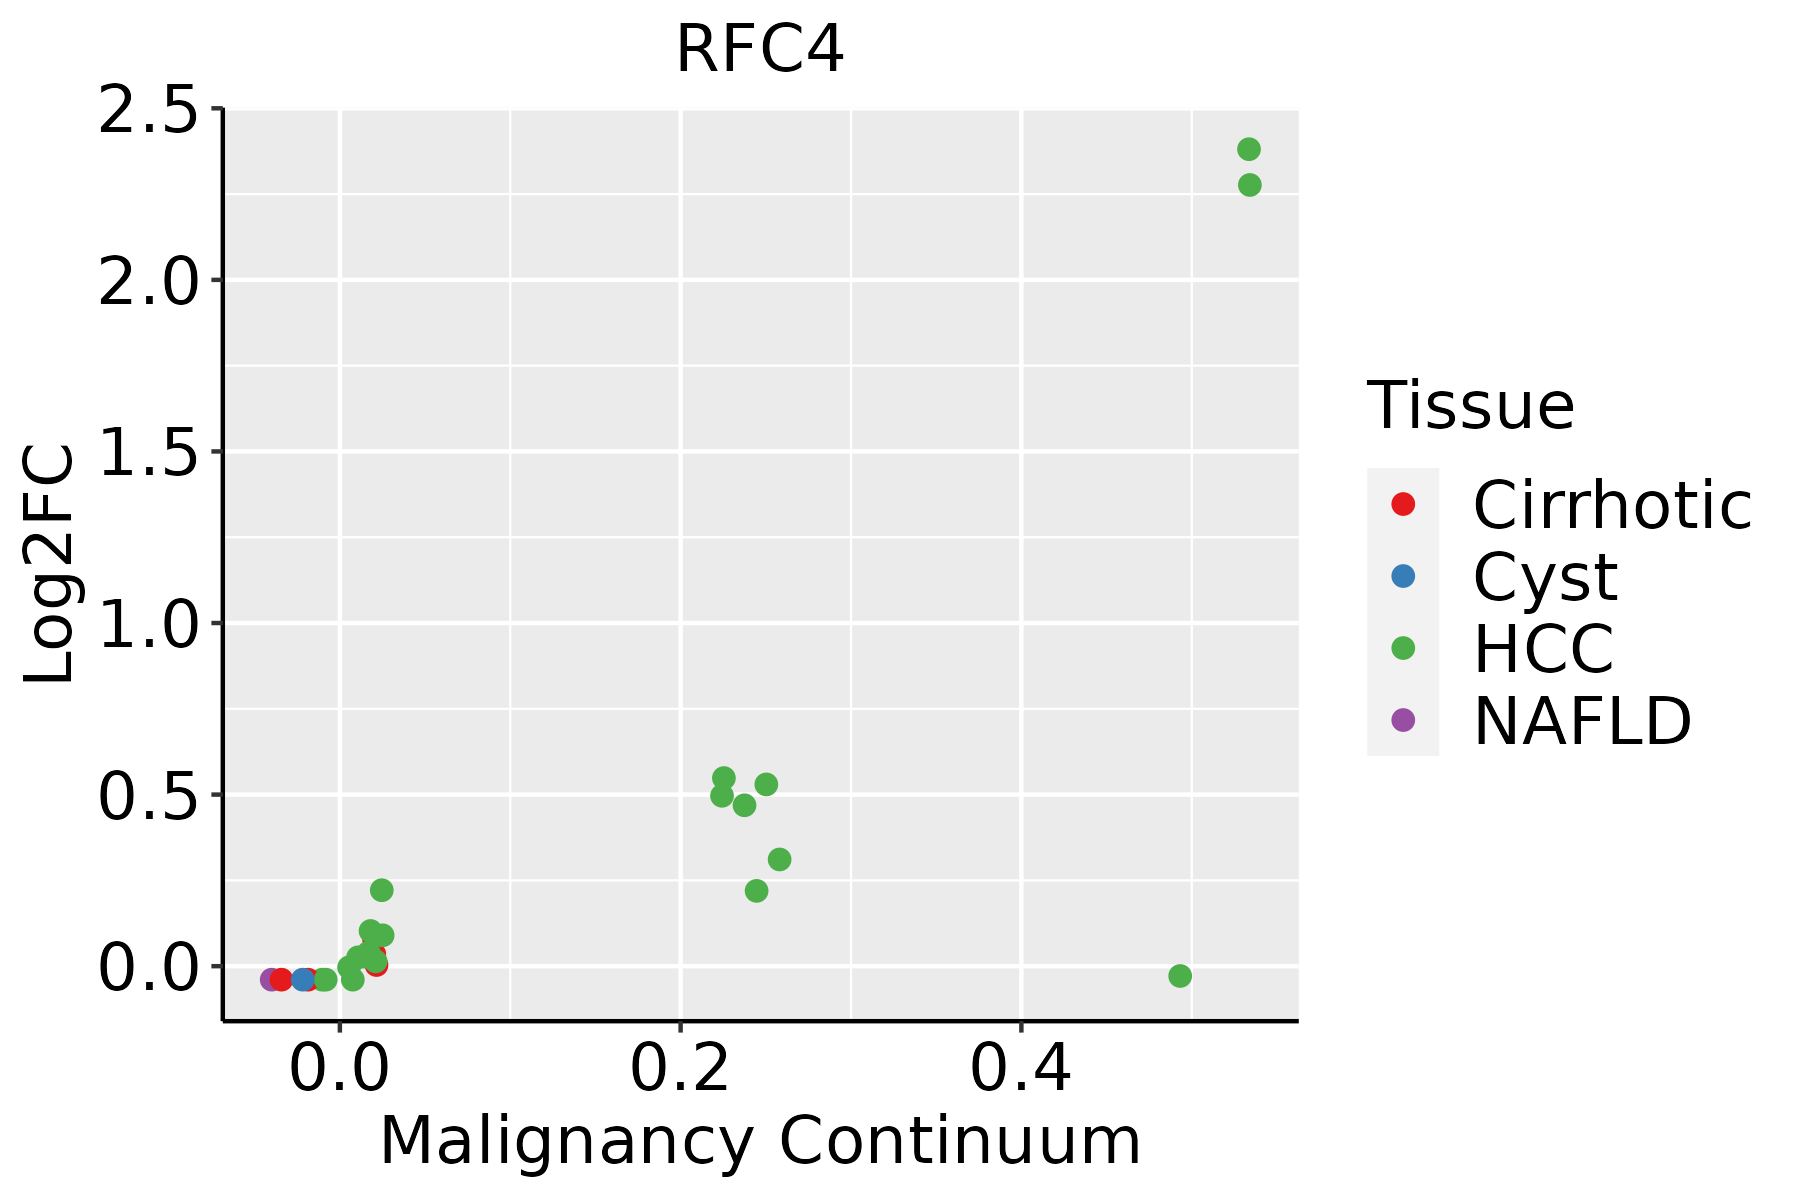 | HCC: Hepatocellular carcinoma |
| NAFLD: Non-alcoholic fatty liver disease | ||
| Oral Cavity | 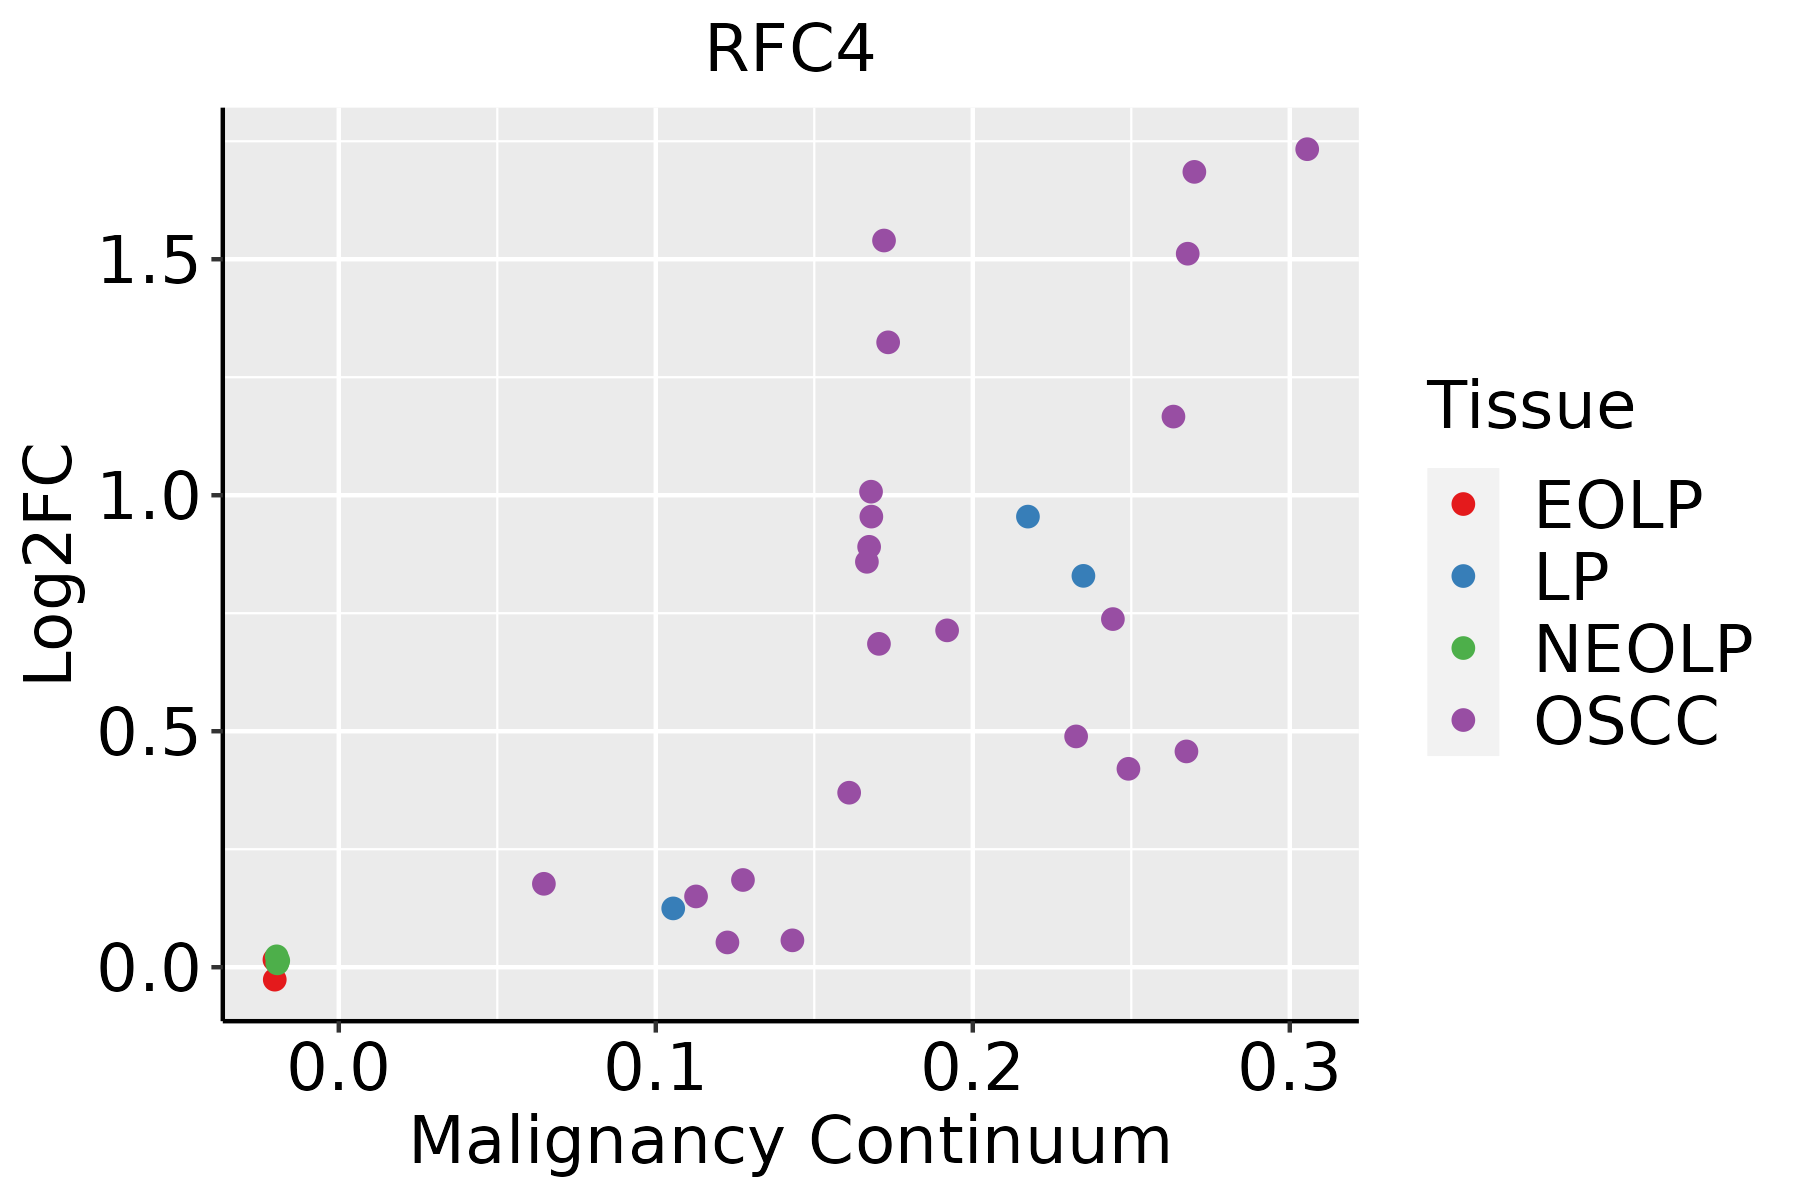 | EOLP: Erosive Oral lichen planus |
| LP: leukoplakia | ||
| NEOLP: Non-erosive oral lichen planus | ||
| OSCC: Oral squamous cell carcinoma | ||
| Skin |  | AK: Actinic keratosis |
| cSCC: Cutaneous squamous cell carcinoma | ||
| SCCIS:squamous cell carcinoma in situ |
| ∗log2FC in expression of this searched gene in stem-like cells from each diseased tissue sample relative to stem-like cells in normal samples in each tissue plotted against the malignancy continuum. Samples are colored based on if they are from different disease stage. |
Top |
Malignant transformation related pathway analysis |
| Find out the enriched GO biological processes and KEGG pathways involved in transition from healthy to precancer to cancer |
| Tissue | Disease Stage | Enriched GO biological Processes |
| Colorectum | AD |  |
| Colorectum | SER |  |
| Colorectum | MSS |  |
| Colorectum | MSI-H |  |
| Colorectum | FAP |  |
| ∗Top 15 enriched GO BP terms are showed in the bar plot of each disease state in each tissue. Each row represents a significant GO biological process which is colored according to the -log10(p.adjust). |
| Page: 1 2 3 4 5 6 7 8 9 |
| GO ID | Tissue | Disease Stage | Description | Gene Ratio | Bg Ratio | pvalue | p.adjust | Count |
| GO:00062604 | Esophagus | ESCC | DNA replication | 181/8552 | 260/18723 | 3.55e-15 | 2.05e-13 | 181 |
| GO:005105215 | Esophagus | ESCC | regulation of DNA metabolic process | 232/8552 | 359/18723 | 2.40e-13 | 1.13e-11 | 232 |
| GO:007189716 | Esophagus | ESCC | DNA biosynthetic process | 127/8552 | 180/18723 | 1.04e-11 | 3.85e-10 | 127 |
| GO:005105417 | Esophagus | ESCC | positive regulation of DNA metabolic process | 139/8552 | 201/18723 | 1.20e-11 | 4.33e-10 | 139 |
| GO:200057319 | Esophagus | ESCC | positive regulation of DNA biosynthetic process | 56/8552 | 66/18723 | 4.51e-11 | 1.45e-09 | 56 |
| GO:2000278110 | Esophagus | ESCC | regulation of DNA biosynthetic process | 81/8552 | 106/18723 | 9.81e-11 | 2.96e-09 | 81 |
| GO:00062612 | Esophagus | ESCC | DNA-dependent DNA replication | 100/8552 | 151/18723 | 2.61e-07 | 3.94e-06 | 100 |
| GO:00062754 | Esophagus | ESCC | regulation of DNA replication | 73/8552 | 107/18723 | 1.97e-06 | 2.28e-05 | 73 |
| GO:003239214 | Esophagus | ESCC | DNA geometric change | 62/8552 | 90/18723 | 7.02e-06 | 7.04e-05 | 62 |
| GO:003250813 | Esophagus | ESCC | DNA duplex unwinding | 58/8552 | 84/18723 | 1.23e-05 | 1.14e-04 | 58 |
| GO:0090329 | Esophagus | ESCC | regulation of DNA-dependent DNA replication | 30/8552 | 46/18723 | 5.91e-03 | 2.18e-02 | 30 |
| GO:005105221 | Liver | HCC | regulation of DNA metabolic process | 198/7958 | 359/18723 | 7.62e-07 | 1.17e-05 | 198 |
| GO:00062601 | Liver | HCC | DNA replication | 146/7958 | 260/18723 | 5.68e-06 | 7.02e-05 | 146 |
| GO:005105411 | Liver | HCC | positive regulation of DNA metabolic process | 113/7958 | 201/18723 | 5.76e-05 | 5.33e-04 | 113 |
| GO:200027812 | Liver | HCC | regulation of DNA biosynthetic process | 64/7958 | 106/18723 | 1.53e-04 | 1.23e-03 | 64 |
| GO:00718975 | Liver | HCC | DNA biosynthetic process | 99/7958 | 180/18723 | 4.66e-04 | 3.08e-03 | 99 |
| GO:003239211 | Liver | HCC | DNA geometric change | 54/7958 | 90/18723 | 6.04e-04 | 3.79e-03 | 54 |
| GO:200057312 | Liver | HCC | positive regulation of DNA biosynthetic process | 41/7958 | 66/18723 | 1.02e-03 | 5.86e-03 | 41 |
| GO:00325081 | Liver | HCC | DNA duplex unwinding | 49/7958 | 84/18723 | 2.46e-03 | 1.19e-02 | 49 |
| GO:00062751 | Liver | HCC | regulation of DNA replication | 60/7958 | 107/18723 | 3.15e-03 | 1.46e-02 | 60 |
| Page: 1 2 3 |
| Pathway ID | Tissue | Disease Stage | Description | Gene Ratio | Bg Ratio | pvalue | p.adjust | qvalue | Count |
| hsa0342022 | Esophagus | ESCC | Nucleotide excision repair | 54/4205 | 63/8465 | 2.01e-09 | 2.17e-08 | 1.11e-08 | 54 |
| hsa034104 | Esophagus | ESCC | Base excision repair | 38/4205 | 44/8465 | 3.59e-07 | 2.62e-06 | 1.34e-06 | 38 |
| hsa030304 | Esophagus | ESCC | DNA replication | 32/4205 | 36/8465 | 7.71e-07 | 5.06e-06 | 2.59e-06 | 32 |
| hsa034304 | Esophagus | ESCC | Mismatch repair | 21/4205 | 23/8465 | 2.85e-05 | 1.35e-04 | 6.90e-05 | 21 |
| hsa0342032 | Esophagus | ESCC | Nucleotide excision repair | 54/4205 | 63/8465 | 2.01e-09 | 2.17e-08 | 1.11e-08 | 54 |
| hsa0341011 | Esophagus | ESCC | Base excision repair | 38/4205 | 44/8465 | 3.59e-07 | 2.62e-06 | 1.34e-06 | 38 |
| hsa0303011 | Esophagus | ESCC | DNA replication | 32/4205 | 36/8465 | 7.71e-07 | 5.06e-06 | 2.59e-06 | 32 |
| hsa0343011 | Esophagus | ESCC | Mismatch repair | 21/4205 | 23/8465 | 2.85e-05 | 1.35e-04 | 6.90e-05 | 21 |
| hsa034202 | Liver | HCC | Nucleotide excision repair | 41/4020 | 63/8465 | 3.59e-03 | 1.12e-02 | 6.22e-03 | 41 |
| hsa034203 | Liver | HCC | Nucleotide excision repair | 41/4020 | 63/8465 | 3.59e-03 | 1.12e-02 | 6.22e-03 | 41 |
| hsa034204 | Oral cavity | OSCC | Nucleotide excision repair | 49/3704 | 63/8465 | 3.48e-08 | 2.91e-07 | 1.48e-07 | 49 |
| hsa03030 | Oral cavity | OSCC | DNA replication | 31/3704 | 36/8465 | 1.70e-07 | 1.19e-06 | 6.03e-07 | 31 |
| hsa03410 | Oral cavity | OSCC | Base excision repair | 32/3704 | 44/8465 | 9.11e-05 | 3.25e-04 | 1.65e-04 | 32 |
| hsa03430 | Oral cavity | OSCC | Mismatch repair | 19/3704 | 23/8465 | 1.55e-04 | 5.34e-04 | 2.72e-04 | 19 |
| hsa0342011 | Oral cavity | OSCC | Nucleotide excision repair | 49/3704 | 63/8465 | 3.48e-08 | 2.91e-07 | 1.48e-07 | 49 |
| hsa030301 | Oral cavity | OSCC | DNA replication | 31/3704 | 36/8465 | 1.70e-07 | 1.19e-06 | 6.03e-07 | 31 |
| hsa034101 | Oral cavity | OSCC | Base excision repair | 32/3704 | 44/8465 | 9.11e-05 | 3.25e-04 | 1.65e-04 | 32 |
| hsa034301 | Oral cavity | OSCC | Mismatch repair | 19/3704 | 23/8465 | 1.55e-04 | 5.34e-04 | 2.72e-04 | 19 |
| hsa0342021 | Oral cavity | LP | Nucleotide excision repair | 37/2418 | 63/8465 | 5.14e-07 | 6.33e-06 | 4.08e-06 | 37 |
| hsa030302 | Oral cavity | LP | DNA replication | 23/2418 | 36/8465 | 1.08e-05 | 7.79e-05 | 5.02e-05 | 23 |
| Page: 1 2 |
Top |
Cell-cell communication analysis |
| Identification of potential cell-cell interactions between two cell types and their ligand-receptor pairs for different disease states |
| Ligand | Receptor | LRpair | Pathway | Tissue | Disease Stage |
| Page: 1 |
Top |
Single-cell gene regulatory network inference analysis |
| Find out the significant the regulons (TFs) and the target genes of each regulon across cell types for different disease states |
| TF | Cell Type | Tissue | Disease Stage | Target Gene | RSS | Regulon Activity |
| ∗The dot plots of a searched regulon are shown for all cell subpopulations in each disease state of each tissue based on the regulon specific score inferred using pySCENIC and by calculating the average expression. |
| Page: 1 |
Top |
Somatic mutation of malignant transformation related genes |
| Annotation of somatic variants for genes involved in malignant transformation |
| Hugo Symbol | Variant Class | Variant Classification | dbSNP RS | HGVSc | HGVSp | HGVSp Short | SWISSPROT | BIOTYPE | SIFT | PolyPhen | Tumor Sample Barcode | Tissue | Histology | Sex | Age | Stage | Therapy Types | Drugs | Outcome |
| RFC4 | SNV | Missense_Mutation | c.203N>C | p.Gly68Ala | p.G68A | P35249 | protein_coding | tolerated(0.21) | probably_damaging(0.967) | TCGA-C8-A134-01 | Breast | breast invasive carcinoma | Female | <65 | I/II | Chemotherapy | 5-fluorouracil | CR | |
| RFC4 | SNV | Missense_Mutation | rs777641769 | c.305N>A | p.Arg102Gln | p.R102Q | P35249 | protein_coding | deleterious(0) | probably_damaging(0.926) | TCGA-C5-A1BQ-01 | Cervix | cervical & endocervical cancer | Female | >=65 | III/IV | Chemotherapy | cisplatin | CR |
| RFC4 | SNV | Missense_Mutation | c.883N>C | p.Asp295His | p.D295H | P35249 | protein_coding | deleterious(0.01) | possibly_damaging(0.528) | TCGA-A6-6651-01 | Colorectum | colon adenocarcinoma | Female | <65 | III/IV | Ancillary | leucovorin | SD | |
| RFC4 | SNV | Missense_Mutation | c.220N>A | p.Leu74Ile | p.L74I | P35249 | protein_coding | deleterious(0.01) | probably_damaging(0.967) | TCGA-AA-A00N-01 | Colorectum | colon adenocarcinoma | Male | >=65 | I/II | Unknown | Unknown | PD | |
| RFC4 | SNV | Missense_Mutation | c.374A>C | p.Asn125Thr | p.N125T | P35249 | protein_coding | tolerated(0.62) | benign(0) | TCGA-AA-A010-01 | Colorectum | colon adenocarcinoma | Female | <65 | I/II | Chemotherapy | folinic | CR | |
| RFC4 | SNV | Missense_Mutation | rs777641769 | c.305N>A | p.Arg102Gln | p.R102Q | P35249 | protein_coding | deleterious(0) | probably_damaging(0.926) | TCGA-CK-4952-01 | Colorectum | colon adenocarcinoma | Female | <65 | III/IV | Unknown | Unknown | SD |
| RFC4 | SNV | Missense_Mutation | c.425C>T | p.Pro142Leu | p.P142L | P35249 | protein_coding | deleterious(0) | probably_damaging(0.978) | TCGA-G4-6298-01 | Colorectum | colon adenocarcinoma | Male | >=65 | III/IV | Chemotherapy | irinotecan | PD | |
| RFC4 | insertion | Frame_Shift_Ins | novel | c.565_566insT | p.Pro189LeufsTer5 | p.P189Lfs*5 | P35249 | protein_coding | TCGA-AA-A01K-01 | Colorectum | colon adenocarcinoma | Female | >=65 | III/IV | Chemotherapy | folinic | CR | ||
| RFC4 | insertion | Frame_Shift_Ins | novel | c.1073dupA | p.Leu359ValfsTer8 | p.L359Vfs*8 | P35249 | protein_coding | TCGA-AZ-6603-01 | Colorectum | colon adenocarcinoma | Female | >=65 | I/II | Unknown | Unknown | SD | ||
| RFC4 | SNV | Missense_Mutation | novel | c.103N>A | p.Ala35Thr | p.A35T | P35249 | protein_coding | tolerated(0.65) | benign(0) | TCGA-AP-A051-01 | Endometrium | uterine corpus endometrioid carcinoma | Female | >=65 | I/II | Unknown | Unknown | SD |
| Page: 1 2 3 4 5 |
Top |
Related drugs of malignant transformation related genes |
| Identification of chemicals and drugs interact with genes involved in malignant transfromation |
| (DGIdb 4.0) |
| Entrez ID | Symbol | Category | Interaction Types | Drug Claim Name | Drug Name | PMIDs |
| Page: 1 |

Copyright 2023-Present -The University of Texas Health Science Center at Houston |