
|
|||||
|
 | |
| |
| |
| |
| |
| |
|
Gene: RBX1 |
Gene summary for RBX1 |
| Gene information | Species | Human | Gene symbol | RBX1 | Gene ID | 9978 |
| Gene name | ring-box 1 | |
| Gene Alias | BA554C12.1 | |
| Cytomap | 22q13.2 | |
| Gene Type | protein-coding | GO ID | GO:0000165 | UniProtAcc | P62877 |
Top |
Malignant transformation analysis |
| Identification of the aberrant gene expression in precancerous and cancerous lesions by comparing the gene expression of stem-like cells in diseased tissues with normal stem cells |
| Entrez ID | Symbol | Replicates | Species | Organ | Tissue | Adj P-value | Log2FC | Malignancy |
| 9978 | RBX1 | CCII_1 | Human | Cervix | CC | 6.05e-17 | -7.13e-01 | 0.3249 |
| 9978 | RBX1 | Tumor | Human | Cervix | CC | 4.94e-02 | 2.31e-01 | 0.1241 |
| 9978 | RBX1 | sample3 | Human | Cervix | CC | 6.69e-05 | 1.76e-01 | 0.1387 |
| 9978 | RBX1 | H2 | Human | Cervix | HSIL_HPV | 4.81e-02 | -3.11e-01 | 0.0632 |
| 9978 | RBX1 | L1 | Human | Cervix | CC | 4.75e-06 | -2.15e-01 | 0.0802 |
| 9978 | RBX1 | HTA11_1938_2000001011 | Human | Colorectum | AD | 1.37e-03 | 4.48e-01 | -0.0811 |
| 9978 | RBX1 | HTA11_347_2000001011 | Human | Colorectum | AD | 3.12e-05 | 3.13e-01 | -0.1954 |
| 9978 | RBX1 | HTA11_411_2000001011 | Human | Colorectum | SER | 1.40e-03 | 7.50e-01 | -0.2602 |
| 9978 | RBX1 | HTA11_696_2000001011 | Human | Colorectum | AD | 4.98e-06 | 3.39e-01 | -0.1464 |
| 9978 | RBX1 | HTA11_1391_2000001011 | Human | Colorectum | AD | 4.76e-06 | 4.75e-01 | -0.059 |
| 9978 | RBX1 | HTA11_546_2000001011 | Human | Colorectum | AD | 5.12e-04 | 4.78e-01 | -0.0842 |
| 9978 | RBX1 | HTA11_7696_3000711011 | Human | Colorectum | AD | 1.69e-05 | 3.44e-01 | 0.0674 |
| 9978 | RBX1 | HTA11_99999970781_79442 | Human | Colorectum | MSS | 2.35e-05 | 3.15e-01 | 0.294 |
| 9978 | RBX1 | HTA11_99999965062_69753 | Human | Colorectum | MSI-H | 2.34e-02 | 9.43e-01 | 0.3487 |
| 9978 | RBX1 | A015-C-203 | Human | Colorectum | FAP | 1.69e-03 | -1.01e-01 | -0.1294 |
| 9978 | RBX1 | A015-C-104 | Human | Colorectum | FAP | 8.07e-03 | -7.53e-02 | -0.1899 |
| 9978 | RBX1 | A002-C-116 | Human | Colorectum | FAP | 4.25e-03 | -9.05e-02 | -0.0452 |
| 9978 | RBX1 | AEH-subject1 | Human | Endometrium | AEH | 1.38e-11 | -2.87e-01 | -0.3059 |
| 9978 | RBX1 | AEH-subject2 | Human | Endometrium | AEH | 8.32e-11 | -3.52e-01 | -0.2525 |
| 9978 | RBX1 | AEH-subject3 | Human | Endometrium | AEH | 1.05e-12 | -3.39e-01 | -0.2576 |
| Page: 1 2 3 4 5 6 7 8 9 10 11 12 |
| Tissue | Expression Dynamics | Abbreviation |
| Breast | 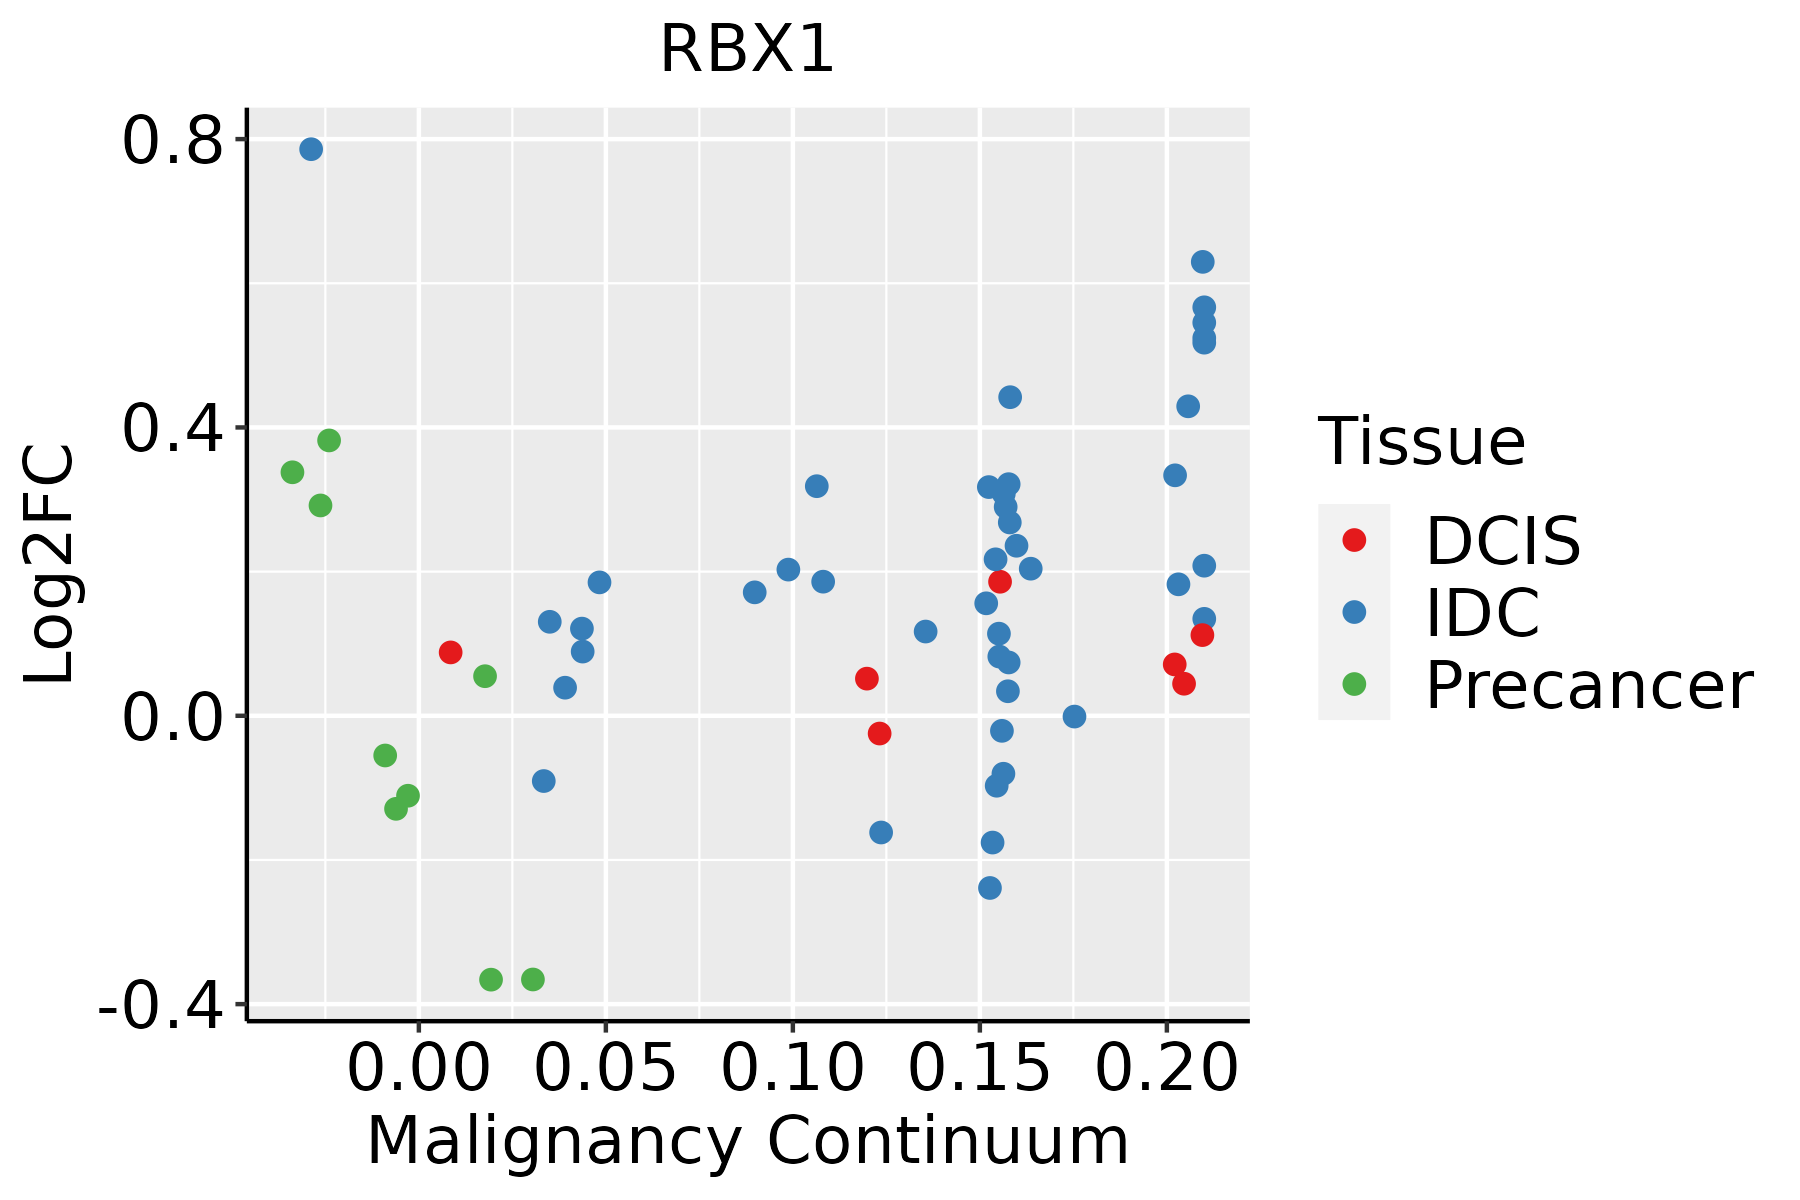 | IDC: Invasive ductal carcinoma |
| DCIS: Ductal carcinoma in situ | ||
| Precancer(BRCA1-mut): Precancerous lesion from BRCA1 mutation carriers | ||
| Cervix | 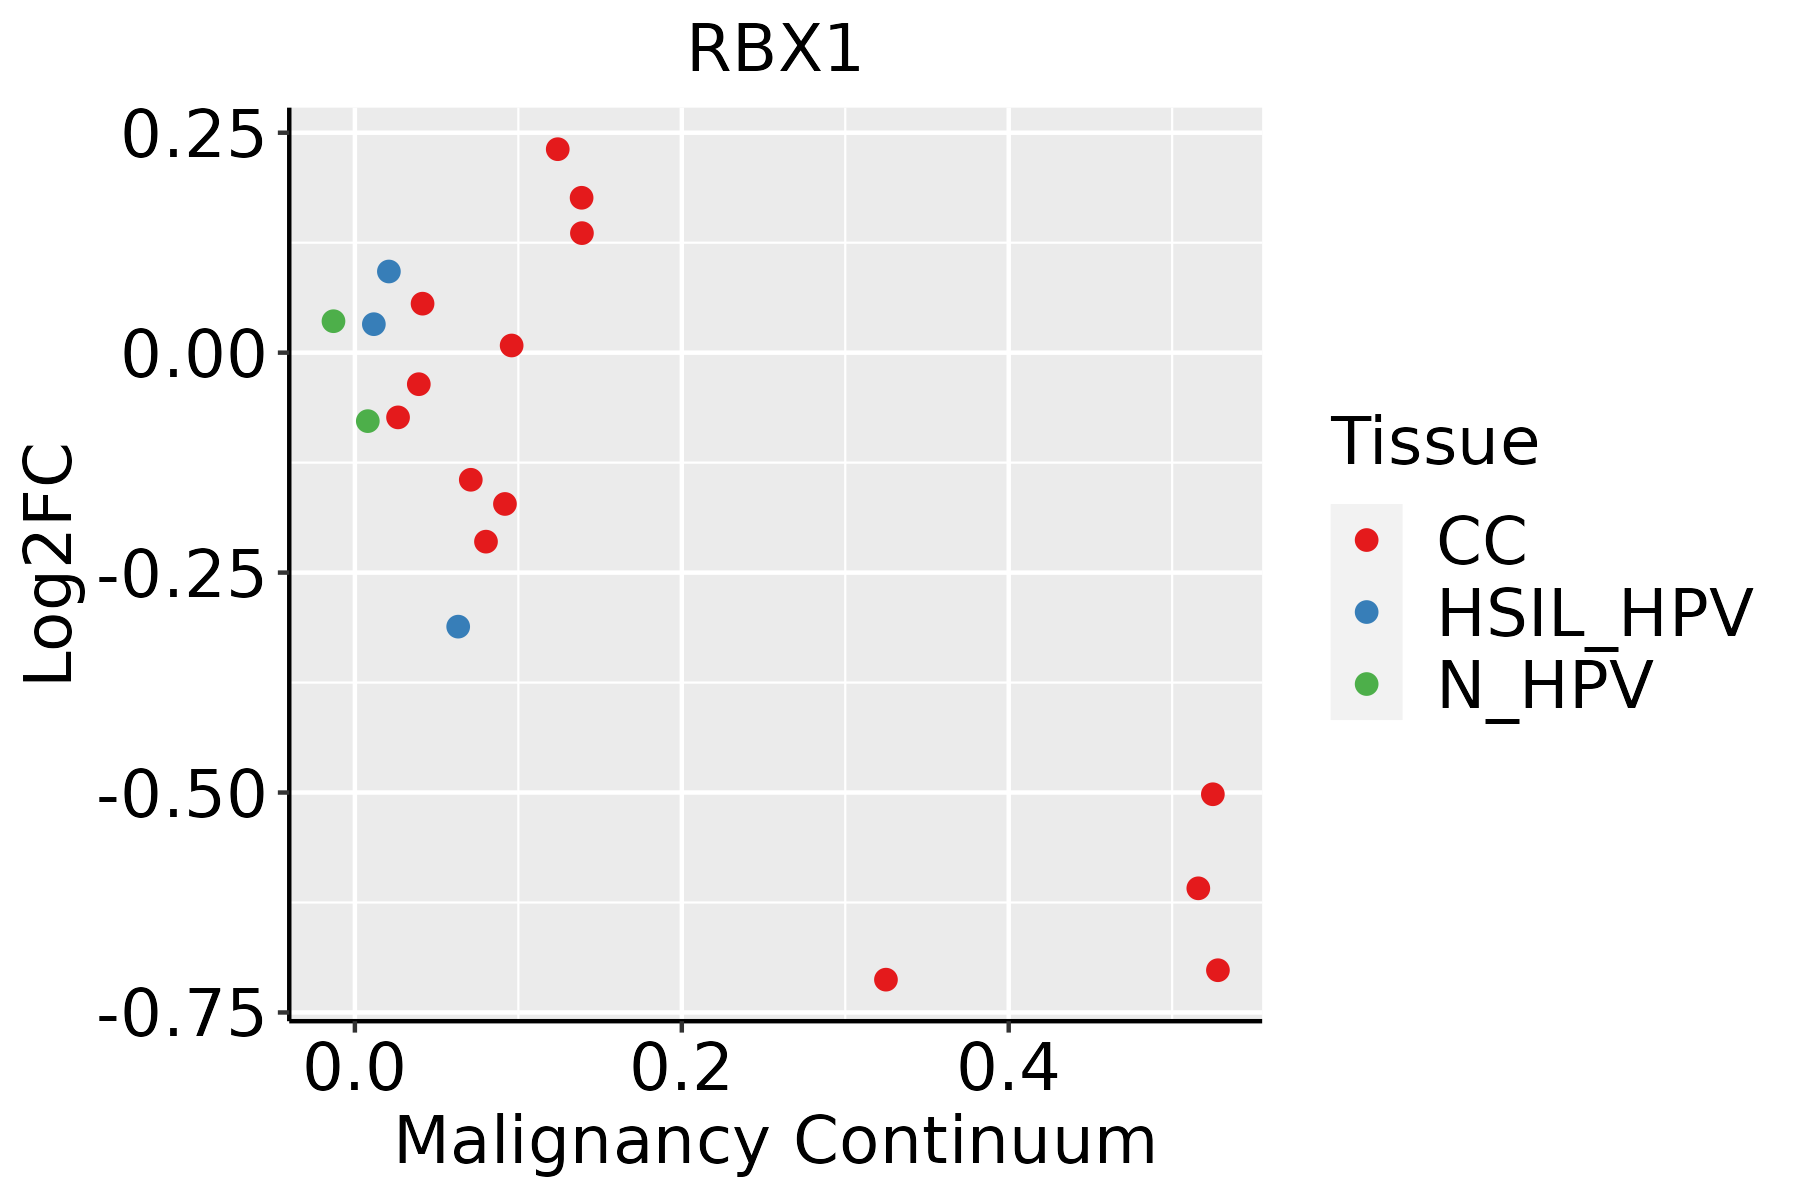 | CC: Cervix cancer |
| HSIL_HPV: HPV-infected high-grade squamous intraepithelial lesions | ||
| N_HPV: HPV-infected normal cervix | ||
| Colorectum (GSE201348) |  | FAP: Familial adenomatous polyposis |
| CRC: Colorectal cancer | ||
| Colorectum (HTA11) |  | AD: Adenomas |
| SER: Sessile serrated lesions | ||
| MSI-H: Microsatellite-high colorectal cancer | ||
| MSS: Microsatellite stable colorectal cancer | ||
| Endometrium | 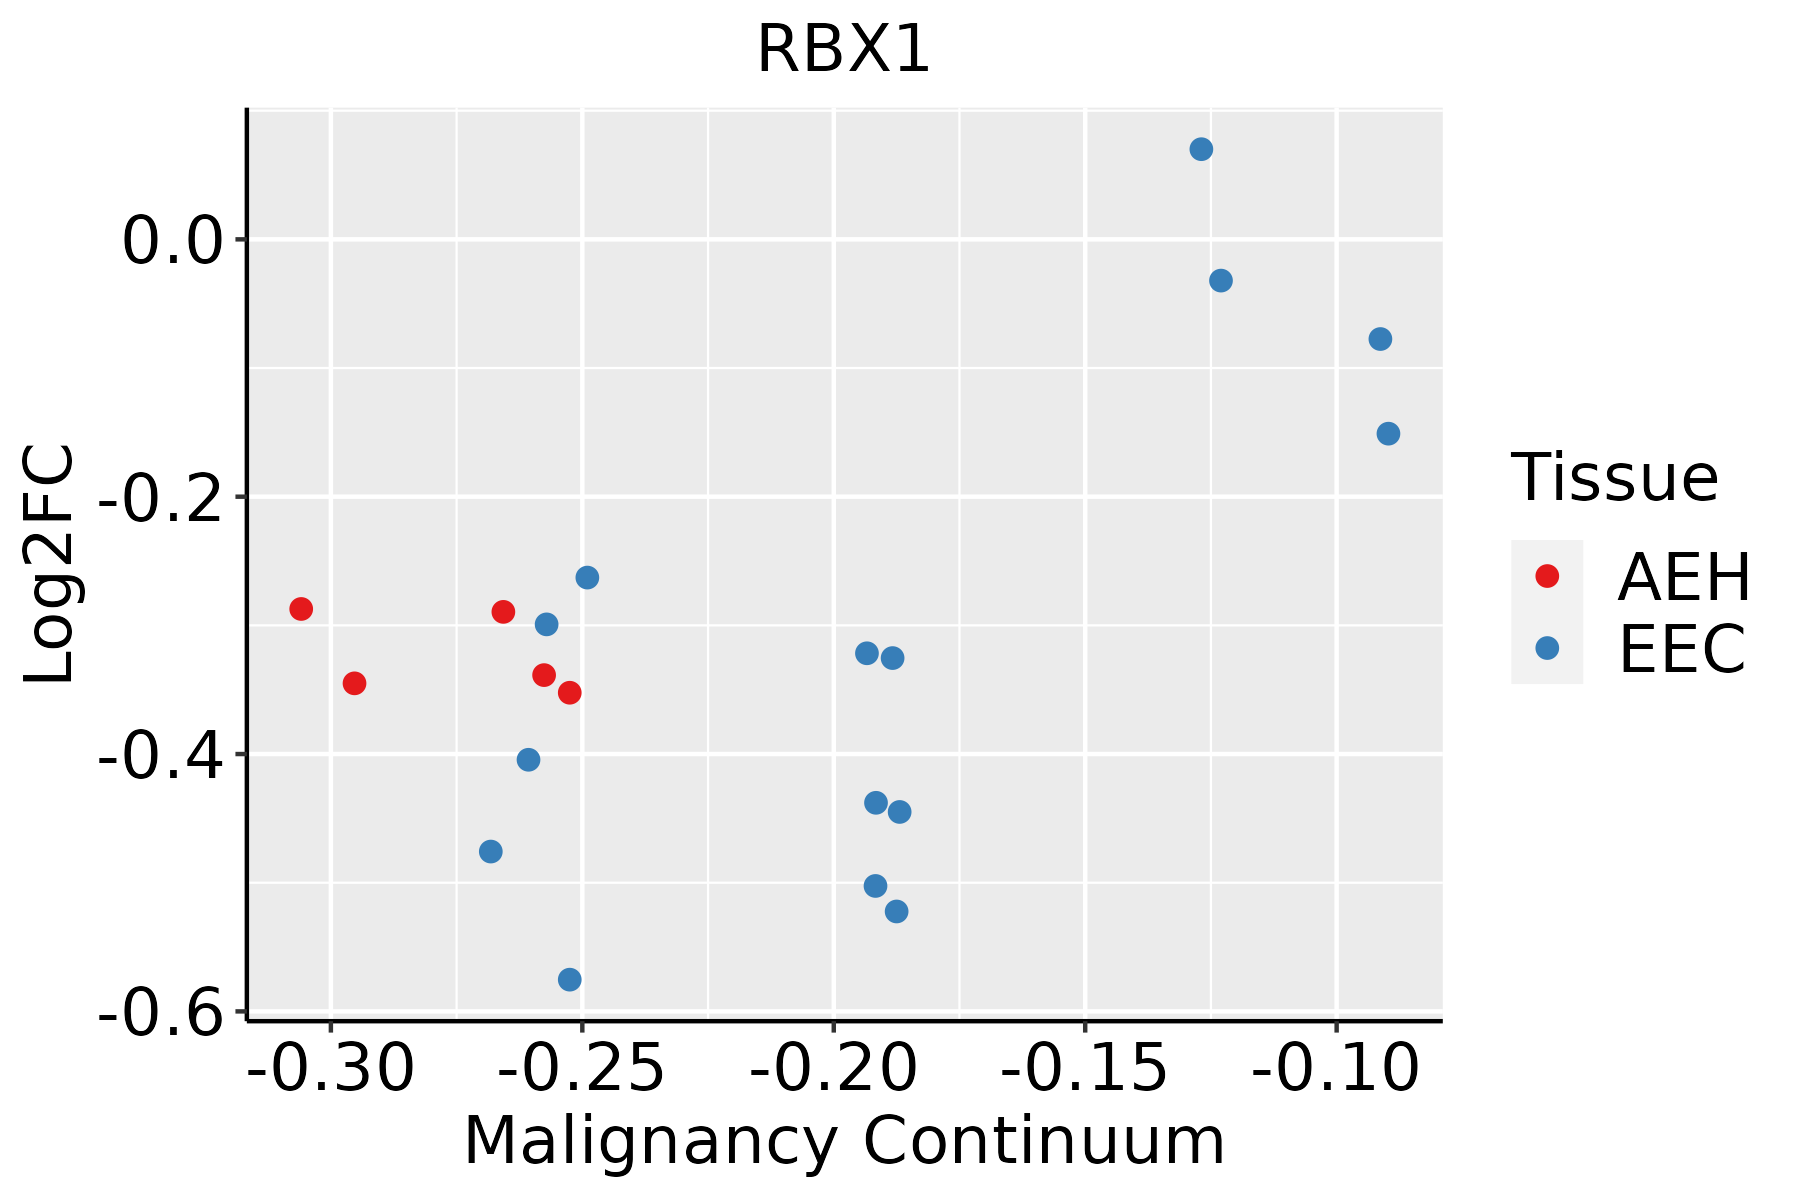 | AEH: Atypical endometrial hyperplasia |
| EEC: Endometrioid Cancer | ||
| Esophagus | 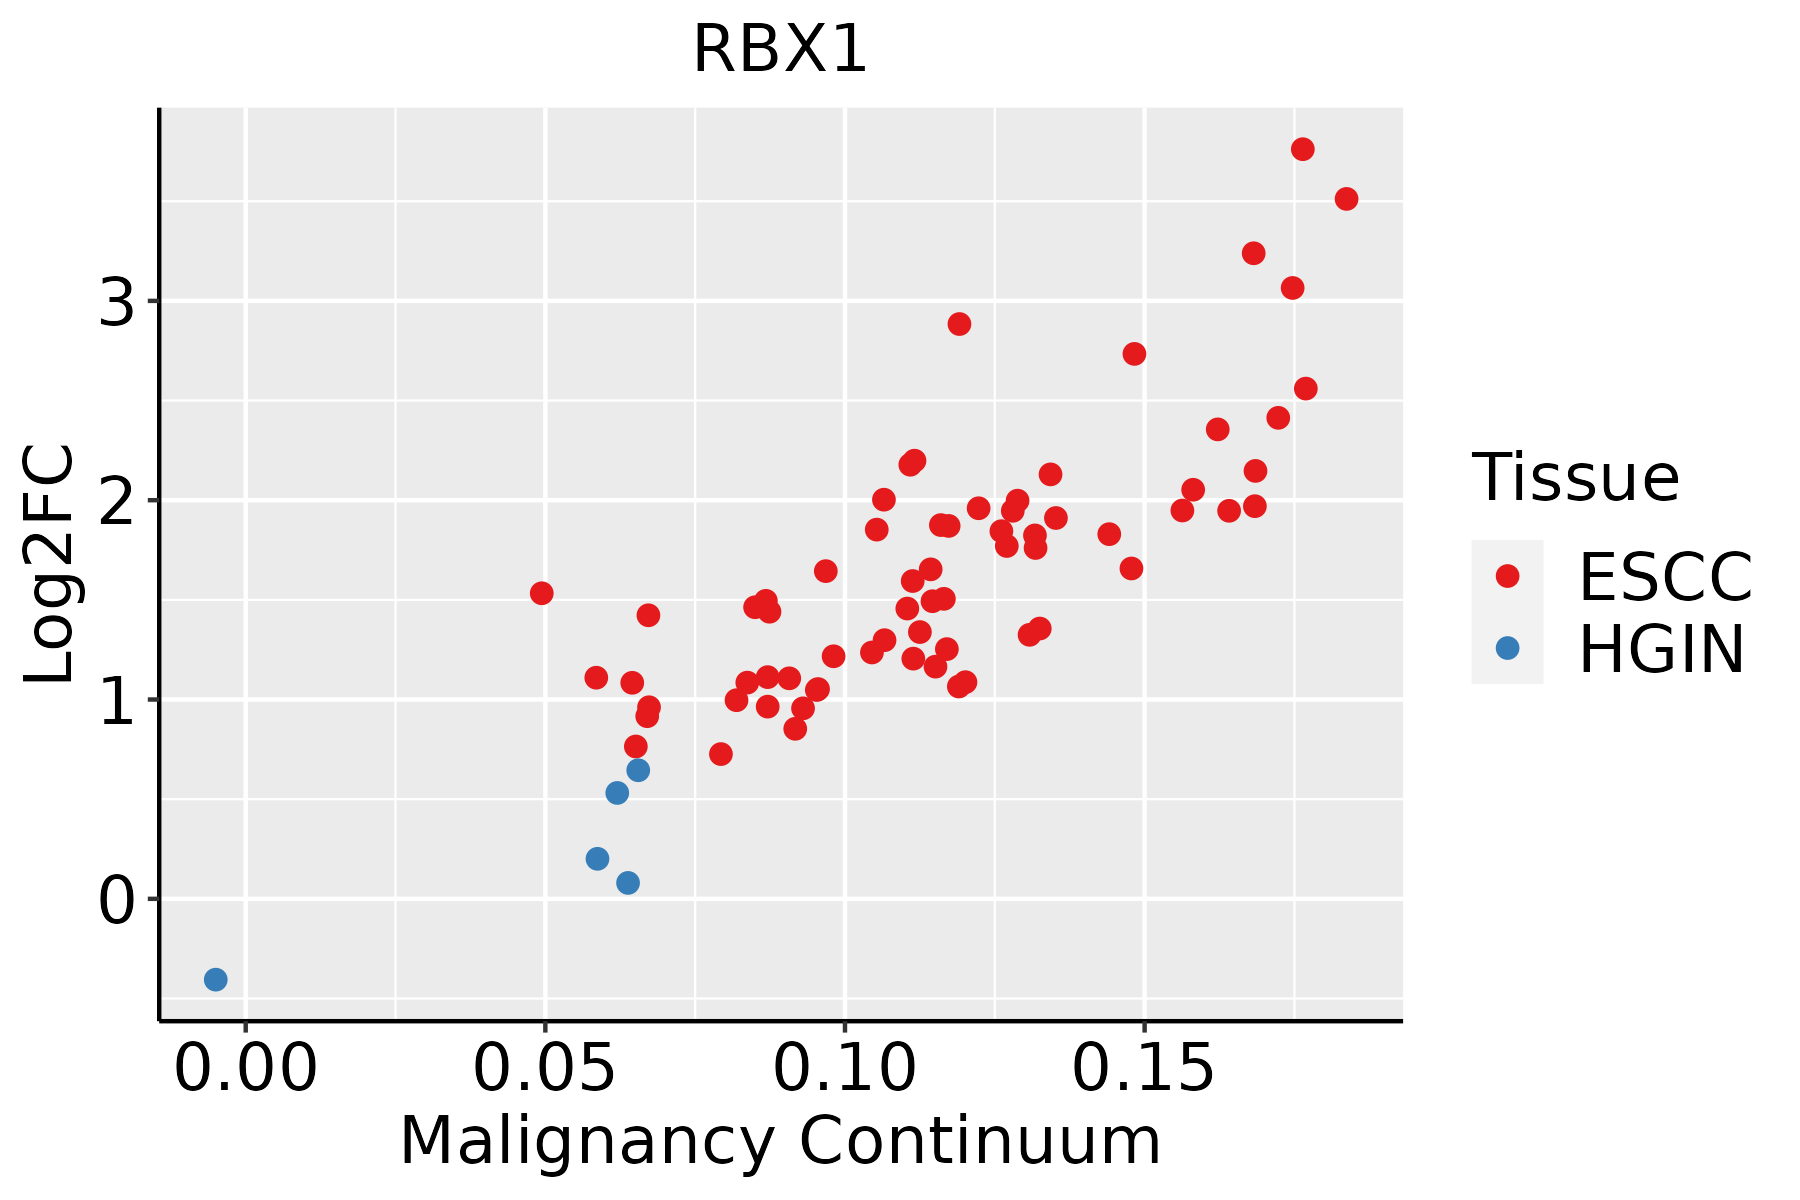 | ESCC: Esophageal squamous cell carcinoma |
| HGIN: High-grade intraepithelial neoplasias | ||
| LGIN: Low-grade intraepithelial neoplasias | ||
| Liver |  | HCC: Hepatocellular carcinoma |
| NAFLD: Non-alcoholic fatty liver disease | ||
| Oral Cavity | 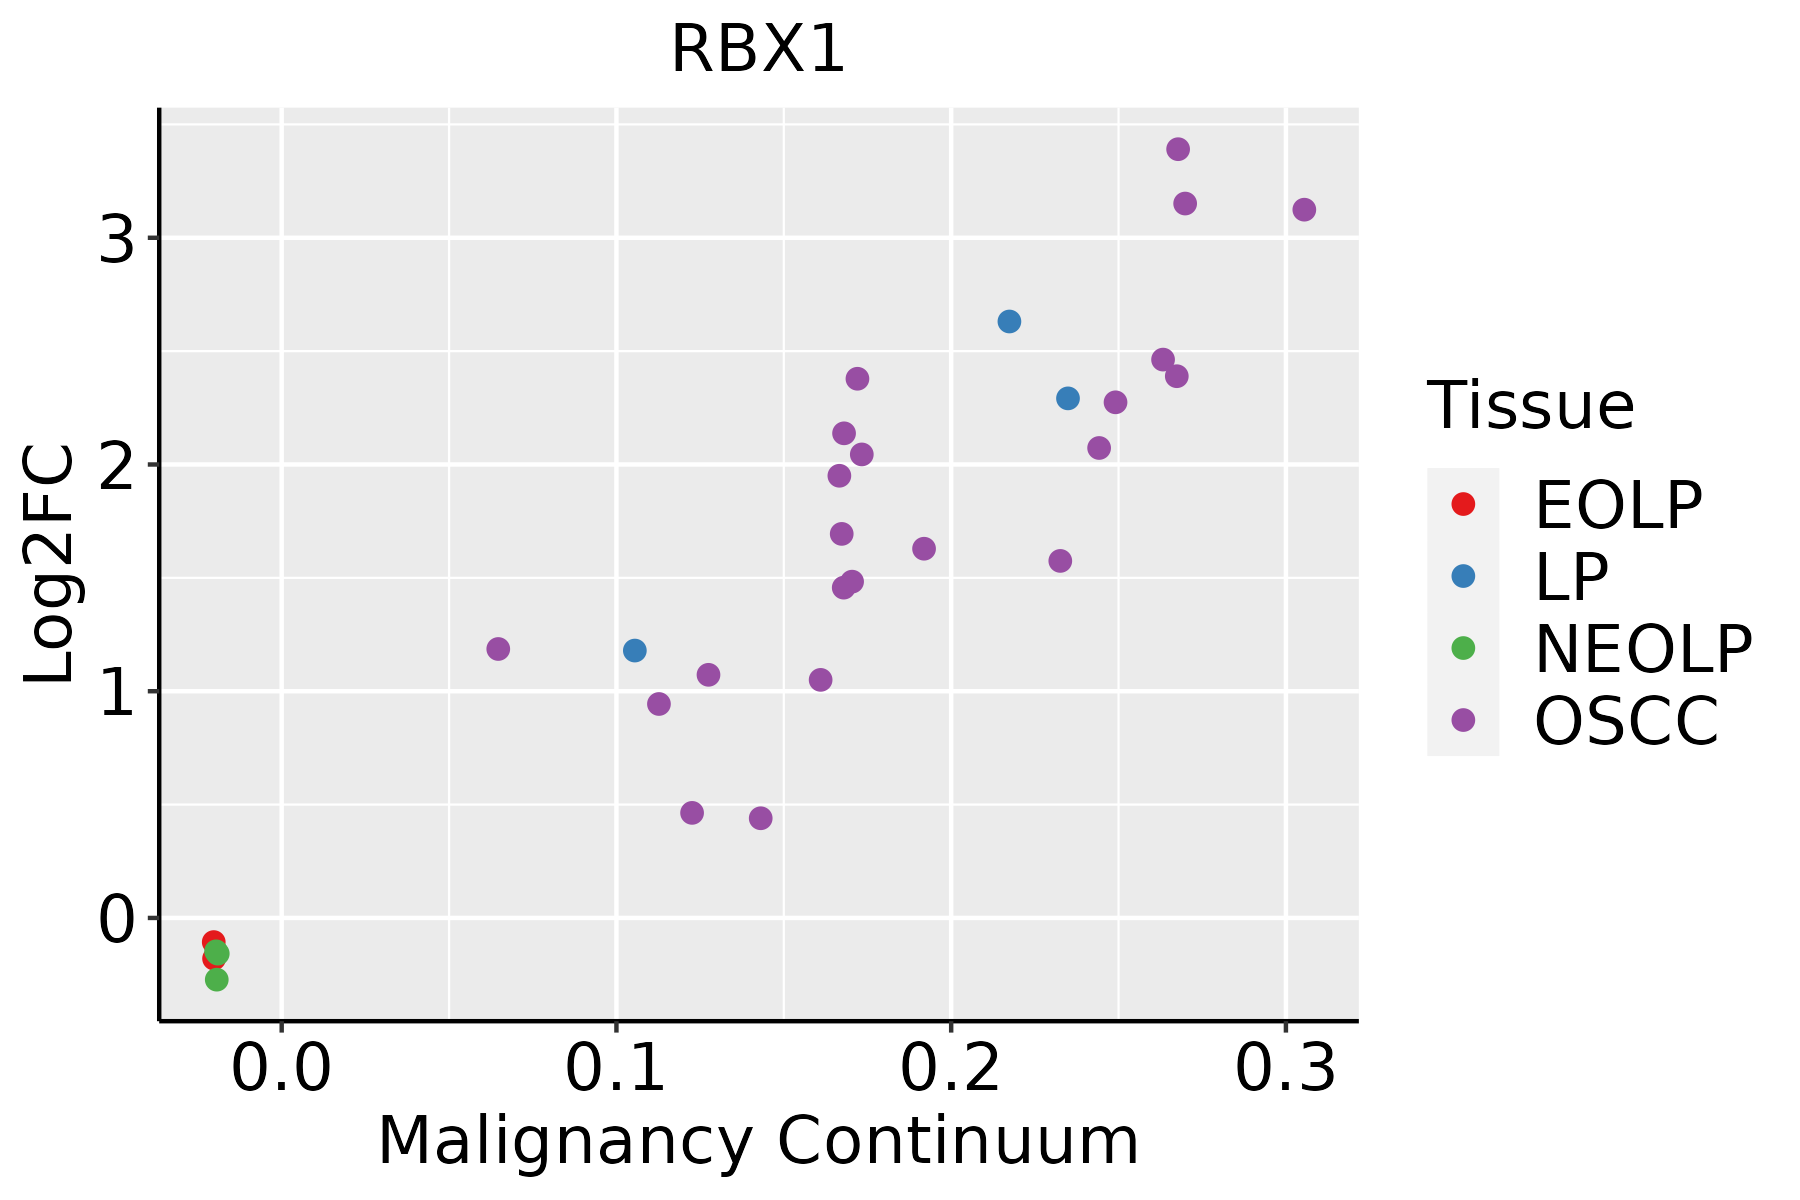 | EOLP: Erosive Oral lichen planus |
| LP: leukoplakia | ||
| NEOLP: Non-erosive oral lichen planus | ||
| OSCC: Oral squamous cell carcinoma | ||
| Prostate | 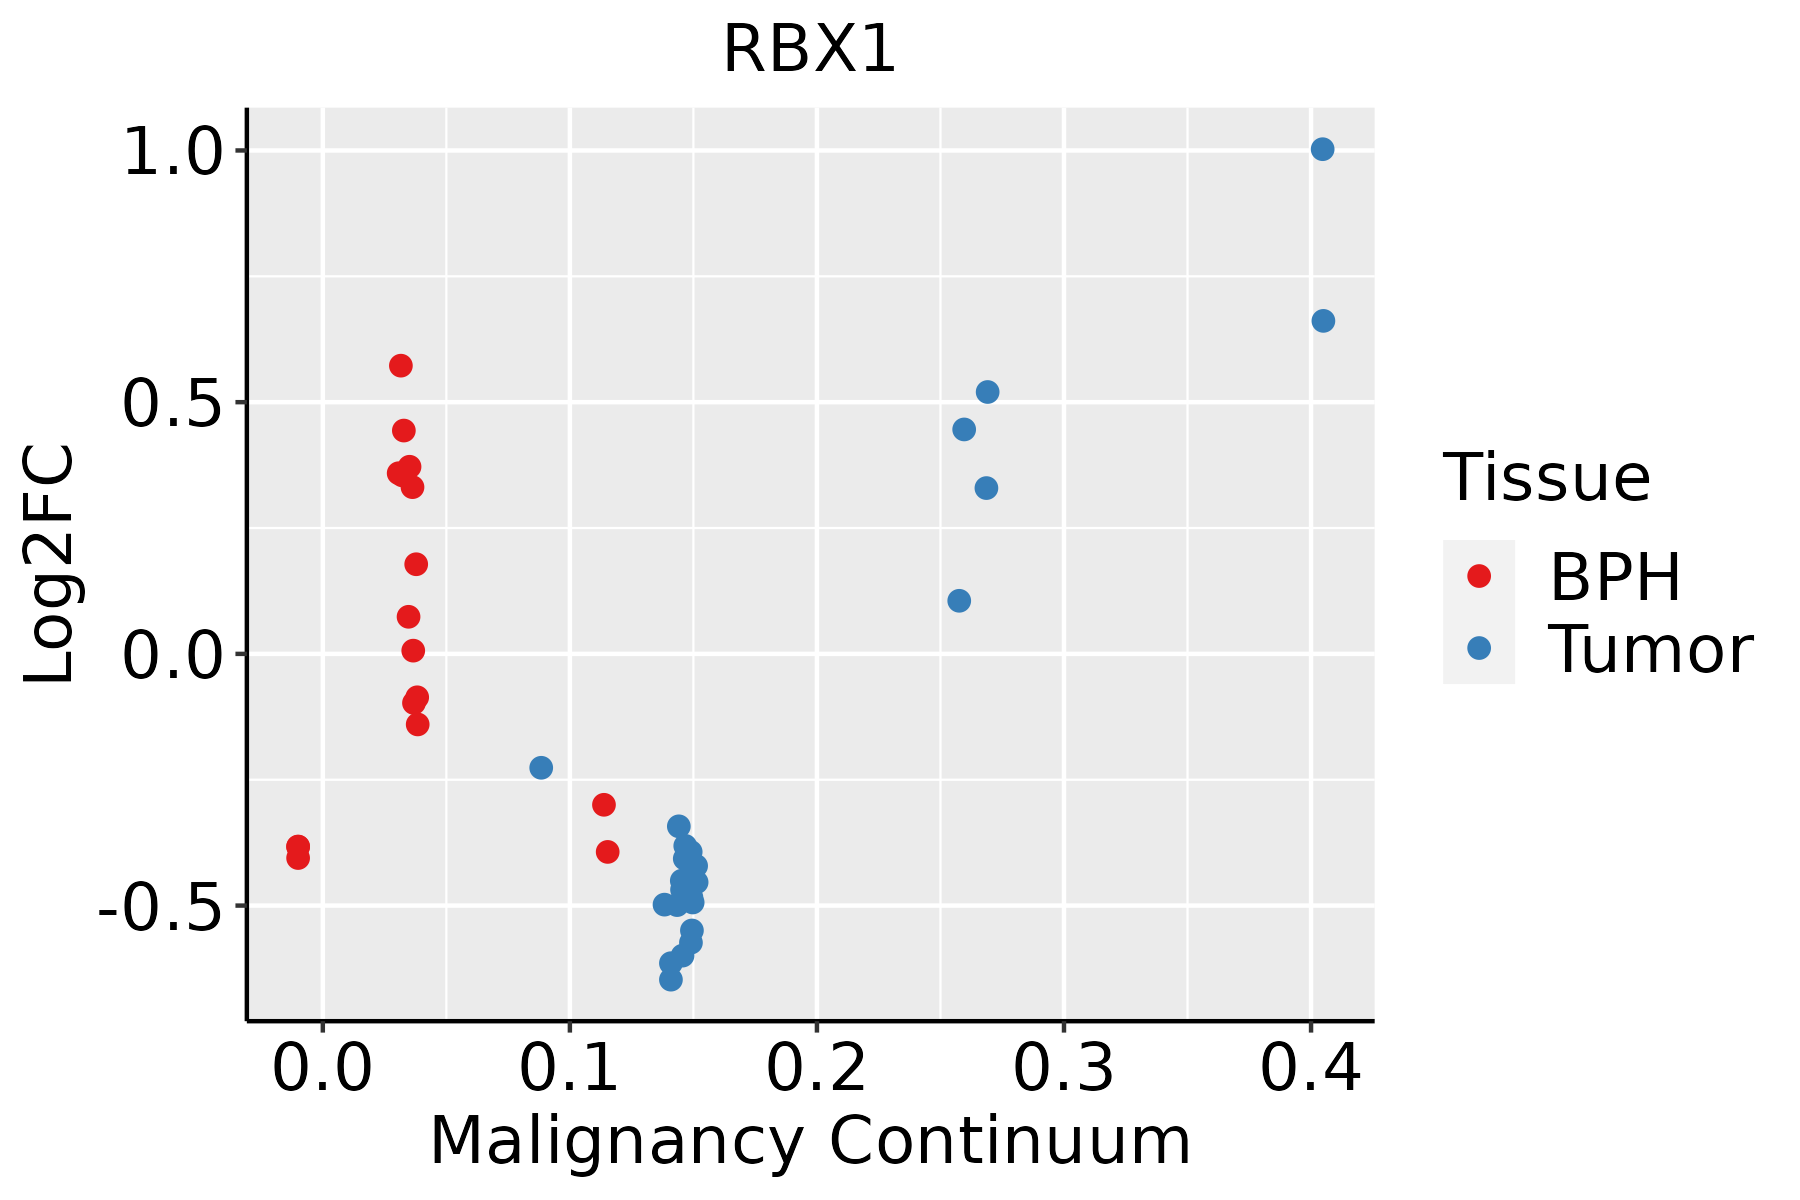 | BPH: Benign Prostatic Hyperplasia |
| Skin |  | AK: Actinic keratosis |
| cSCC: Cutaneous squamous cell carcinoma | ||
| SCCIS:squamous cell carcinoma in situ | ||
| Thyroid |  | ATC: Anaplastic thyroid cancer |
| HT: Hashimoto's thyroiditis | ||
| PTC: Papillary thyroid cancer |
| ∗log2FC in expression of this searched gene in stem-like cells from each diseased tissue sample relative to stem-like cells in normal samples in each tissue plotted against the malignancy continuum. Samples are colored based on if they are from different disease stage. |
Top |
Malignant transformation related pathway analysis |
| Find out the enriched GO biological processes and KEGG pathways involved in transition from healthy to precancer to cancer |
| Tissue | Disease Stage | Enriched GO biological Processes |
| Colorectum | AD |  |
| Colorectum | SER |  |
| Colorectum | MSS |  |
| Colorectum | MSI-H |  |
| Colorectum | FAP |  |
| ∗Top 15 enriched GO BP terms are showed in the bar plot of each disease state in each tissue. Each row represents a significant GO biological process which is colored according to the -log10(p.adjust). |
| Page: 1 2 3 4 5 6 7 8 9 |
| GO ID | Tissue | Disease Stage | Description | Gene Ratio | Bg Ratio | pvalue | p.adjust | Count |
| GO:00069799 | Breast | Precancer | response to oxidative stress | 70/1080 | 446/18723 | 1.59e-14 | 4.26e-12 | 70 |
| GO:00003029 | Breast | Precancer | response to reactive oxygen species | 38/1080 | 222/18723 | 1.47e-09 | 1.23e-07 | 38 |
| GO:00458629 | Breast | Precancer | positive regulation of proteolysis | 51/1080 | 372/18723 | 7.77e-09 | 5.70e-07 | 51 |
| GO:19033209 | Breast | Precancer | regulation of protein modification by small protein conjugation or removal | 38/1080 | 242/18723 | 1.71e-08 | 1.17e-06 | 38 |
| GO:00313969 | Breast | Precancer | regulation of protein ubiquitination | 33/1080 | 210/18723 | 1.45e-07 | 7.82e-06 | 33 |
| GO:00104989 | Breast | Precancer | proteasomal protein catabolic process | 58/1080 | 490/18723 | 1.54e-07 | 8.05e-06 | 58 |
| GO:19033629 | Breast | Precancer | regulation of cellular protein catabolic process | 36/1080 | 255/18723 | 6.03e-07 | 2.55e-05 | 36 |
| GO:00421769 | Breast | Precancer | regulation of protein catabolic process | 47/1080 | 391/18723 | 1.50e-06 | 5.58e-05 | 47 |
| GO:19030509 | Breast | Precancer | regulation of proteolysis involved in cellular protein catabolic process | 31/1080 | 221/18723 | 4.10e-06 | 1.27e-04 | 31 |
| GO:00611369 | Breast | Precancer | regulation of proteasomal protein catabolic process | 24/1080 | 187/18723 | 1.99e-04 | 3.14e-03 | 24 |
| GO:00431619 | Breast | Precancer | proteasome-mediated ubiquitin-dependent protein catabolic process | 42/1080 | 412/18723 | 2.49e-04 | 3.72e-03 | 42 |
| GO:00098969 | Breast | Precancer | positive regulation of catabolic process | 48/1080 | 492/18723 | 2.62e-04 | 3.84e-03 | 48 |
| GO:00313319 | Breast | Precancer | positive regulation of cellular catabolic process | 43/1080 | 427/18723 | 2.75e-04 | 4.00e-03 | 43 |
| GO:20000589 | Breast | Precancer | regulation of ubiquitin-dependent protein catabolic process | 21/1080 | 164/18723 | 5.00e-04 | 6.53e-03 | 21 |
| GO:19033649 | Breast | Precancer | positive regulation of cellular protein catabolic process | 20/1080 | 155/18723 | 6.10e-04 | 7.67e-03 | 20 |
| GO:19030527 | Breast | Precancer | positive regulation of proteolysis involved in cellular protein catabolic process | 17/1080 | 133/18723 | 1.68e-03 | 1.70e-02 | 17 |
| GO:00457329 | Breast | Precancer | positive regulation of protein catabolic process | 25/1080 | 231/18723 | 1.87e-03 | 1.82e-02 | 25 |
| GO:19018007 | Breast | Precancer | positive regulation of proteasomal protein catabolic process | 15/1080 | 114/18723 | 2.31e-03 | 2.15e-02 | 15 |
| GO:00324349 | Breast | Precancer | regulation of proteasomal ubiquitin-dependent protein catabolic process | 16/1080 | 134/18723 | 4.51e-03 | 3.50e-02 | 16 |
| GO:000697914 | Breast | IDC | response to oxidative stress | 83/1434 | 446/18723 | 2.36e-14 | 7.06e-12 | 83 |
| Page: 1 2 3 4 5 6 7 8 9 10 11 12 13 14 15 16 17 18 19 20 21 22 23 24 25 26 27 28 29 30 31 32 33 34 35 36 37 38 39 40 41 |
| Pathway ID | Tissue | Disease Stage | Description | Gene Ratio | Bg Ratio | pvalue | p.adjust | qvalue | Count |
| hsa0513118 | Breast | Precancer | Shigellosis | 44/684 | 247/8465 | 3.91e-07 | 6.86e-06 | 5.26e-06 | 44 |
| hsa0414118 | Breast | Precancer | Protein processing in endoplasmic reticulum | 33/684 | 174/8465 | 2.78e-06 | 3.83e-05 | 2.94e-05 | 33 |
| hsa0406616 | Breast | Precancer | HIF-1 signaling pathway | 23/684 | 109/8465 | 1.51e-05 | 1.59e-04 | 1.22e-04 | 23 |
| hsa0513119 | Breast | Precancer | Shigellosis | 44/684 | 247/8465 | 3.91e-07 | 6.86e-06 | 5.26e-06 | 44 |
| hsa0414119 | Breast | Precancer | Protein processing in endoplasmic reticulum | 33/684 | 174/8465 | 2.78e-06 | 3.83e-05 | 2.94e-05 | 33 |
| hsa0406617 | Breast | Precancer | HIF-1 signaling pathway | 23/684 | 109/8465 | 1.51e-05 | 1.59e-04 | 1.22e-04 | 23 |
| hsa0513124 | Breast | IDC | Shigellosis | 47/867 | 247/8465 | 1.78e-05 | 2.00e-04 | 1.49e-04 | 47 |
| hsa0414124 | Breast | IDC | Protein processing in endoplasmic reticulum | 36/867 | 174/8465 | 2.73e-05 | 2.86e-04 | 2.14e-04 | 36 |
| hsa0406623 | Breast | IDC | HIF-1 signaling pathway | 22/867 | 109/8465 | 1.36e-03 | 1.00e-02 | 7.50e-03 | 22 |
| hsa052118 | Breast | IDC | Renal cell carcinoma | 14/867 | 69/8465 | 9.16e-03 | 4.37e-02 | 3.27e-02 | 14 |
| hsa0517014 | Breast | IDC | Human immunodeficiency virus 1 infection | 33/867 | 212/8465 | 9.28e-03 | 4.37e-02 | 3.27e-02 | 33 |
| hsa0513134 | Breast | IDC | Shigellosis | 47/867 | 247/8465 | 1.78e-05 | 2.00e-04 | 1.49e-04 | 47 |
| hsa0414134 | Breast | IDC | Protein processing in endoplasmic reticulum | 36/867 | 174/8465 | 2.73e-05 | 2.86e-04 | 2.14e-04 | 36 |
| hsa0406633 | Breast | IDC | HIF-1 signaling pathway | 22/867 | 109/8465 | 1.36e-03 | 1.00e-02 | 7.50e-03 | 22 |
| hsa0521113 | Breast | IDC | Renal cell carcinoma | 14/867 | 69/8465 | 9.16e-03 | 4.37e-02 | 3.27e-02 | 14 |
| hsa0517015 | Breast | IDC | Human immunodeficiency virus 1 infection | 33/867 | 212/8465 | 9.28e-03 | 4.37e-02 | 3.27e-02 | 33 |
| hsa0414143 | Breast | DCIS | Protein processing in endoplasmic reticulum | 36/846 | 174/8465 | 1.60e-05 | 1.91e-04 | 1.41e-04 | 36 |
| hsa0513144 | Breast | DCIS | Shigellosis | 46/846 | 247/8465 | 2.06e-05 | 2.38e-04 | 1.75e-04 | 46 |
| hsa0406642 | Breast | DCIS | HIF-1 signaling pathway | 22/846 | 109/8465 | 9.83e-04 | 7.05e-03 | 5.20e-03 | 22 |
| hsa0517024 | Breast | DCIS | Human immunodeficiency virus 1 infection | 33/846 | 212/8465 | 6.49e-03 | 3.22e-02 | 2.37e-02 | 33 |
| Page: 1 2 3 4 5 6 7 8 9 10 11 12 13 14 15 16 |
Top |
Cell-cell communication analysis |
| Identification of potential cell-cell interactions between two cell types and their ligand-receptor pairs for different disease states |
| Ligand | Receptor | LRpair | Pathway | Tissue | Disease Stage |
| Page: 1 |
Top |
Single-cell gene regulatory network inference analysis |
| Find out the significant the regulons (TFs) and the target genes of each regulon across cell types for different disease states |
| TF | Cell Type | Tissue | Disease Stage | Target Gene | RSS | Regulon Activity |
| ∗The dot plots of a searched regulon are shown for all cell subpopulations in each disease state of each tissue based on the regulon specific score inferred using pySCENIC and by calculating the average expression. |
| Page: 1 |
Top |
Somatic mutation of malignant transformation related genes |
| Annotation of somatic variants for genes involved in malignant transformation |
| Hugo Symbol | Variant Class | Variant Classification | dbSNP RS | HGVSc | HGVSp | HGVSp Short | SWISSPROT | BIOTYPE | SIFT | PolyPhen | Tumor Sample Barcode | Tissue | Histology | Sex | Age | Stage | Therapy Types | Drugs | Outcome |
| RBX1 | SNV | Missense_Mutation | c.182N>T | p.Ala61Val | p.A61V | P62877 | protein_coding | tolerated(0.14) | benign(0.036) | TCGA-2W-A8YY-01 | Cervix | cervical & endocervical cancer | Female | <65 | I/II | Chemotherapy | cisplatin | CR | |
| RBX1 | SNV | Missense_Mutation | c.81N>C | p.Trp27Cys | p.W27C | P62877 | protein_coding | deleterious(0.01) | probably_damaging(0.998) | TCGA-EK-A3GK-01 | Cervix | cervical & endocervical cancer | Female | <65 | I/II | Unknown | Unknown | SD | |
| RBX1 | SNV | Missense_Mutation | c.257N>A | p.Arg86His | p.R86H | P62877 | protein_coding | deleterious(0.02) | possibly_damaging(0.803) | TCGA-AG-3887-01 | Colorectum | rectum adenocarcinoma | Male | >=65 | I/II | Chemotherapy | irinotecan | SD | |
| RBX1 | SNV | Missense_Mutation | novel | c.283N>T | p.Pro95Ser | p.P95S | P62877 | protein_coding | deleterious(0) | probably_damaging(0.998) | TCGA-AP-A051-01 | Endometrium | uterine corpus endometrioid carcinoma | Female | >=65 | I/II | Unknown | Unknown | SD |
| RBX1 | SNV | Missense_Mutation | c.182N>T | p.Ala61Val | p.A61V | P62877 | protein_coding | tolerated(0.14) | benign(0.036) | TCGA-AX-A0J1-01 | Endometrium | uterine corpus endometrioid carcinoma | Female | >=65 | I/II | Unknown | Unknown | SD | |
| RBX1 | SNV | Missense_Mutation | novel | c.185N>T | p.Ser62Phe | p.S62F | P62877 | protein_coding | deleterious(0.01) | possibly_damaging(0.832) | TCGA-EO-A22U-01 | Endometrium | uterine corpus endometrioid carcinoma | Female | >=65 | I/II | Unknown | Unknown | SD |
| RBX1 | SNV | Missense_Mutation | c.29N>A | p.Pro10Gln | p.P10Q | P62877 | protein_coding | tolerated(0.09) | benign(0.031) | TCGA-18-3414-01 | Lung | lung squamous cell carcinoma | Male | >=65 | III/IV | Unknown | Unknown | SD | |
| RBX1 | SNV | Missense_Mutation | c.150N>A | p.Met50Ile | p.M50I | P62877 | protein_coding | deleterious(0) | probably_damaging(0.969) | TCGA-66-2792-01 | Lung | lung squamous cell carcinoma | Male | <65 | I/II | Chemotherapy | carboplatin | CR | |
| RBX1 | SNV | Missense_Mutation | novel | c.109A>G | p.Ile37Val | p.I37V | P62877 | protein_coding | tolerated(0.13) | benign(0.122) | TCGA-CN-A641-01 | Oral cavity | head & neck squamous cell carcinoma | Male | <65 | I/II | Chemotherapy | cisplatin | CR |
| RBX1 | SNV | Missense_Mutation | novel | c.148A>G | p.Met50Val | p.M50V | P62877 | protein_coding | deleterious(0) | probably_damaging(0.954) | TCGA-CV-7242-01 | Oral cavity | head & neck squamous cell carcinoma | Female | <65 | I/II | Unknown | Unknown | SD |
| Page: 1 2 |
Top |
Related drugs of malignant transformation related genes |
| Identification of chemicals and drugs interact with genes involved in malignant transfromation |
| (DGIdb 4.0) |
| Entrez ID | Symbol | Category | Interaction Types | Drug Claim Name | Drug Name | PMIDs |
| 9978 | RBX1 | DNA REPAIR, ENZYME | inhibitor | CHEMBL468 | THALIDOMIDE | |
| 9978 | RBX1 | DNA REPAIR, ENZYME | fluorouracil | FLUOROURACIL | ||
| 9978 | RBX1 | DNA REPAIR, ENZYME | epirubicin | EPIRUBICIN | ||
| 9978 | RBX1 | DNA REPAIR, ENZYME | cyclophosphamide | CYCLOPHOSPHAMIDE | ||
| 9978 | RBX1 | DNA REPAIR, ENZYME | inhibitor | CHEMBL43452 | POMALIDOMIDE | |
| 9978 | RBX1 | DNA REPAIR, ENZYME | inhibitor | CHEMBL848 | LENALIDOMIDE |
| Page: 1 |

Copyright 2023-Present -The University of Texas Health Science Center at Houston |