| Tissue | Expression Dynamics | Abbreviation |
| Colorectum (GSE201348) | 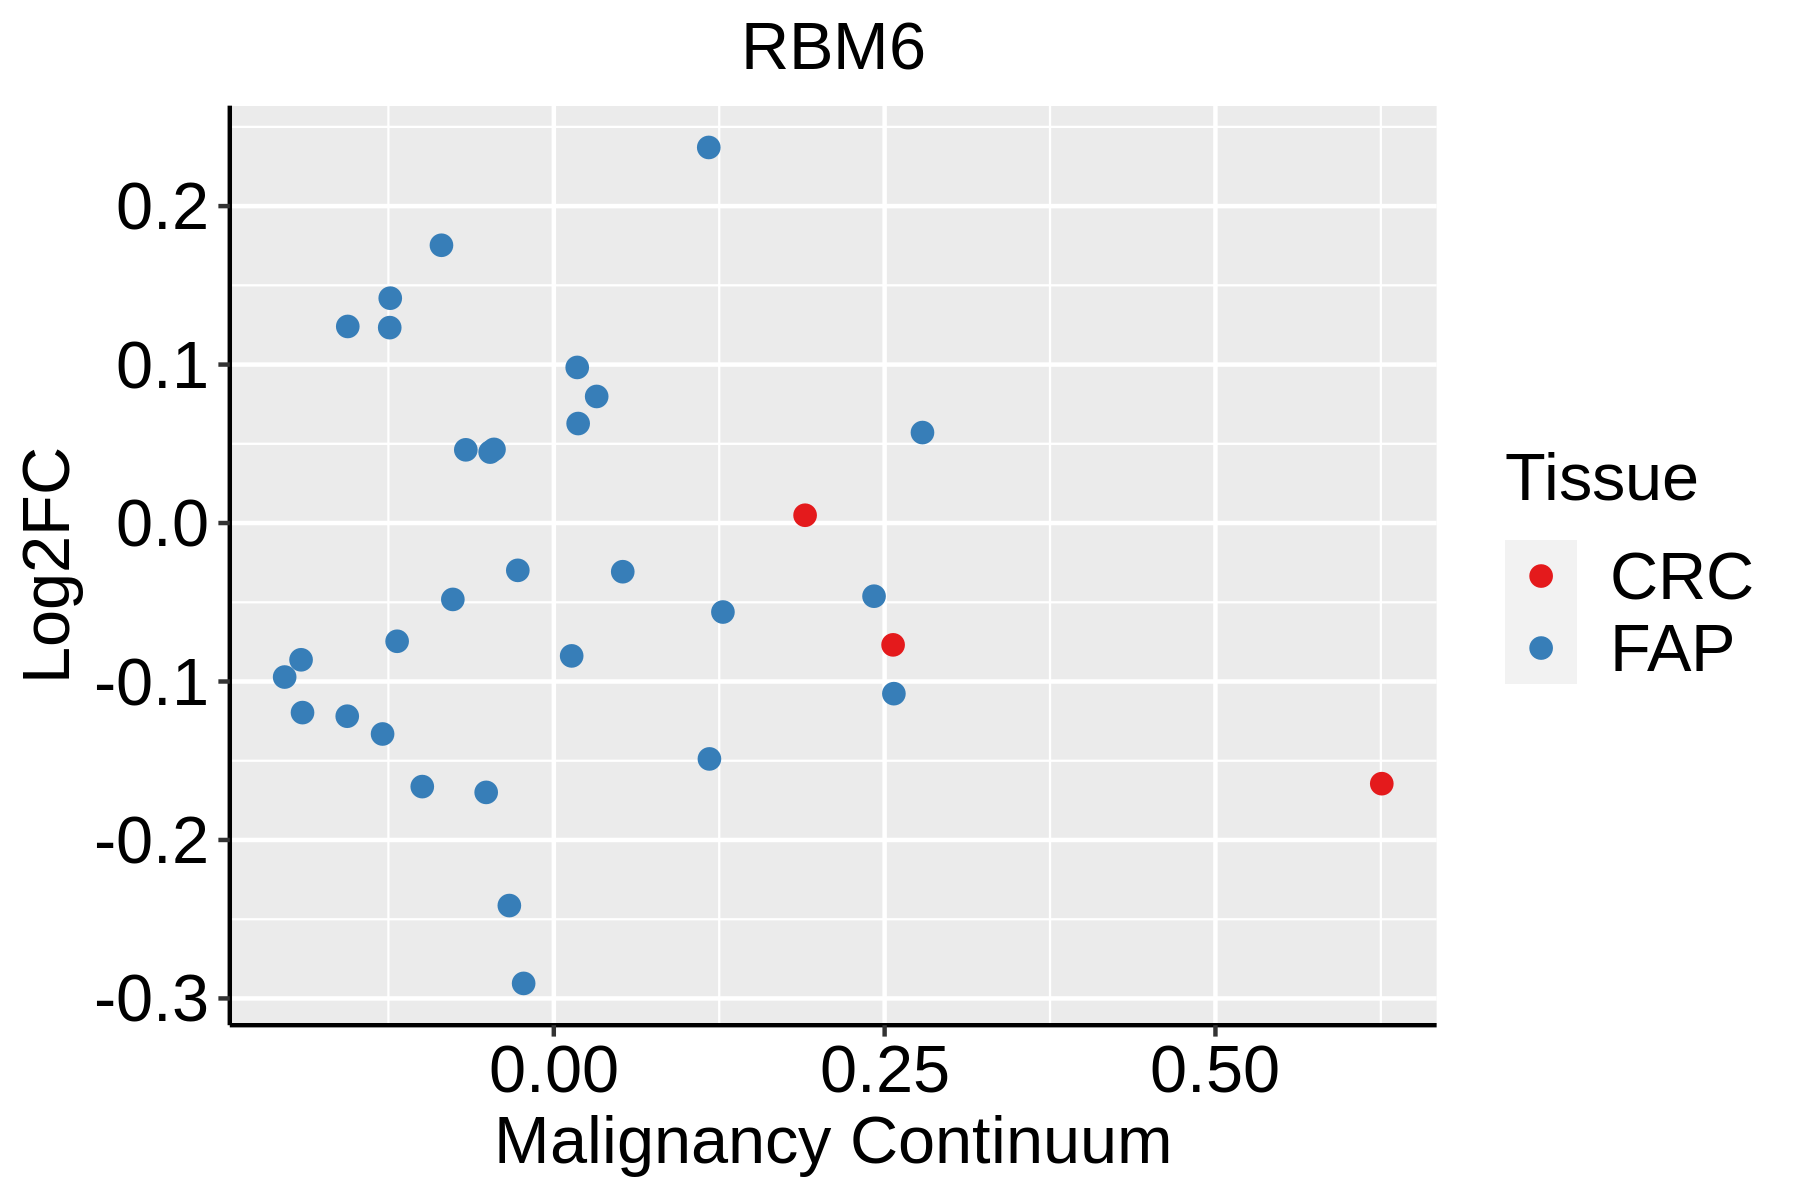 | FAP: Familial adenomatous polyposis |
| CRC: Colorectal cancer |
| Colorectum (HTA11) | 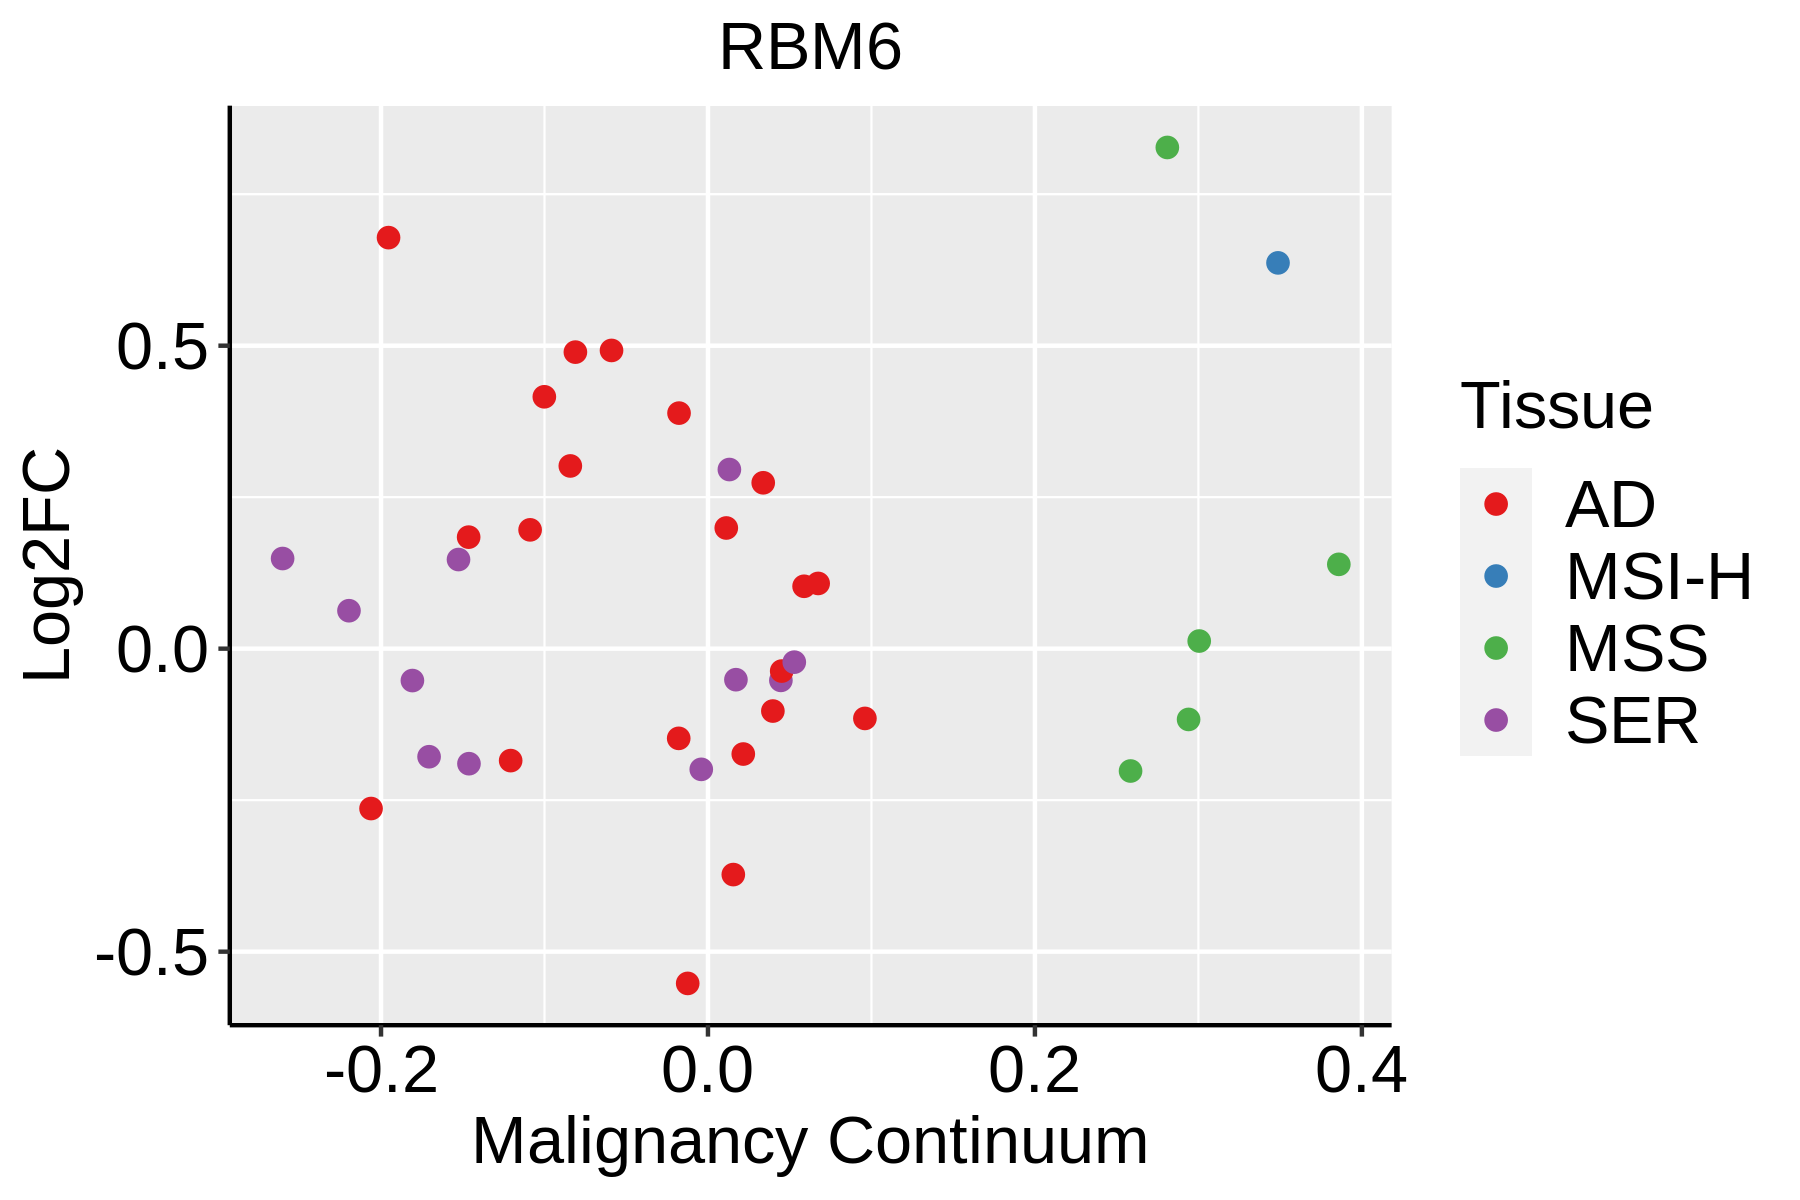 | AD: Adenomas |
| SER: Sessile serrated lesions |
| MSI-H: Microsatellite-high colorectal cancer |
| MSS: Microsatellite stable colorectal cancer |
| Endometrium |  | AEH: Atypical endometrial hyperplasia |
| EEC: Endometrioid Cancer |
| Esophagus | 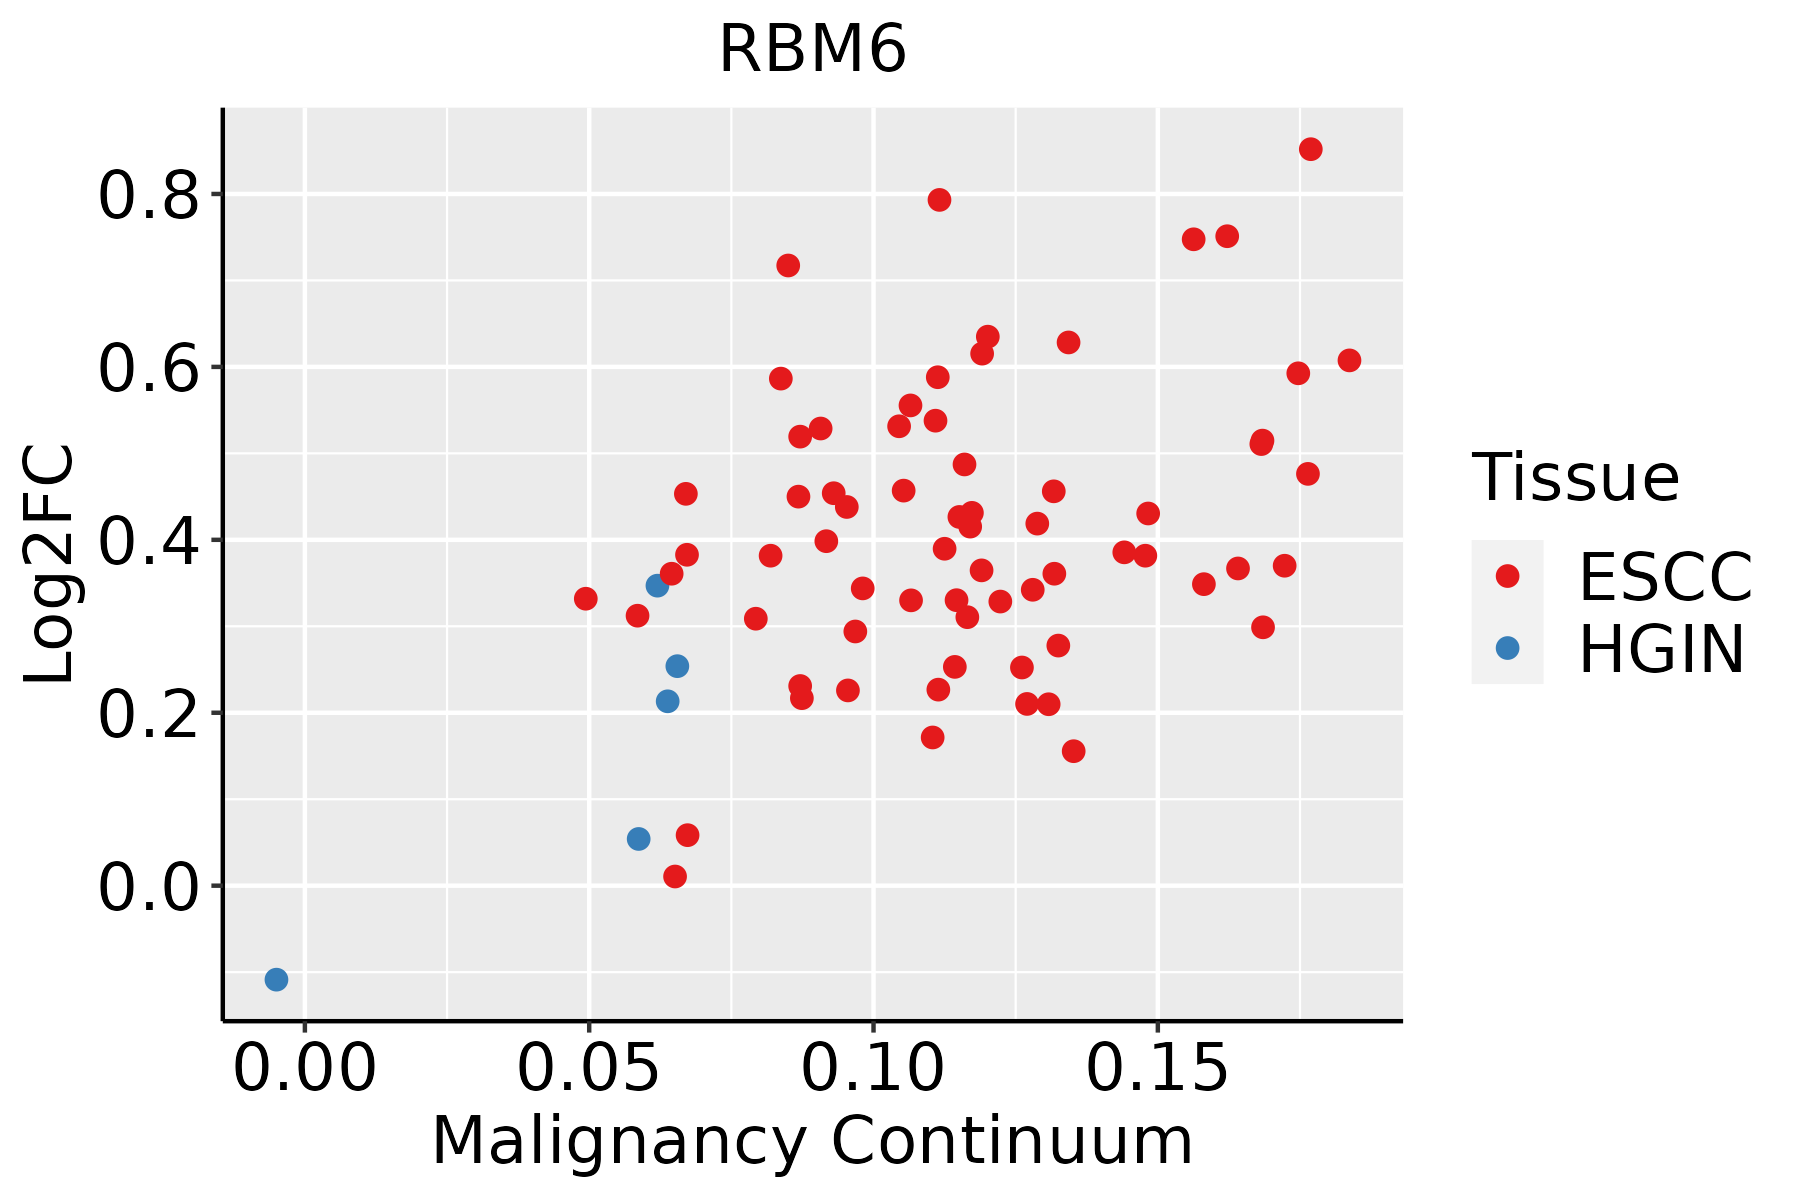 | ESCC: Esophageal squamous cell carcinoma |
| HGIN: High-grade intraepithelial neoplasias |
| LGIN: Low-grade intraepithelial neoplasias |
| Liver |  | HCC: Hepatocellular carcinoma |
| NAFLD: Non-alcoholic fatty liver disease |
| Lung | 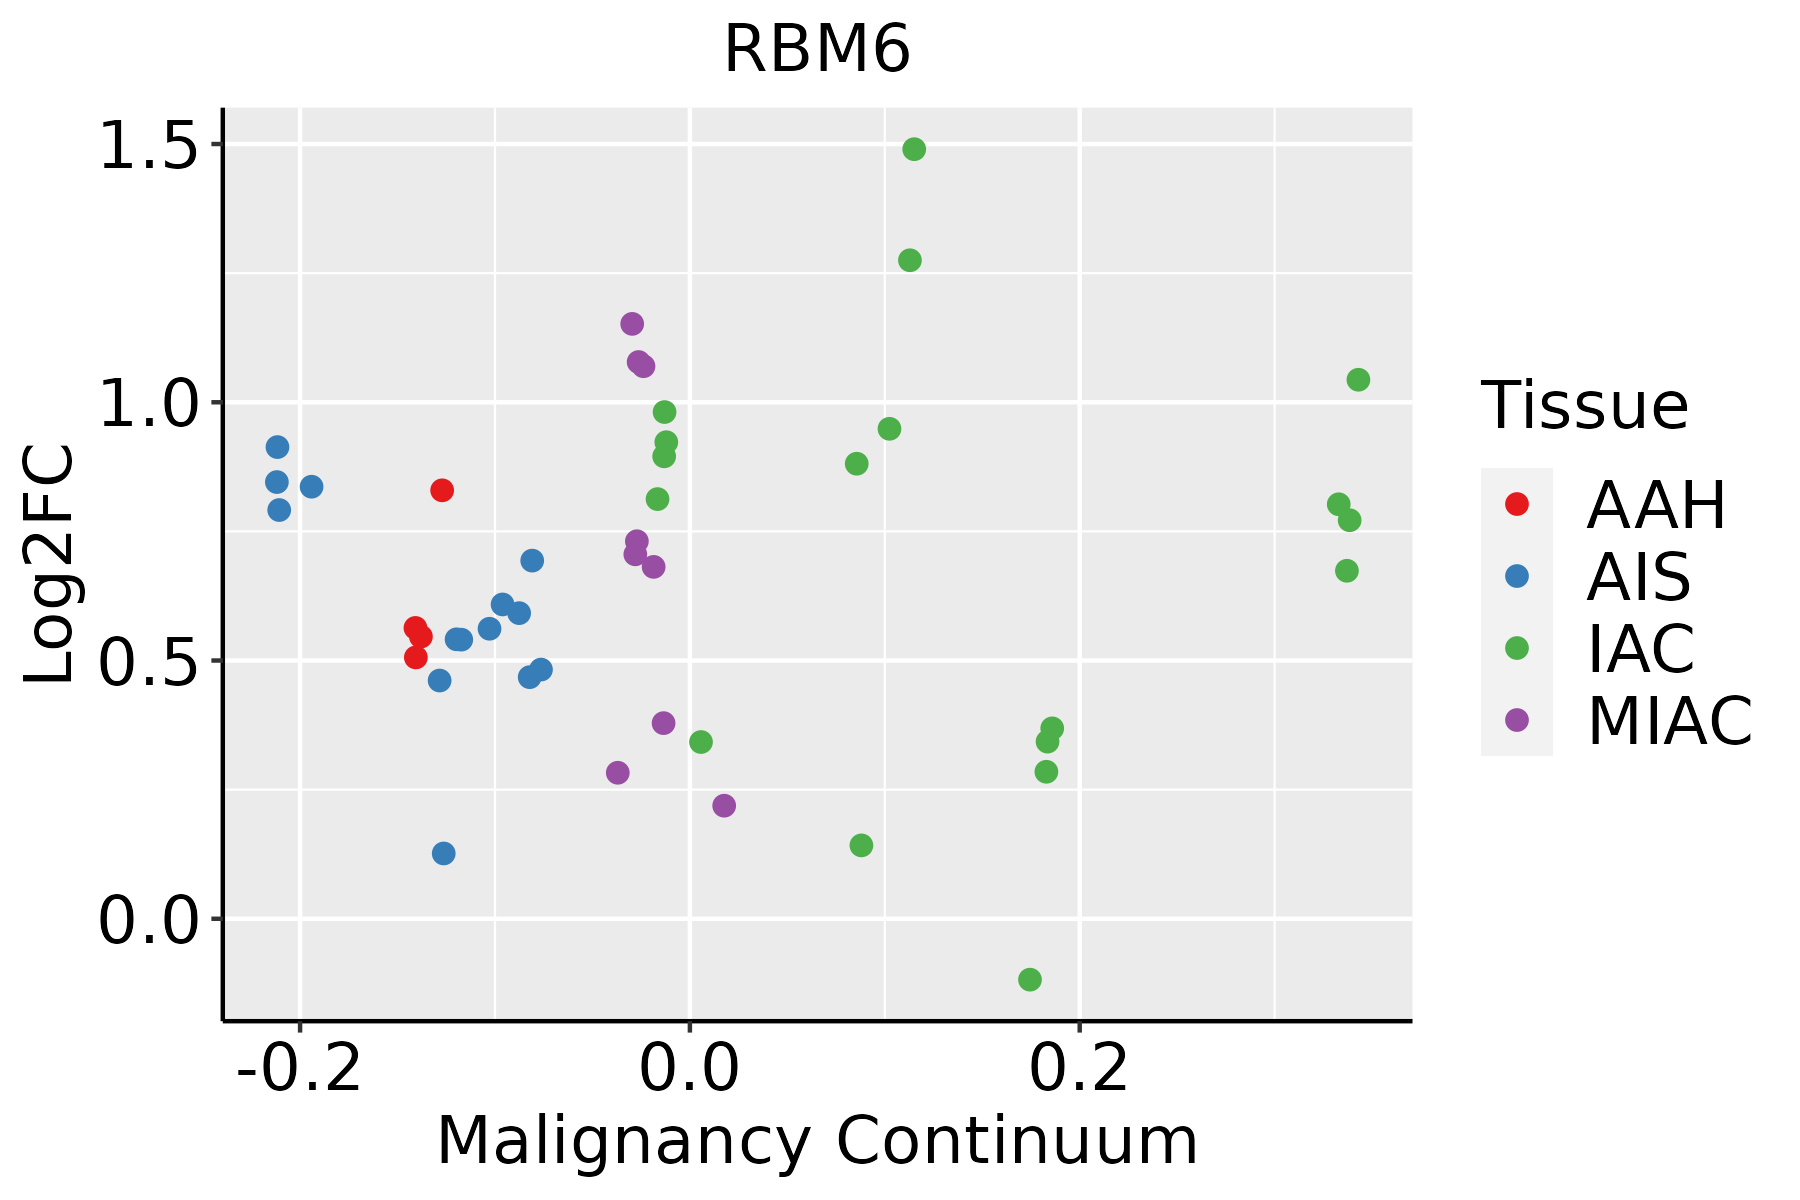 | AAH: Atypical adenomatous hyperplasia |
| AIS: Adenocarcinoma in situ |
| IAC: Invasive lung adenocarcinoma |
| MIA: Minimally invasive adenocarcinoma |
| Oral Cavity | 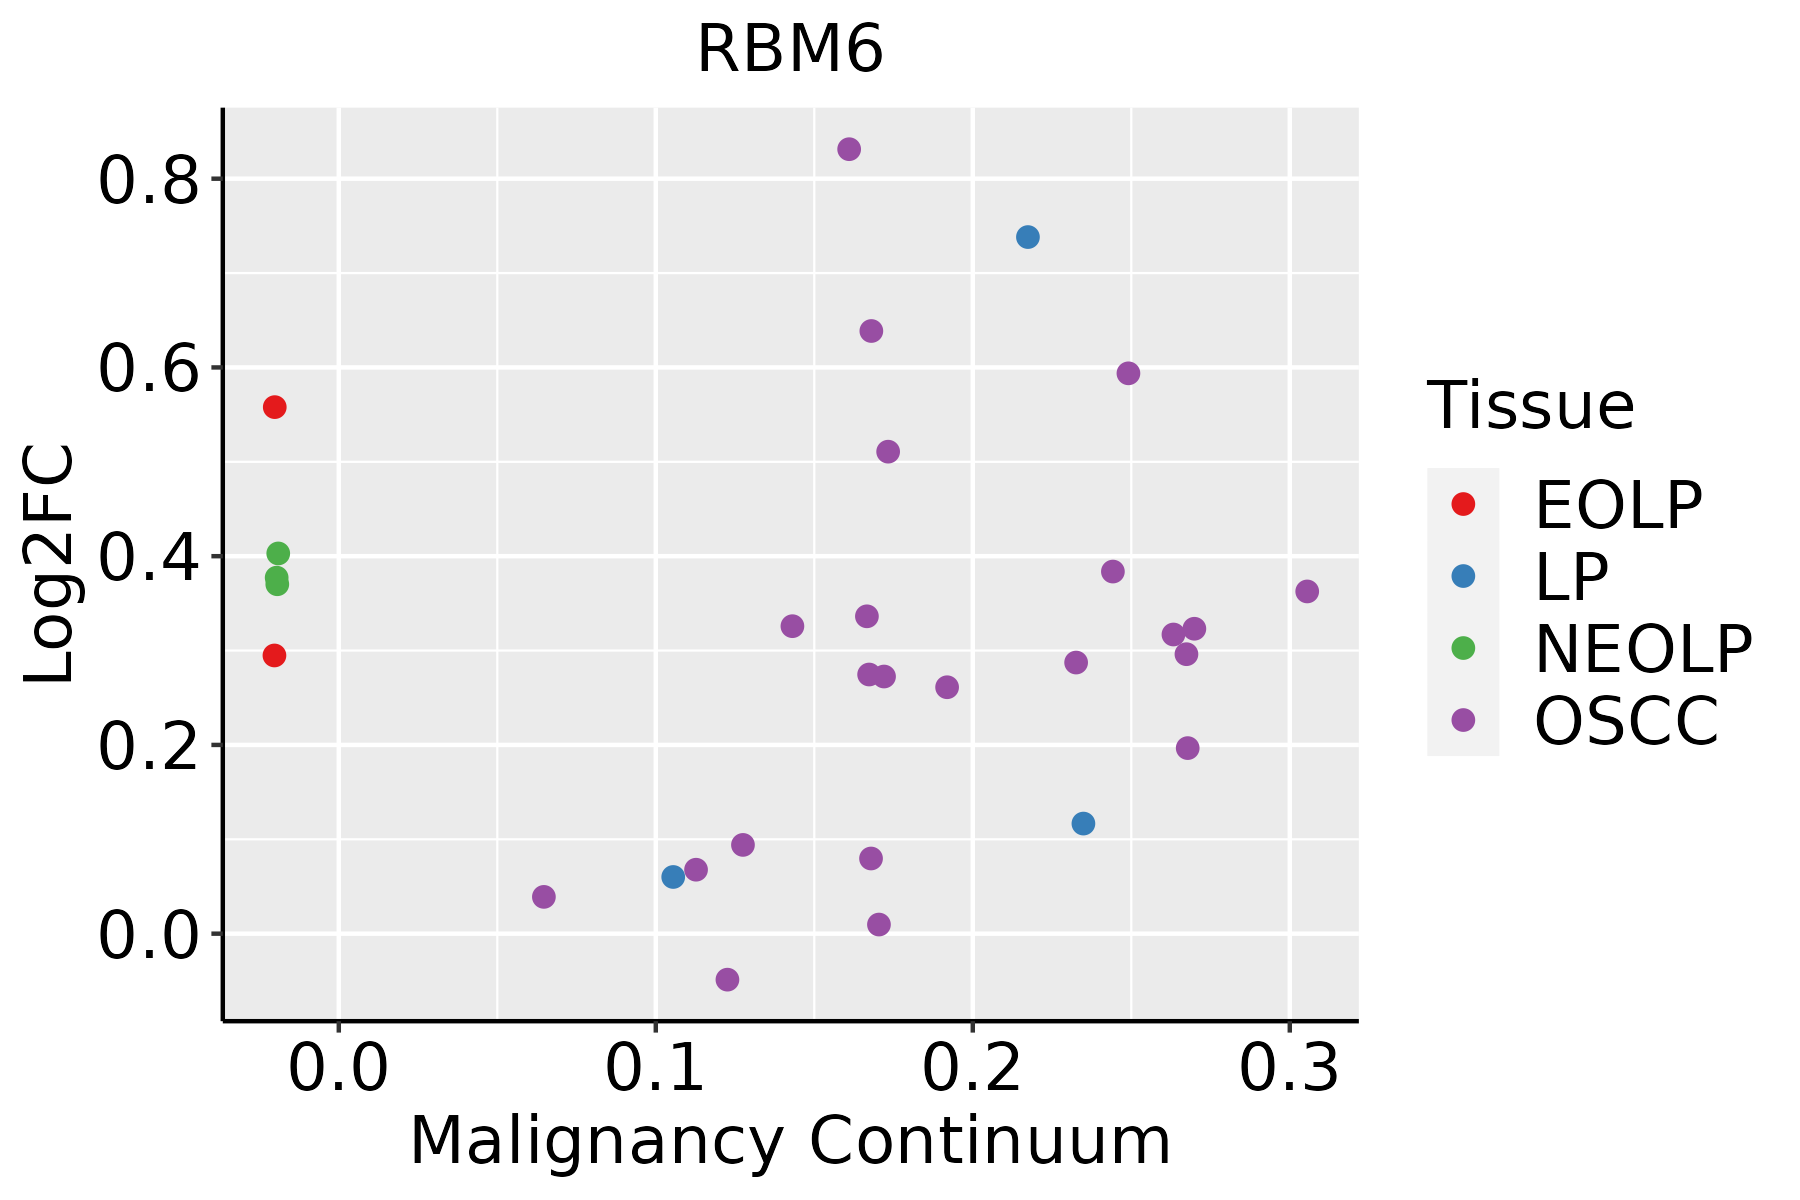 | EOLP: Erosive Oral lichen planus |
| LP: leukoplakia |
| NEOLP: Non-erosive oral lichen planus |
| OSCC: Oral squamous cell carcinoma |
| Prostate |  | BPH: Benign Prostatic Hyperplasia |
| Thyroid | 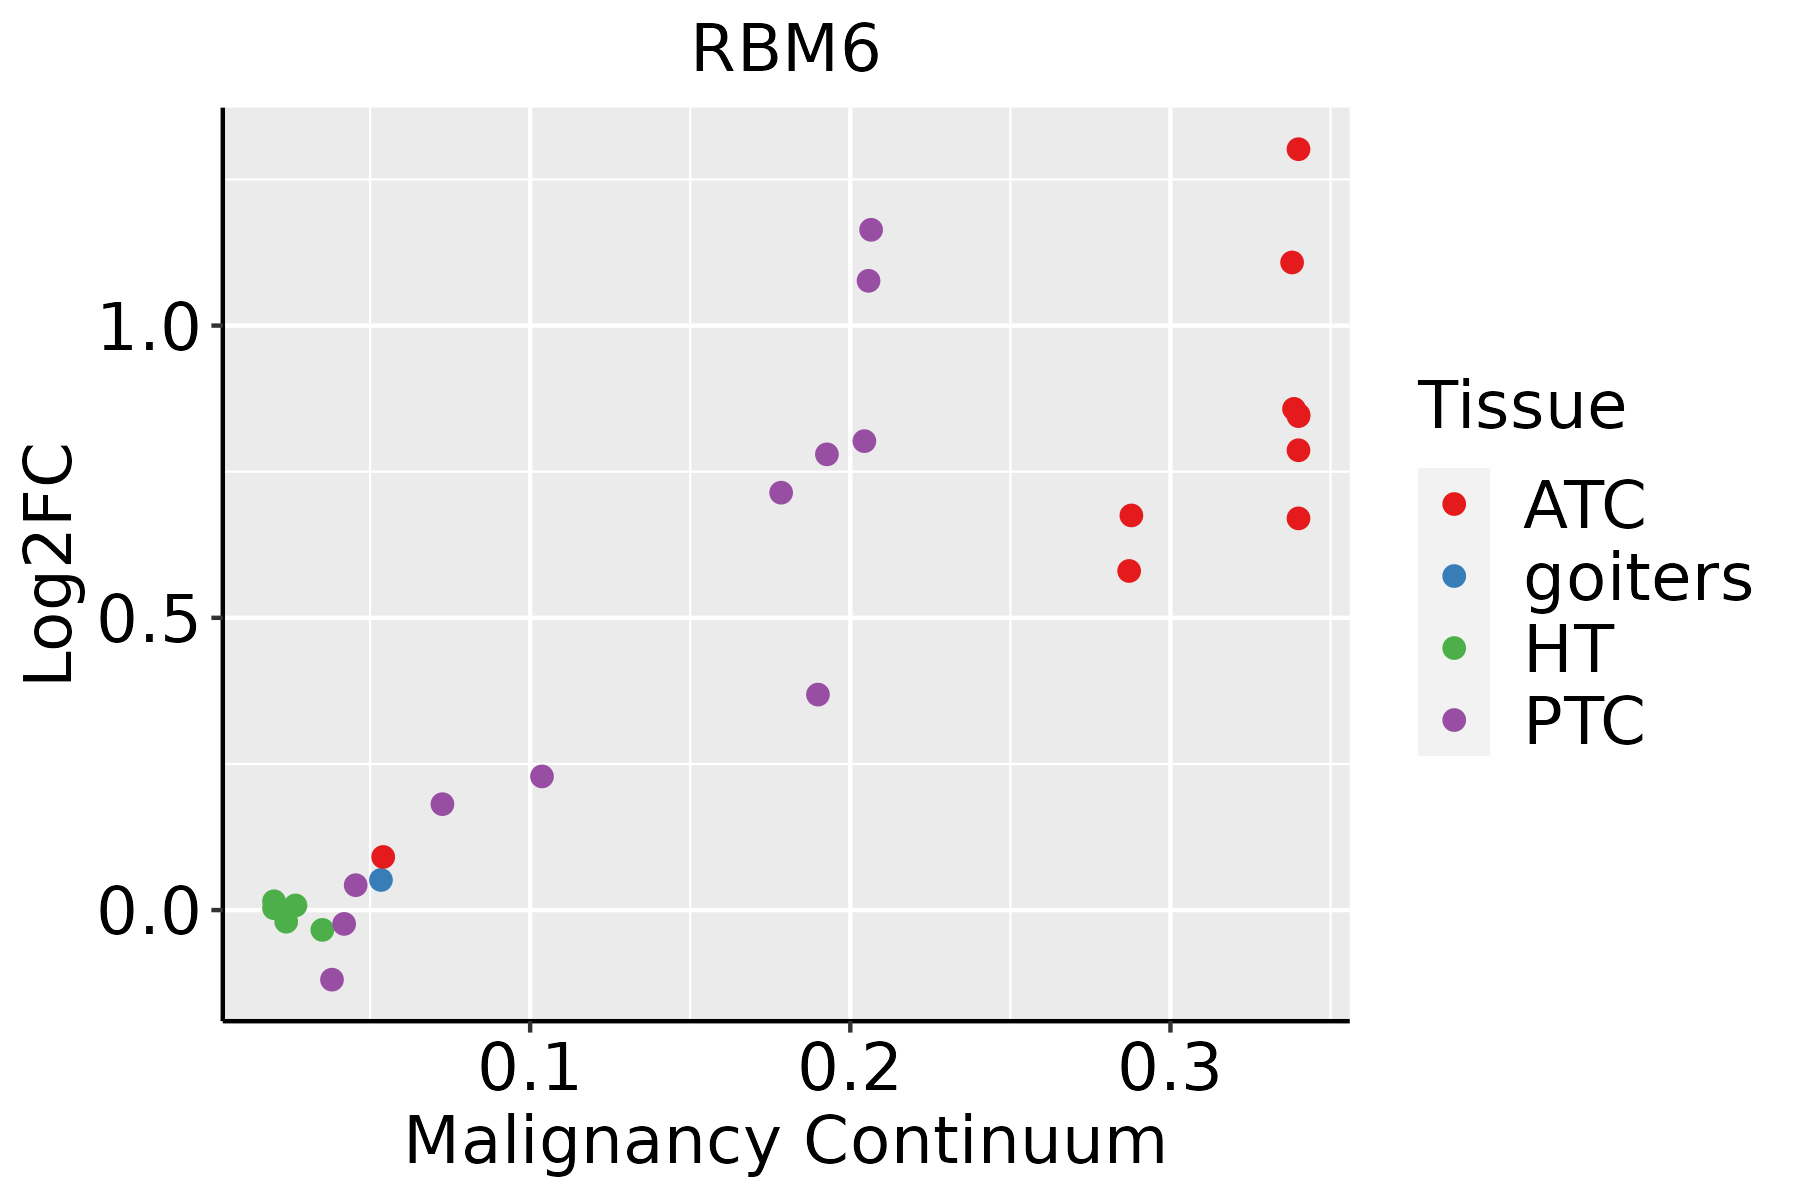 | ATC: Anaplastic thyroid cancer |
| HT: Hashimoto's thyroiditis |
| PTC: Papillary thyroid cancer |
| GO ID | Tissue | Disease Stage | Description | Gene Ratio | Bg Ratio | pvalue | p.adjust | Count |
| GO:0008380 | Colorectum | AD | RNA splicing | 169/3918 | 434/18723 | 3.59e-18 | 2.04e-15 | 169 |
| GO:0000377 | Colorectum | AD | RNA splicing, via transesterification reactions with bulged adenosine as nucleophile | 130/3918 | 320/18723 | 5.88e-16 | 2.16e-13 | 130 |
| GO:0000398 | Colorectum | AD | mRNA splicing, via spliceosome | 130/3918 | 320/18723 | 5.88e-16 | 2.16e-13 | 130 |
| GO:0000375 | Colorectum | AD | RNA splicing, via transesterification reactions | 131/3918 | 324/18723 | 7.11e-16 | 2.22e-13 | 131 |
| GO:00083802 | Colorectum | MSS | RNA splicing | 159/3467 | 434/18723 | 1.75e-19 | 1.22e-16 | 159 |
| GO:00003772 | Colorectum | MSS | RNA splicing, via transesterification reactions with bulged adenosine as nucleophile | 121/3467 | 320/18723 | 2.52e-16 | 8.27e-14 | 121 |
| GO:00003982 | Colorectum | MSS | mRNA splicing, via spliceosome | 121/3467 | 320/18723 | 2.52e-16 | 8.27e-14 | 121 |
| GO:00003752 | Colorectum | MSS | RNA splicing, via transesterification reactions | 122/3467 | 324/18723 | 2.75e-16 | 8.58e-14 | 122 |
| GO:00083803 | Colorectum | MSI-H | RNA splicing | 82/1319 | 434/18723 | 1.22e-16 | 4.53e-14 | 82 |
| GO:00003753 | Colorectum | MSI-H | RNA splicing, via transesterification reactions | 67/1319 | 324/18723 | 7.99e-16 | 2.61e-13 | 67 |
| GO:00003773 | Colorectum | MSI-H | RNA splicing, via transesterification reactions with bulged adenosine as nucleophile | 66/1319 | 320/18723 | 1.51e-15 | 4.41e-13 | 66 |
| GO:00003983 | Colorectum | MSI-H | mRNA splicing, via spliceosome | 66/1319 | 320/18723 | 1.51e-15 | 4.41e-13 | 66 |
| GO:00083804 | Colorectum | FAP | RNA splicing | 108/2622 | 434/18723 | 7.90e-10 | 1.86e-07 | 108 |
| GO:00003754 | Colorectum | FAP | RNA splicing, via transesterification reactions | 84/2622 | 324/18723 | 8.06e-09 | 1.10e-06 | 84 |
| GO:00003774 | Colorectum | FAP | RNA splicing, via transesterification reactions with bulged adenosine as nucleophile | 83/2622 | 320/18723 | 9.66e-09 | 1.23e-06 | 83 |
| GO:00003984 | Colorectum | FAP | mRNA splicing, via spliceosome | 83/2622 | 320/18723 | 9.66e-09 | 1.23e-06 | 83 |
| GO:00083805 | Colorectum | CRC | RNA splicing | 90/2078 | 434/18723 | 2.80e-09 | 7.97e-07 | 90 |
| GO:00003775 | Colorectum | CRC | RNA splicing, via transesterification reactions with bulged adenosine as nucleophile | 66/2078 | 320/18723 | 4.39e-07 | 3.37e-05 | 66 |
| GO:00003985 | Colorectum | CRC | mRNA splicing, via spliceosome | 66/2078 | 320/18723 | 4.39e-07 | 3.37e-05 | 66 |
| GO:00003755 | Colorectum | CRC | RNA splicing, via transesterification reactions | 66/2078 | 324/18723 | 7.00e-07 | 4.61e-05 | 66 |
| Hugo Symbol | Variant Class | Variant Classification | dbSNP RS | HGVSc | HGVSp | HGVSp Short | SWISSPROT | BIOTYPE | SIFT | PolyPhen | Tumor Sample Barcode | Tissue | Histology | Sex | Age | Stage | Therapy Types | Drugs | Outcome |
| RBM6 | SNV | Missense_Mutation | | c.1528N>C | p.Asp510His | p.D510H | P78332 | protein_coding | deleterious(0) | possibly_damaging(0.823) | TCGA-A1-A0SI-01 | Breast | breast invasive carcinoma | Female | <65 | I/II | Unknown | Unknown | SD |
| RBM6 | SNV | Missense_Mutation | novel | c.2317N>C | p.Asp773His | p.D773H | P78332 | protein_coding | tolerated(0.13) | possibly_damaging(0.781) | TCGA-A7-A56D-01 | Breast | breast invasive carcinoma | Female | >=65 | I/II | Hormone Therapy | arimidex | SD |
| RBM6 | SNV | Missense_Mutation | | c.2036N>G | p.Tyr679Cys | p.Y679C | P78332 | protein_coding | deleterious(0) | benign(0.011) | TCGA-AR-A1AS-01 | Breast | breast invasive carcinoma | Female | <65 | I/II | Chemotherapy | doxorubicin | SD |
| RBM6 | SNV | Missense_Mutation | novel | c.3182N>T | p.Ala1061Val | p.A1061V | P78332 | protein_coding | tolerated(0.06) | benign(0.119) | TCGA-BH-A0HF-01 | Breast | breast invasive carcinoma | Female | >=65 | I/II | Hormone Therapy | arimidex | SD |
| RBM6 | SNV | Missense_Mutation | rs748990943 | c.1674C>G | p.Phe558Leu | p.F558L | P78332 | protein_coding | tolerated(0.29) | benign(0) | TCGA-BH-A0W7-01 | Breast | breast invasive carcinoma | Female | <65 | I/II | Chemotherapy | taxotere | CR |
| RBM6 | SNV | Missense_Mutation | rs746775897 | c.182N>T | p.Ser61Leu | p.S61L | P78332 | protein_coding | tolerated_low_confidence(0.11) | benign(0.041) | TCGA-D8-A147-01 | Breast | breast invasive carcinoma | Female | <65 | I/II | Chemotherapy | doxorubicine | SD |
| RBM6 | SNV | Missense_Mutation | | c.1644N>G | p.Asn548Lys | p.N548K | P78332 | protein_coding | tolerated(0.91) | benign(0.006) | TCGA-D8-A1JC-01 | Breast | breast invasive carcinoma | Female | <65 | III/IV | Chemotherapy | adriamycin | SD |
| RBM6 | SNV | Missense_Mutation | | c.2773N>G | p.Pro925Ala | p.P925A | P78332 | protein_coding | tolerated(0.11) | benign(0.138) | TCGA-D8-A27G-01 | Breast | breast invasive carcinoma | Female | >=65 | I/II | Unknown | Unknown | SD |
| RBM6 | SNV | Missense_Mutation | | c.799C>A | p.Gln267Lys | p.Q267K | P78332 | protein_coding | tolerated(0.41) | probably_damaging(0.952) | TCGA-E2-A14Z-01 | Breast | breast invasive carcinoma | Female | <65 | I/II | Hormone Therapy | arimidex | PD |
| RBM6 | SNV | Missense_Mutation | novel | c.280N>A | p.Asp94Asn | p.D94N | P78332 | protein_coding | deleterious_low_confidence(0.01) | benign(0.023) | TCGA-GM-A2DO-01 | Breast | breast invasive carcinoma | Female | <65 | I/II | Hormone Therapy | tamoxiphen | CR |


