
|
|||||
|
 | |
| |
| |
| |
| |
| |
|
Gene: RAPGEF5 |
Gene summary for RAPGEF5 |
| Gene information | Species | Human | Gene symbol | RAPGEF5 | Gene ID | 9771 |
| Gene name | Rap guanine nucleotide exchange factor 5 | |
| Gene Alias | GFR | |
| Cytomap | 7p15.3 | |
| Gene Type | protein-coding | GO ID | GO:0007154 | UniProtAcc | A8MQ07 |
Top |
Malignant transformation analysis |
| Identification of the aberrant gene expression in precancerous and cancerous lesions by comparing the gene expression of stem-like cells in diseased tissues with normal stem cells |
| Entrez ID | Symbol | Replicates | Species | Organ | Tissue | Adj P-value | Log2FC | Malignancy |
| 9771 | RAPGEF5 | F034 | Human | Colorectum | FAP | 1.98e-34 | -5.65e-01 | -0.0665 |
| 9771 | RAPGEF5 | F072B | Human | Colorectum | FAP | 7.27e-03 | 6.97e-02 | 0.257 |
| 9771 | RAPGEF5 | CRC-1-8810 | Human | Colorectum | CRC | 9.79e-04 | -2.82e-01 | 0.6257 |
| 9771 | RAPGEF5 | CRC-3-11773 | Human | Colorectum | CRC | 1.63e-04 | -2.58e-01 | 0.2564 |
| 9771 | RAPGEF5 | NAFLD1 | Human | Liver | NAFLD | 4.03e-06 | 9.09e-01 | -0.04 |
| 9771 | RAPGEF5 | HCC1_Meng | Human | Liver | HCC | 5.14e-34 | -2.13e-01 | 0.0246 |
| 9771 | RAPGEF5 | HCC2_Meng | Human | Liver | HCC | 2.52e-13 | -1.69e-01 | 0.0107 |
| 9771 | RAPGEF5 | cirrhotic2 | Human | Liver | Cirrhotic | 5.13e-03 | -1.34e-01 | 0.0201 |
| 9771 | RAPGEF5 | Pt13.a | Human | Liver | HCC | 9.12e-05 | -2.60e-01 | 0.021 |
| 9771 | RAPGEF5 | Pt14.d | Human | Liver | HCC | 7.51e-04 | -2.64e-01 | 0.0143 |
| 9771 | RAPGEF5 | S016 | Human | Liver | HCC | 7.89e-03 | -2.95e-01 | 0.2243 |
| 9771 | RAPGEF5 | S027 | Human | Liver | HCC | 4.12e-04 | 7.44e-01 | 0.2446 |
| 9771 | RAPGEF5 | S028 | Human | Liver | HCC | 4.83e-14 | 8.48e-01 | 0.2503 |
| 9771 | RAPGEF5 | S029 | Human | Liver | HCC | 1.12e-07 | 6.32e-01 | 0.2581 |
| 9771 | RAPGEF5 | RNA-P17T-P17T-2 | Human | Lung | IAC | 1.80e-04 | 6.39e-01 | 0.3371 |
| 9771 | RAPGEF5 | RNA-P17T-P17T-8 | Human | Lung | IAC | 1.93e-02 | 4.97e-01 | 0.3329 |
| 9771 | RAPGEF5 | RNA-P23T2-P23T2-2 | Human | Lung | MIAC | 1.51e-02 | 1.07e+00 | -0.028 |
| 9771 | RAPGEF5 | RNA-P23T2-P23T2-4 | Human | Lung | MIAC | 3.49e-02 | 1.08e+00 | -0.0272 |
| 9771 | RAPGEF5 | RNA-P25T1-P25T1-1 | Human | Lung | AIS | 4.54e-24 | 1.11e+00 | -0.2116 |
| 9771 | RAPGEF5 | RNA-P25T1-P25T1-2 | Human | Lung | AIS | 1.92e-06 | 9.38e-01 | -0.1941 |
| Page: 1 2 3 4 |
| Tissue | Expression Dynamics | Abbreviation |
| Cervix | 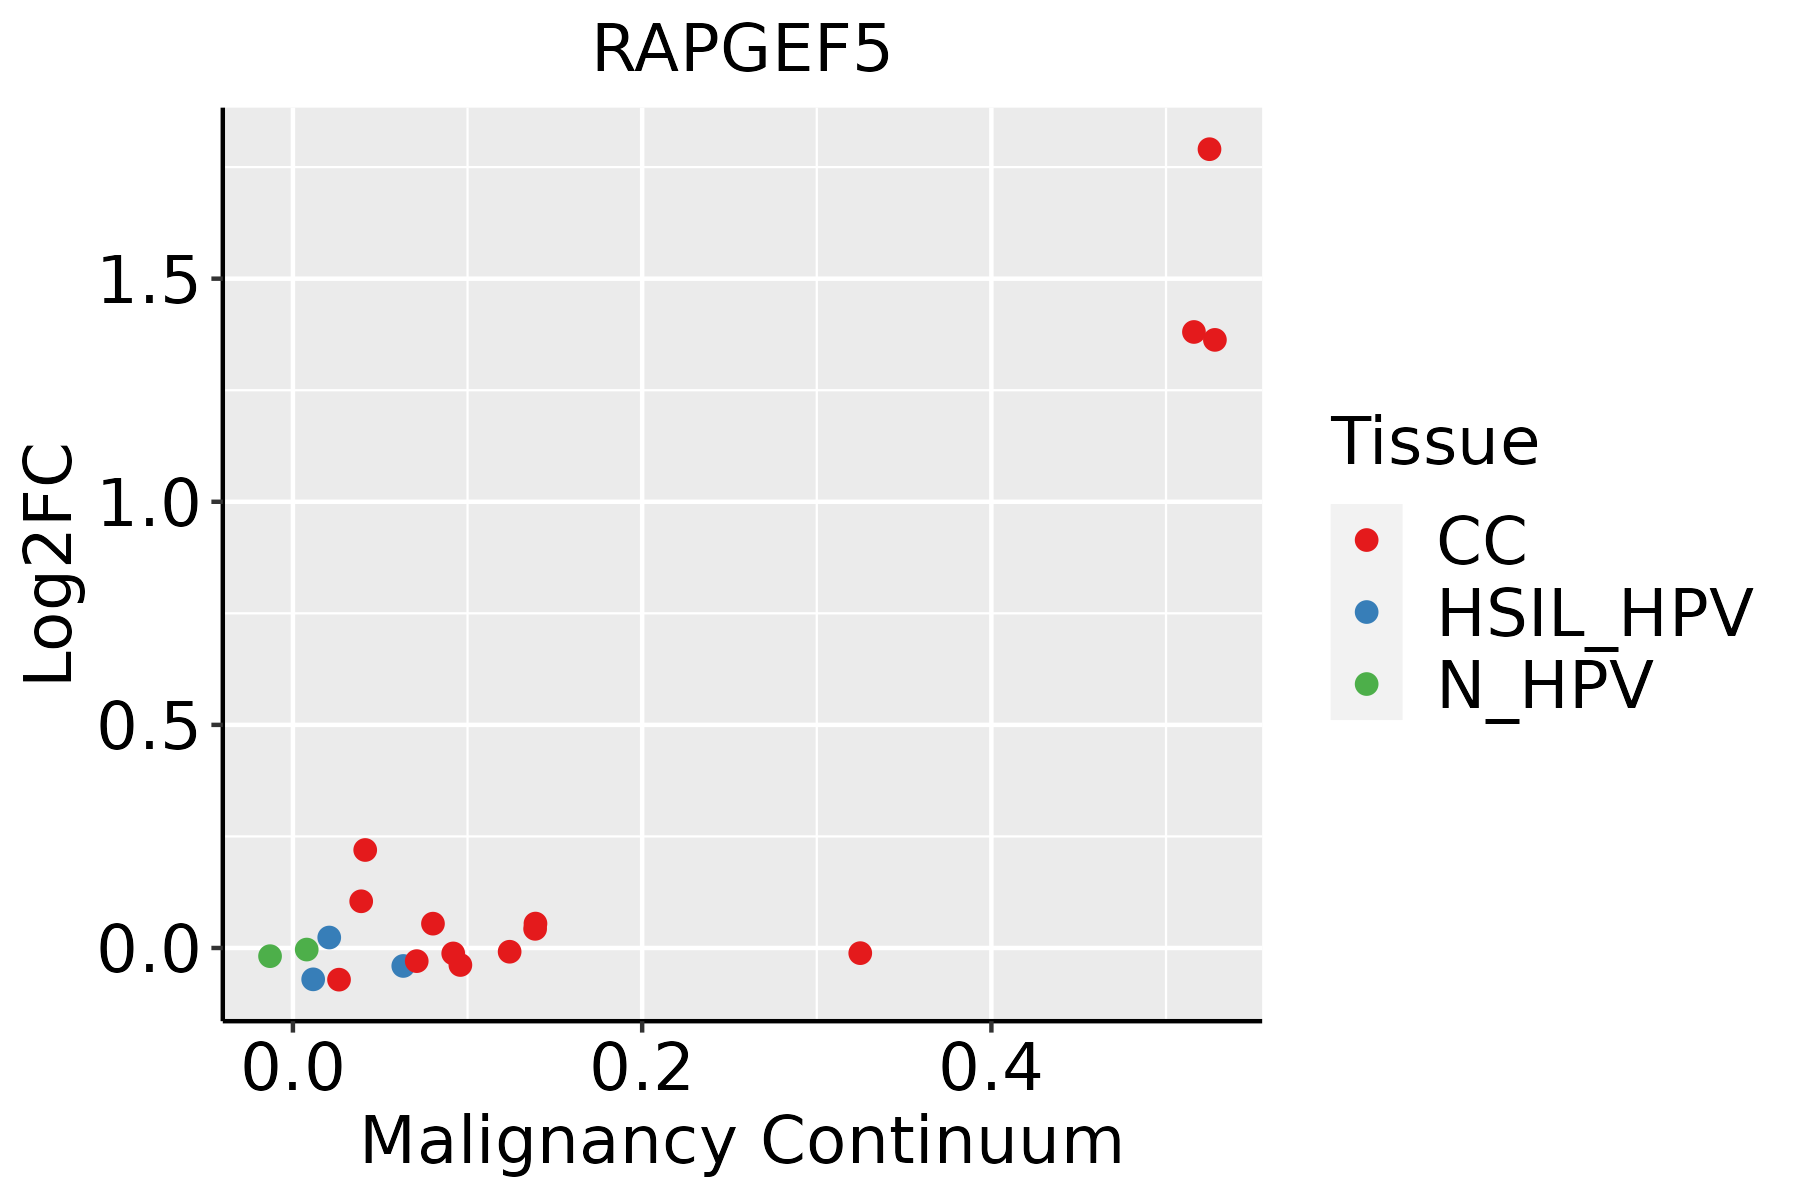 | CC: Cervix cancer |
| HSIL_HPV: HPV-infected high-grade squamous intraepithelial lesions | ||
| N_HPV: HPV-infected normal cervix | ||
| Colorectum (GSE201348) |  | FAP: Familial adenomatous polyposis |
| CRC: Colorectal cancer | ||
| Colorectum (HTA11) | 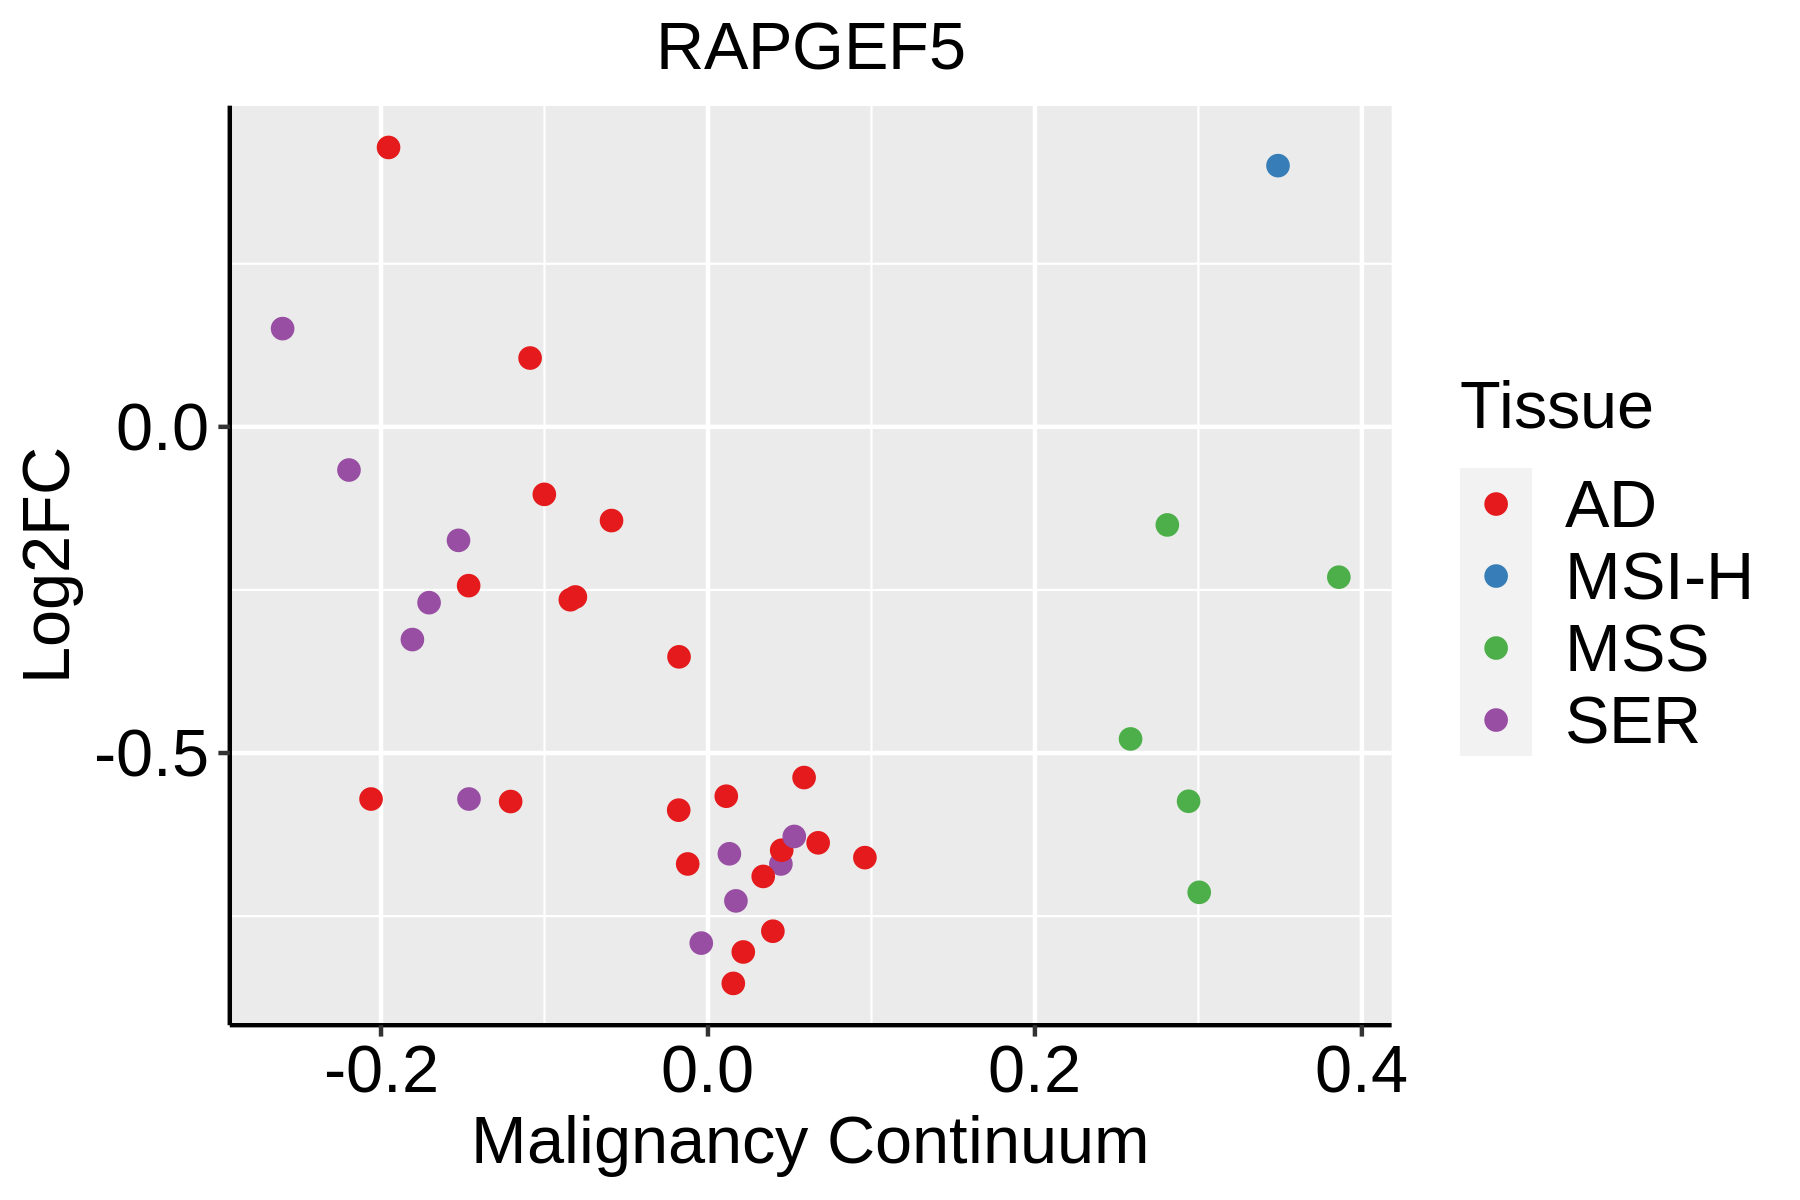 | AD: Adenomas |
| SER: Sessile serrated lesions | ||
| MSI-H: Microsatellite-high colorectal cancer | ||
| MSS: Microsatellite stable colorectal cancer | ||
| Liver |  | HCC: Hepatocellular carcinoma |
| NAFLD: Non-alcoholic fatty liver disease | ||
| Lung | 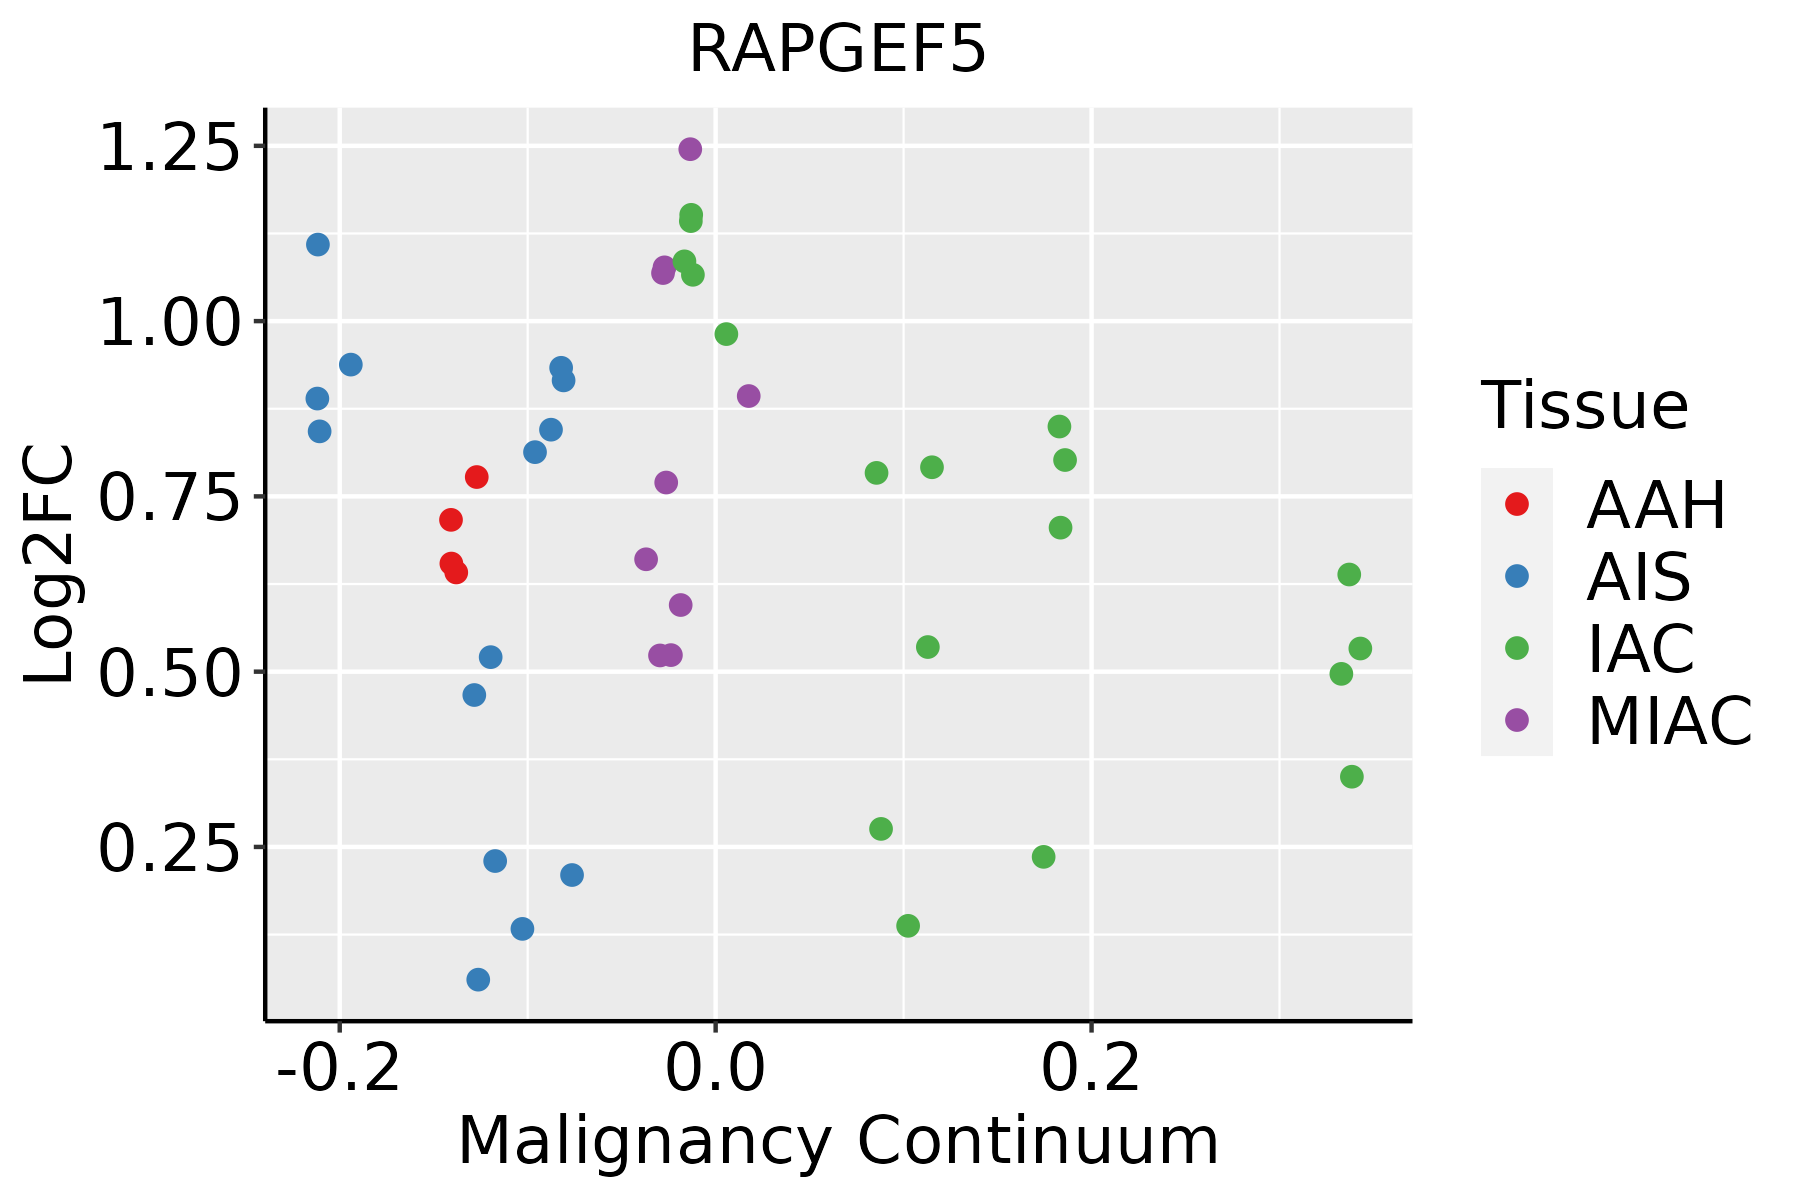 | AAH: Atypical adenomatous hyperplasia |
| AIS: Adenocarcinoma in situ | ||
| IAC: Invasive lung adenocarcinoma | ||
| MIA: Minimally invasive adenocarcinoma |
| ∗log2FC in expression of this searched gene in stem-like cells from each diseased tissue sample relative to stem-like cells in normal samples in each tissue plotted against the malignancy continuum. Samples are colored based on if they are from different disease stage. |
Top |
Malignant transformation related pathway analysis |
| Find out the enriched GO biological processes and KEGG pathways involved in transition from healthy to precancer to cancer |
| Tissue | Disease Stage | Enriched GO biological Processes |
| Colorectum | AD |  |
| Colorectum | SER |  |
| Colorectum | MSS |  |
| Colorectum | MSI-H |  |
| Colorectum | FAP |  |
| ∗Top 15 enriched GO BP terms are showed in the bar plot of each disease state in each tissue. Each row represents a significant GO biological process which is colored according to the -log10(p.adjust). |
| Page: 1 2 3 4 5 6 7 8 9 |
| GO ID | Tissue | Disease Stage | Description | Gene Ratio | Bg Ratio | pvalue | p.adjust | Count |
| Page: 1 |
| Pathway ID | Tissue | Disease Stage | Description | Gene Ratio | Bg Ratio | pvalue | p.adjust | qvalue | Count |
| hsa0401512 | Cervix | CC | Rap1 signaling pathway | 56/1267 | 210/8465 | 6.23e-06 | 5.61e-05 | 3.32e-05 | 56 |
| hsa040142 | Cervix | CC | Ras signaling pathway | 51/1267 | 236/8465 | 3.55e-03 | 1.34e-02 | 7.91e-03 | 51 |
| hsa0401513 | Cervix | CC | Rap1 signaling pathway | 56/1267 | 210/8465 | 6.23e-06 | 5.61e-05 | 3.32e-05 | 56 |
| hsa0401411 | Cervix | CC | Ras signaling pathway | 51/1267 | 236/8465 | 3.55e-03 | 1.34e-02 | 7.91e-03 | 51 |
| hsa04015 | Colorectum | AD | Rap1 signaling pathway | 71/2092 | 210/8465 | 1.72e-03 | 9.68e-03 | 6.18e-03 | 71 |
| hsa040151 | Colorectum | AD | Rap1 signaling pathway | 71/2092 | 210/8465 | 1.72e-03 | 9.68e-03 | 6.18e-03 | 71 |
| hsa040152 | Colorectum | SER | Rap1 signaling pathway | 54/1580 | 210/8465 | 6.55e-03 | 3.68e-02 | 2.67e-02 | 54 |
| hsa040153 | Colorectum | SER | Rap1 signaling pathway | 54/1580 | 210/8465 | 6.55e-03 | 3.68e-02 | 2.67e-02 | 54 |
| hsa040154 | Colorectum | MSS | Rap1 signaling pathway | 66/1875 | 210/8465 | 1.03e-03 | 5.94e-03 | 3.64e-03 | 66 |
| hsa040155 | Colorectum | MSS | Rap1 signaling pathway | 66/1875 | 210/8465 | 1.03e-03 | 5.94e-03 | 3.64e-03 | 66 |
| hsa040156 | Colorectum | FAP | Rap1 signaling pathway | 53/1404 | 210/8465 | 7.93e-04 | 5.14e-03 | 3.13e-03 | 53 |
| hsa040157 | Colorectum | FAP | Rap1 signaling pathway | 53/1404 | 210/8465 | 7.93e-04 | 5.14e-03 | 3.13e-03 | 53 |
| hsa040158 | Colorectum | CRC | Rap1 signaling pathway | 48/1091 | 210/8465 | 4.00e-05 | 8.70e-04 | 5.90e-04 | 48 |
| hsa04014 | Colorectum | CRC | Ras signaling pathway | 49/1091 | 236/8465 | 4.04e-04 | 4.50e-03 | 3.05e-03 | 49 |
| hsa040159 | Colorectum | CRC | Rap1 signaling pathway | 48/1091 | 210/8465 | 4.00e-05 | 8.70e-04 | 5.90e-04 | 48 |
| hsa040141 | Colorectum | CRC | Ras signaling pathway | 49/1091 | 236/8465 | 4.04e-04 | 4.50e-03 | 3.05e-03 | 49 |
| hsa0401510 | Lung | IAC | Rap1 signaling pathway | 41/1053 | 210/8465 | 2.01e-03 | 1.07e-02 | 7.10e-03 | 41 |
| hsa0401511 | Lung | IAC | Rap1 signaling pathway | 41/1053 | 210/8465 | 2.01e-03 | 1.07e-02 | 7.10e-03 | 41 |
| hsa0401521 | Lung | AIS | Rap1 signaling pathway | 41/961 | 210/8465 | 3.23e-04 | 3.38e-03 | 2.16e-03 | 41 |
| hsa0401531 | Lung | AIS | Rap1 signaling pathway | 41/961 | 210/8465 | 3.23e-04 | 3.38e-03 | 2.16e-03 | 41 |
| Page: 1 2 |
Top |
Cell-cell communication analysis |
| Identification of potential cell-cell interactions between two cell types and their ligand-receptor pairs for different disease states |
| Ligand | Receptor | LRpair | Pathway | Tissue | Disease Stage |
| Page: 1 |
Top |
Single-cell gene regulatory network inference analysis |
| Find out the significant the regulons (TFs) and the target genes of each regulon across cell types for different disease states |
| TF | Cell Type | Tissue | Disease Stage | Target Gene | RSS | Regulon Activity |
| ∗The dot plots of a searched regulon are shown for all cell subpopulations in each disease state of each tissue based on the regulon specific score inferred using pySCENIC and by calculating the average expression. |
| Page: 1 |
Top |
Somatic mutation of malignant transformation related genes |
| Annotation of somatic variants for genes involved in malignant transformation |
| Hugo Symbol | Variant Class | Variant Classification | dbSNP RS | HGVSc | HGVSp | HGVSp Short | SWISSPROT | BIOTYPE | SIFT | PolyPhen | Tumor Sample Barcode | Tissue | Histology | Sex | Age | Stage | Therapy Types | Drugs | Outcome |
| RAPGEF5 | SNV | Missense_Mutation | novel | c.1378G>T | p.Ala460Ser | p.A460S | protein_coding | tolerated(0.84) | benign(0.003) | TCGA-AN-A046-01 | Breast | breast invasive carcinoma | Female | >=65 | I/II | Unknown | Unknown | SD | |
| RAPGEF5 | SNV | Missense_Mutation | novel | c.1066C>T | p.His356Tyr | p.H356Y | protein_coding | tolerated(0.3) | probably_damaging(0.937) | TCGA-AR-A2LE-01 | Breast | breast invasive carcinoma | Female | >=65 | I/II | Hormone Therapy | tamoxiphen | PD | |
| RAPGEF5 | SNV | Missense_Mutation | novel | c.2141N>C | p.Asp714Ala | p.D714A | protein_coding | deleterious(0) | possibly_damaging(0.859) | TCGA-D8-A1XQ-01 | Breast | breast invasive carcinoma | Female | >=65 | I/II | Unknown | Unknown | SD | |
| RAPGEF5 | SNV | Missense_Mutation | novel | c.234A>C | p.Lys78Asn | p.K78N | protein_coding | deleterious(0.01) | possibly_damaging(0.609) | TCGA-E2-A150-01 | Breast | breast invasive carcinoma | Female | <65 | I/II | Chemotherapy | doxorubicin | SD | |
| RAPGEF5 | deletion | In_Frame_Del | c.1411_1419delNNNNNNNNN | p.Leu471_Asp473del | p.L471_D473del | protein_coding | TCGA-AR-A24H-01 | Breast | breast invasive carcinoma | Female | >=65 | I/II | Hormone Therapy | tamoxiphen | SD | ||||
| RAPGEF5 | SNV | Missense_Mutation | novel | c.1991T>G | p.Phe664Cys | p.F664C | protein_coding | deleterious(0.02) | probably_damaging(0.998) | TCGA-2W-A8YY-01 | Cervix | cervical & endocervical cancer | Female | <65 | I/II | Chemotherapy | cisplatin | CR | |
| RAPGEF5 | SNV | Missense_Mutation | novel | c.332A>C | p.Lys111Thr | p.K111T | protein_coding | tolerated(0.22) | benign(0.158) | TCGA-2W-A8YY-01 | Cervix | cervical & endocervical cancer | Female | <65 | I/II | Chemotherapy | cisplatin | CR | |
| RAPGEF5 | SNV | Missense_Mutation | c.496T>G | p.Phe166Val | p.F166V | protein_coding | deleterious(0.02) | benign(0.011) | TCGA-AA-3692-01 | Colorectum | colon adenocarcinoma | Female | <65 | III/IV | Chemotherapy | folinic | PD | ||
| RAPGEF5 | SNV | Missense_Mutation | rs768637186 | c.455N>A | p.Arg152Gln | p.R152Q | protein_coding | deleterious(0.03) | probably_damaging(0.92) | TCGA-AA-A00N-01 | Colorectum | colon adenocarcinoma | Male | >=65 | I/II | Unknown | Unknown | PD | |
| RAPGEF5 | SNV | Missense_Mutation | rs557224504 | c.506C>T | p.Thr169Met | p.T169M | protein_coding | deleterious(0.01) | benign(0.046) | TCGA-AA-A01I-01 | Colorectum | colon adenocarcinoma | Male | >=65 | I/II | Unknown | Unknown | SD |
| Page: 1 2 3 4 5 6 7 |
Top |
Related drugs of malignant transformation related genes |
| Identification of chemicals and drugs interact with genes involved in malignant transfromation |
| (DGIdb 4.0) |
| Entrez ID | Symbol | Category | Interaction Types | Drug Claim Name | Drug Name | PMIDs |
| 9771 | RAPGEF5 | NA | antidepressants |
| Page: 1 |

Copyright 2023-Present -The University of Texas Health Science Center at Houston |