
|
|||||
|
 | |
| |
| |
| |
| |
| |
|
Gene: RANBP9 |
Gene summary for RANBP9 |
| Gene information | Species | Human | Gene symbol | RANBP9 | Gene ID | 10048 |
| Gene name | RAN binding protein 9 | |
| Gene Alias | BPM-L | |
| Cytomap | 6p23 | |
| Gene Type | protein-coding | GO ID | GO:0000165 | UniProtAcc | A0A024QZW3 |
Top |
Malignant transformation analysis |
| Identification of the aberrant gene expression in precancerous and cancerous lesions by comparing the gene expression of stem-like cells in diseased tissues with normal stem cells |
| Entrez ID | Symbol | Replicates | Species | Organ | Tissue | Adj P-value | Log2FC | Malignancy |
| 10048 | RANBP9 | P31T-E | Human | Esophagus | ESCC | 2.90e-13 | 1.14e-01 | 0.1251 |
| 10048 | RANBP9 | P32T-E | Human | Esophagus | ESCC | 5.12e-08 | 6.16e-02 | 0.1666 |
| 10048 | RANBP9 | P36T-E | Human | Esophagus | ESCC | 9.27e-08 | 8.12e-02 | 0.1187 |
| 10048 | RANBP9 | P37T-E | Human | Esophagus | ESCC | 1.04e-04 | 5.75e-02 | 0.1371 |
| 10048 | RANBP9 | P39T-E | Human | Esophagus | ESCC | 2.36e-04 | -2.64e-02 | 0.0894 |
| 10048 | RANBP9 | P40T-E | Human | Esophagus | ESCC | 2.42e-05 | 5.59e-02 | 0.109 |
| 10048 | RANBP9 | P42T-E | Human | Esophagus | ESCC | 9.64e-09 | 4.21e-02 | 0.1175 |
| 10048 | RANBP9 | P44T-E | Human | Esophagus | ESCC | 1.36e-03 | 1.17e-02 | 0.1096 |
| 10048 | RANBP9 | P47T-E | Human | Esophagus | ESCC | 1.49e-07 | 9.65e-02 | 0.1067 |
| 10048 | RANBP9 | P48T-E | Human | Esophagus | ESCC | 7.02e-15 | 5.68e-02 | 0.0959 |
| 10048 | RANBP9 | P52T-E | Human | Esophagus | ESCC | 7.78e-12 | 6.04e-02 | 0.1555 |
| 10048 | RANBP9 | P54T-E | Human | Esophagus | ESCC | 1.18e-13 | 1.35e-01 | 0.0975 |
| 10048 | RANBP9 | P57T-E | Human | Esophagus | ESCC | 6.68e-08 | 4.09e-02 | 0.0926 |
| 10048 | RANBP9 | P61T-E | Human | Esophagus | ESCC | 6.27e-09 | 4.60e-02 | 0.099 |
| 10048 | RANBP9 | P62T-E | Human | Esophagus | ESCC | 3.90e-13 | 1.65e-01 | 0.1302 |
| 10048 | RANBP9 | P65T-E | Human | Esophagus | ESCC | 5.61e-04 | 1.10e-01 | 0.0978 |
| 10048 | RANBP9 | P74T-E | Human | Esophagus | ESCC | 2.23e-09 | 1.49e-01 | 0.1479 |
| 10048 | RANBP9 | P75T-E | Human | Esophagus | ESCC | 3.74e-21 | 1.37e-01 | 0.1125 |
| 10048 | RANBP9 | P76T-E | Human | Esophagus | ESCC | 6.91e-06 | -2.65e-03 | 0.1207 |
| 10048 | RANBP9 | P79T-E | Human | Esophagus | ESCC | 4.85e-11 | 3.42e-02 | 0.1154 |
| Page: 1 2 3 4 5 6 |
| Tissue | Expression Dynamics | Abbreviation |
| Cervix | 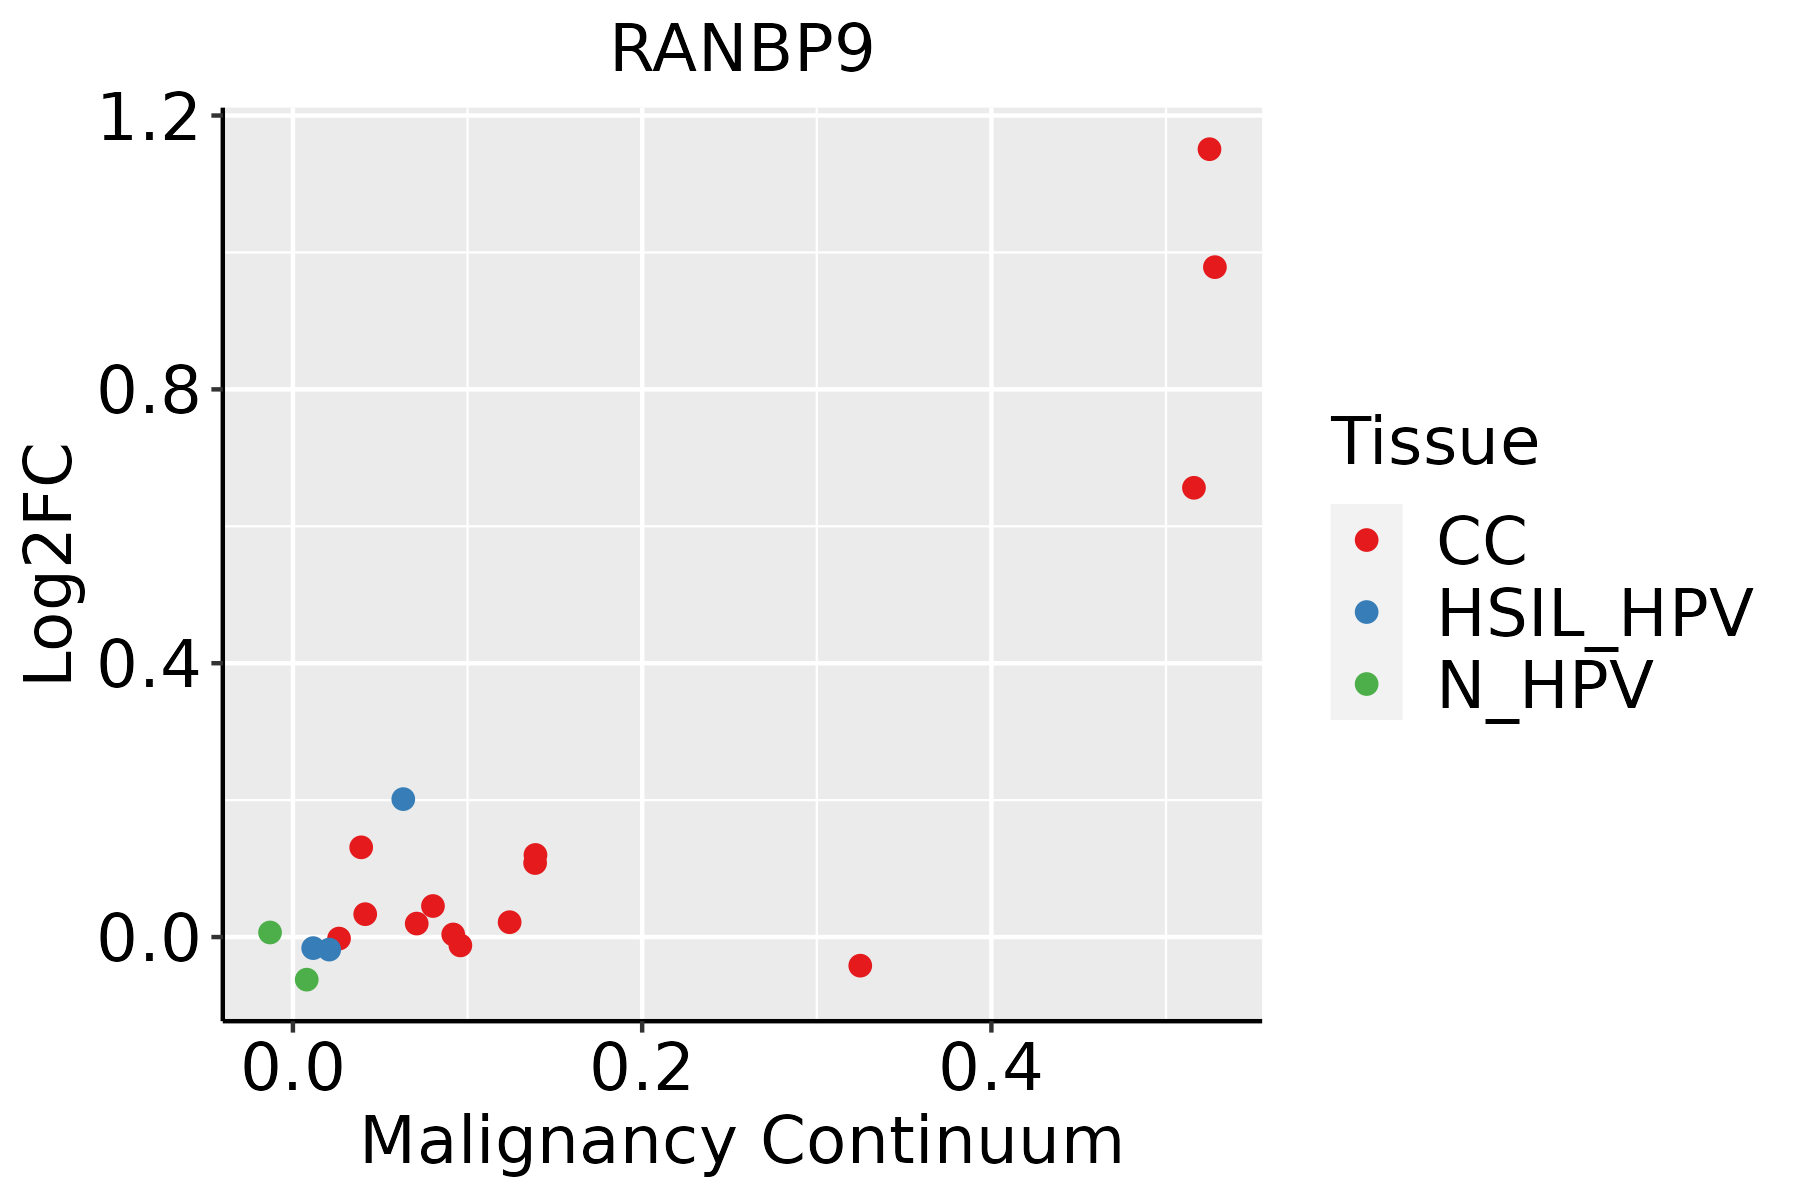 | CC: Cervix cancer |
| HSIL_HPV: HPV-infected high-grade squamous intraepithelial lesions | ||
| N_HPV: HPV-infected normal cervix | ||
| Endometrium | 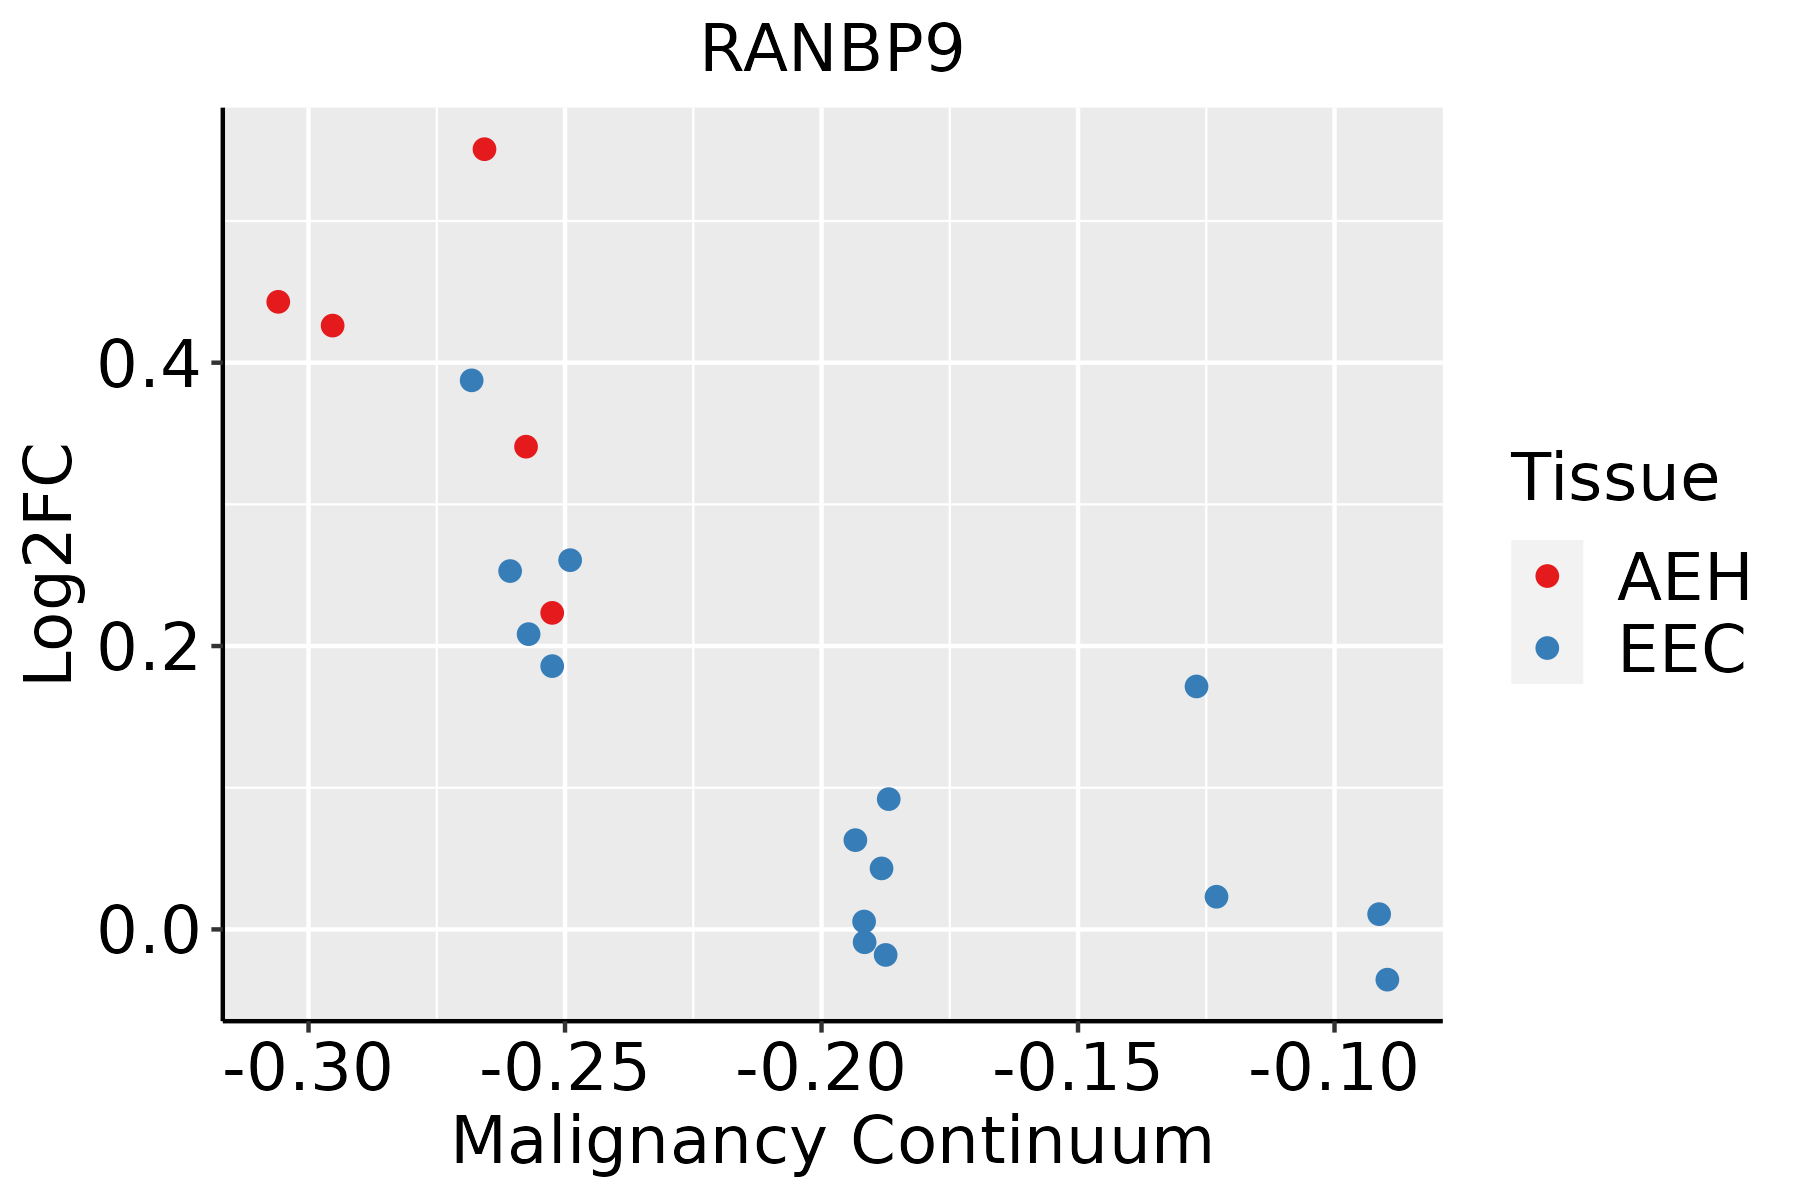 | AEH: Atypical endometrial hyperplasia |
| EEC: Endometrioid Cancer | ||
| Esophagus | 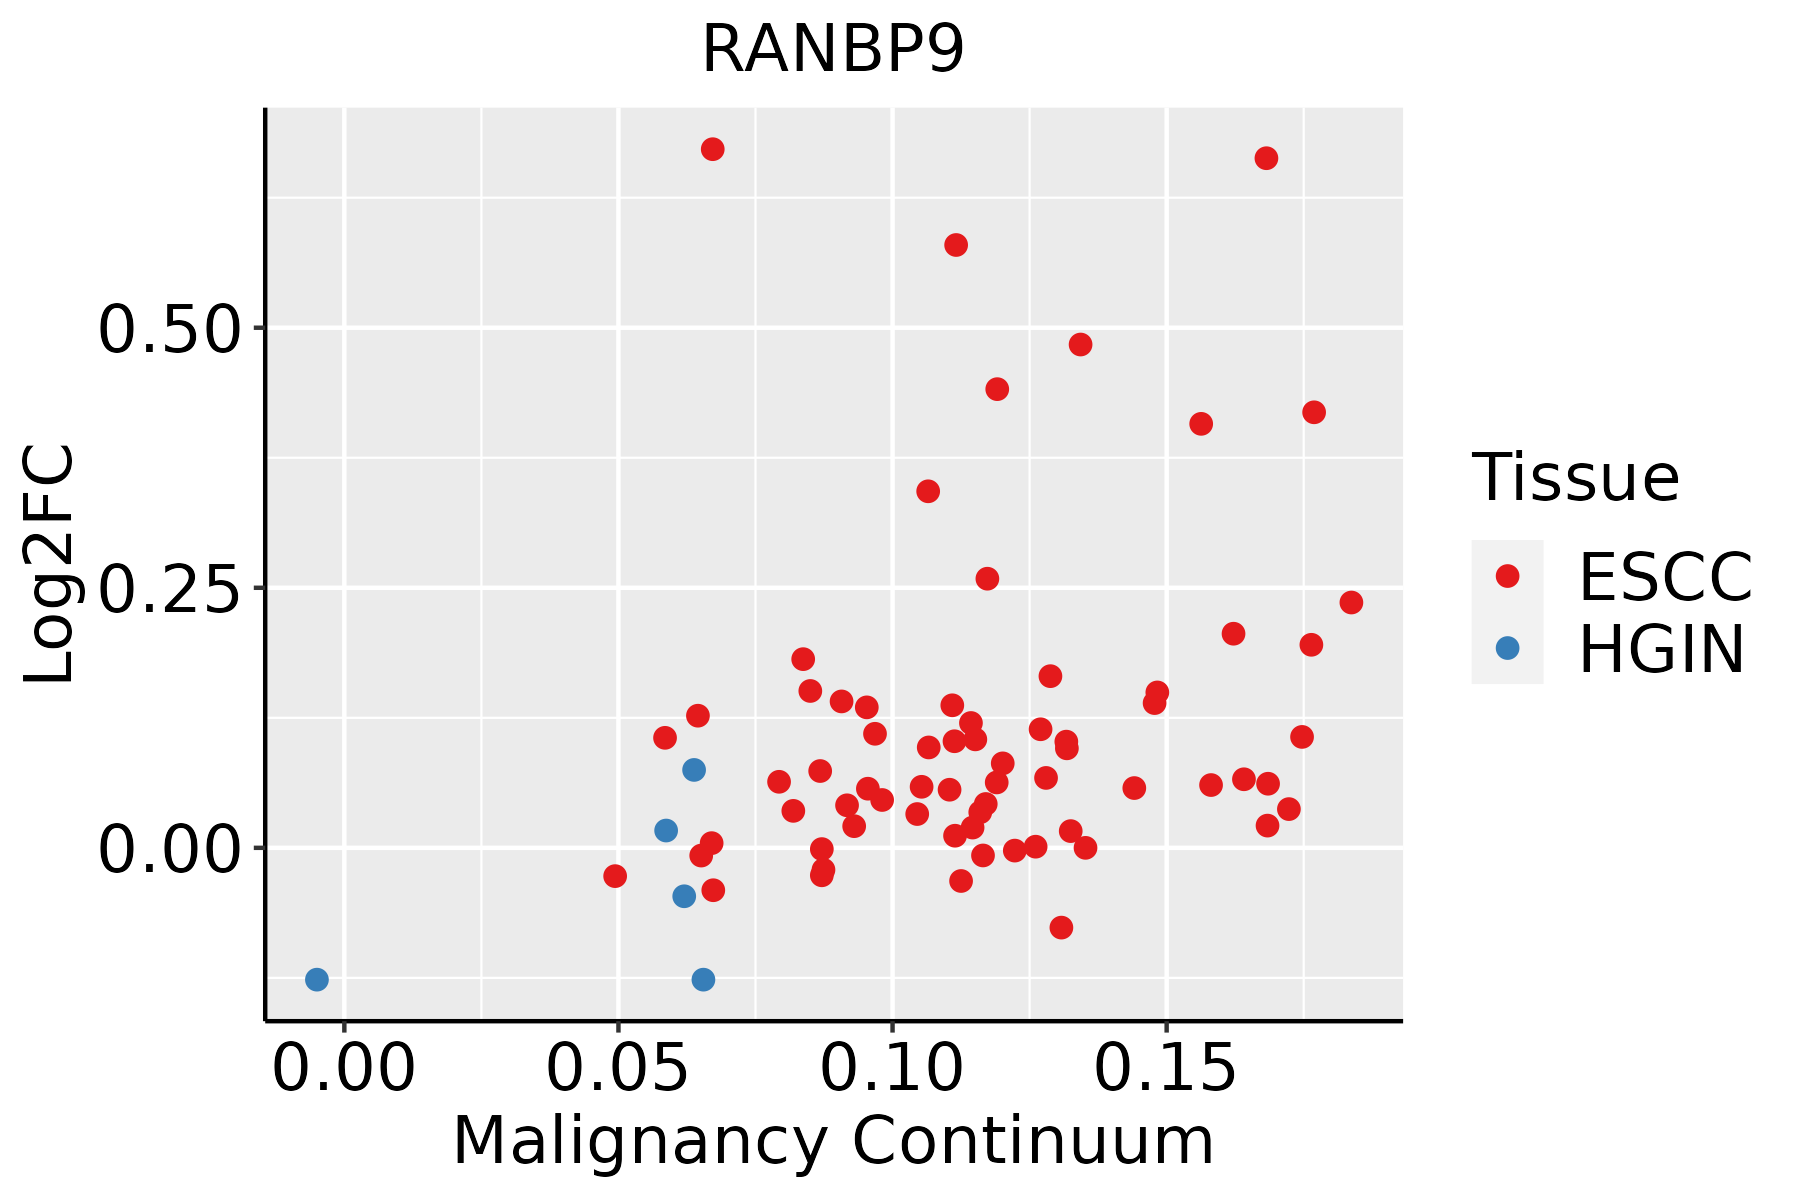 | ESCC: Esophageal squamous cell carcinoma |
| HGIN: High-grade intraepithelial neoplasias | ||
| LGIN: Low-grade intraepithelial neoplasias | ||
| Liver | 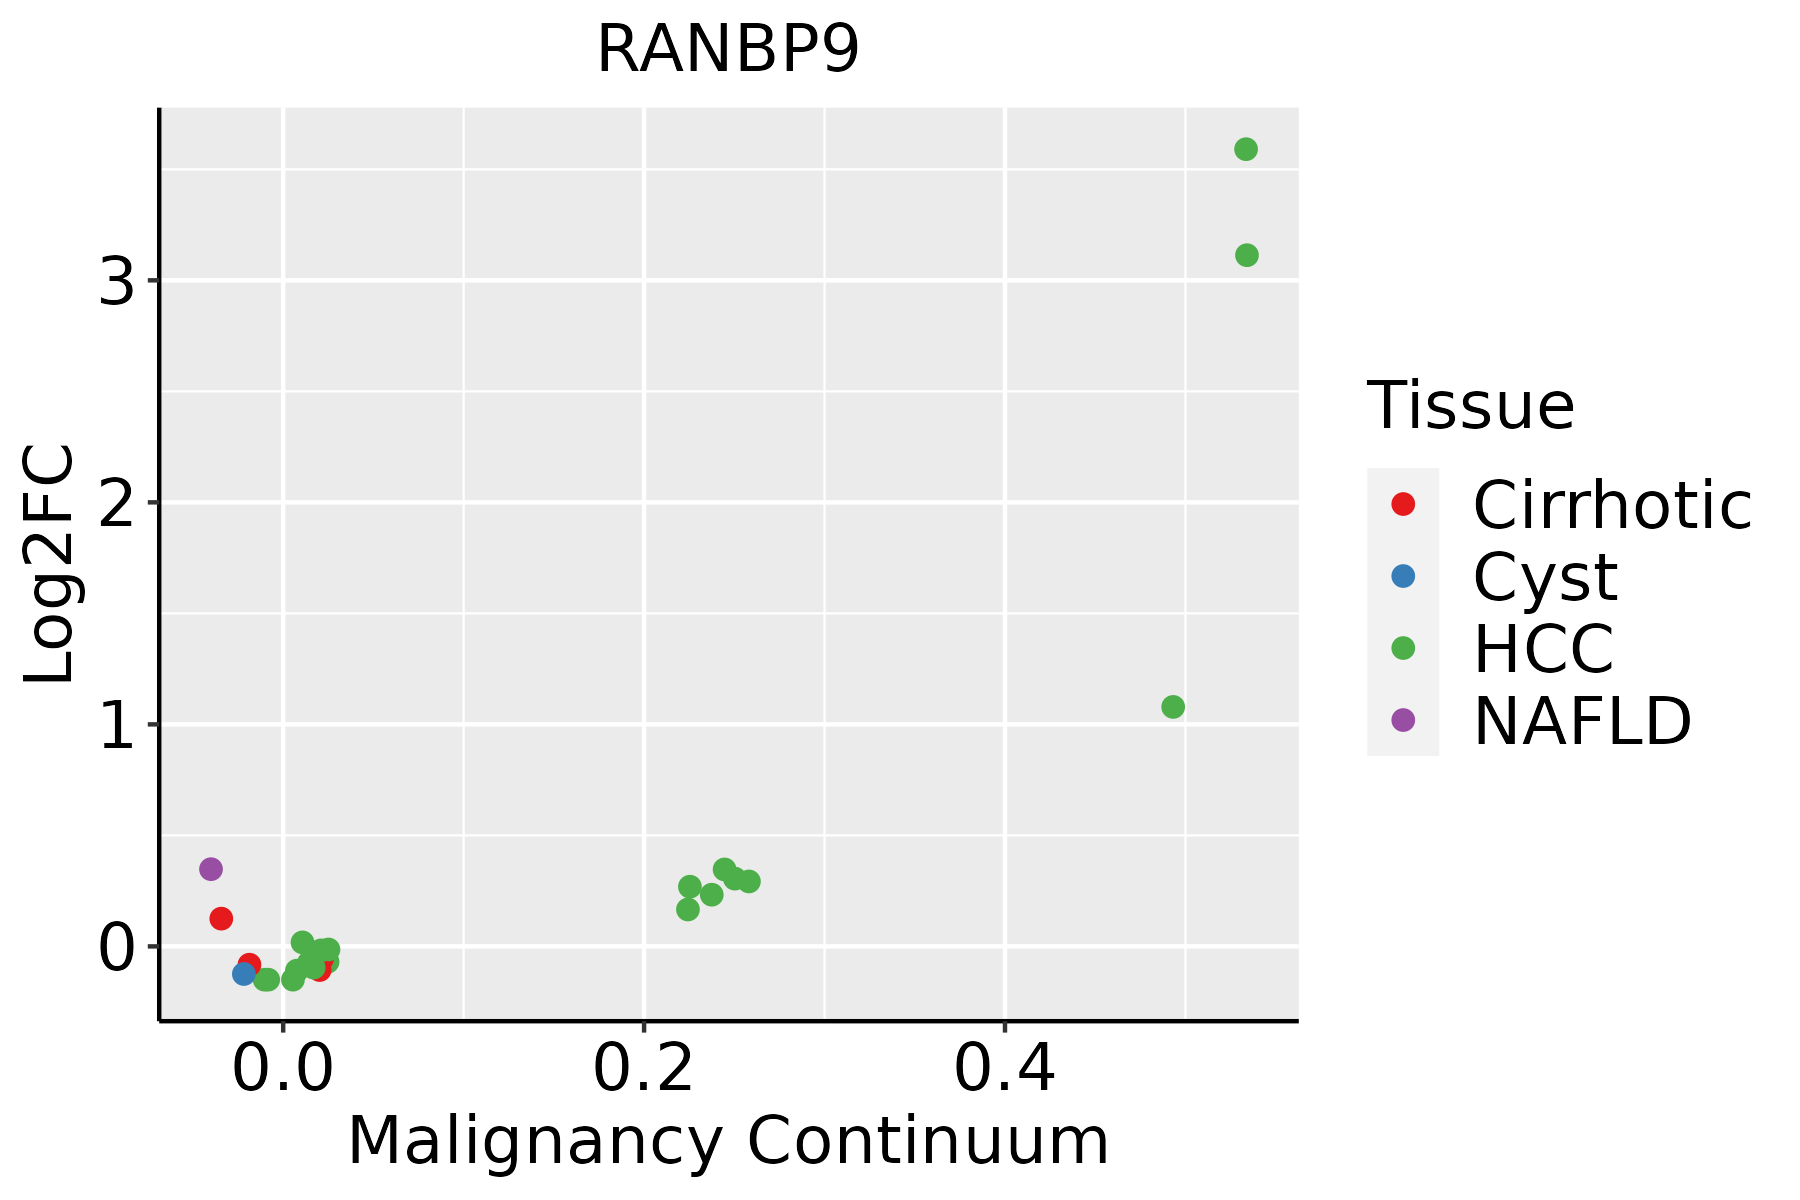 | HCC: Hepatocellular carcinoma |
| NAFLD: Non-alcoholic fatty liver disease | ||
| Lung | 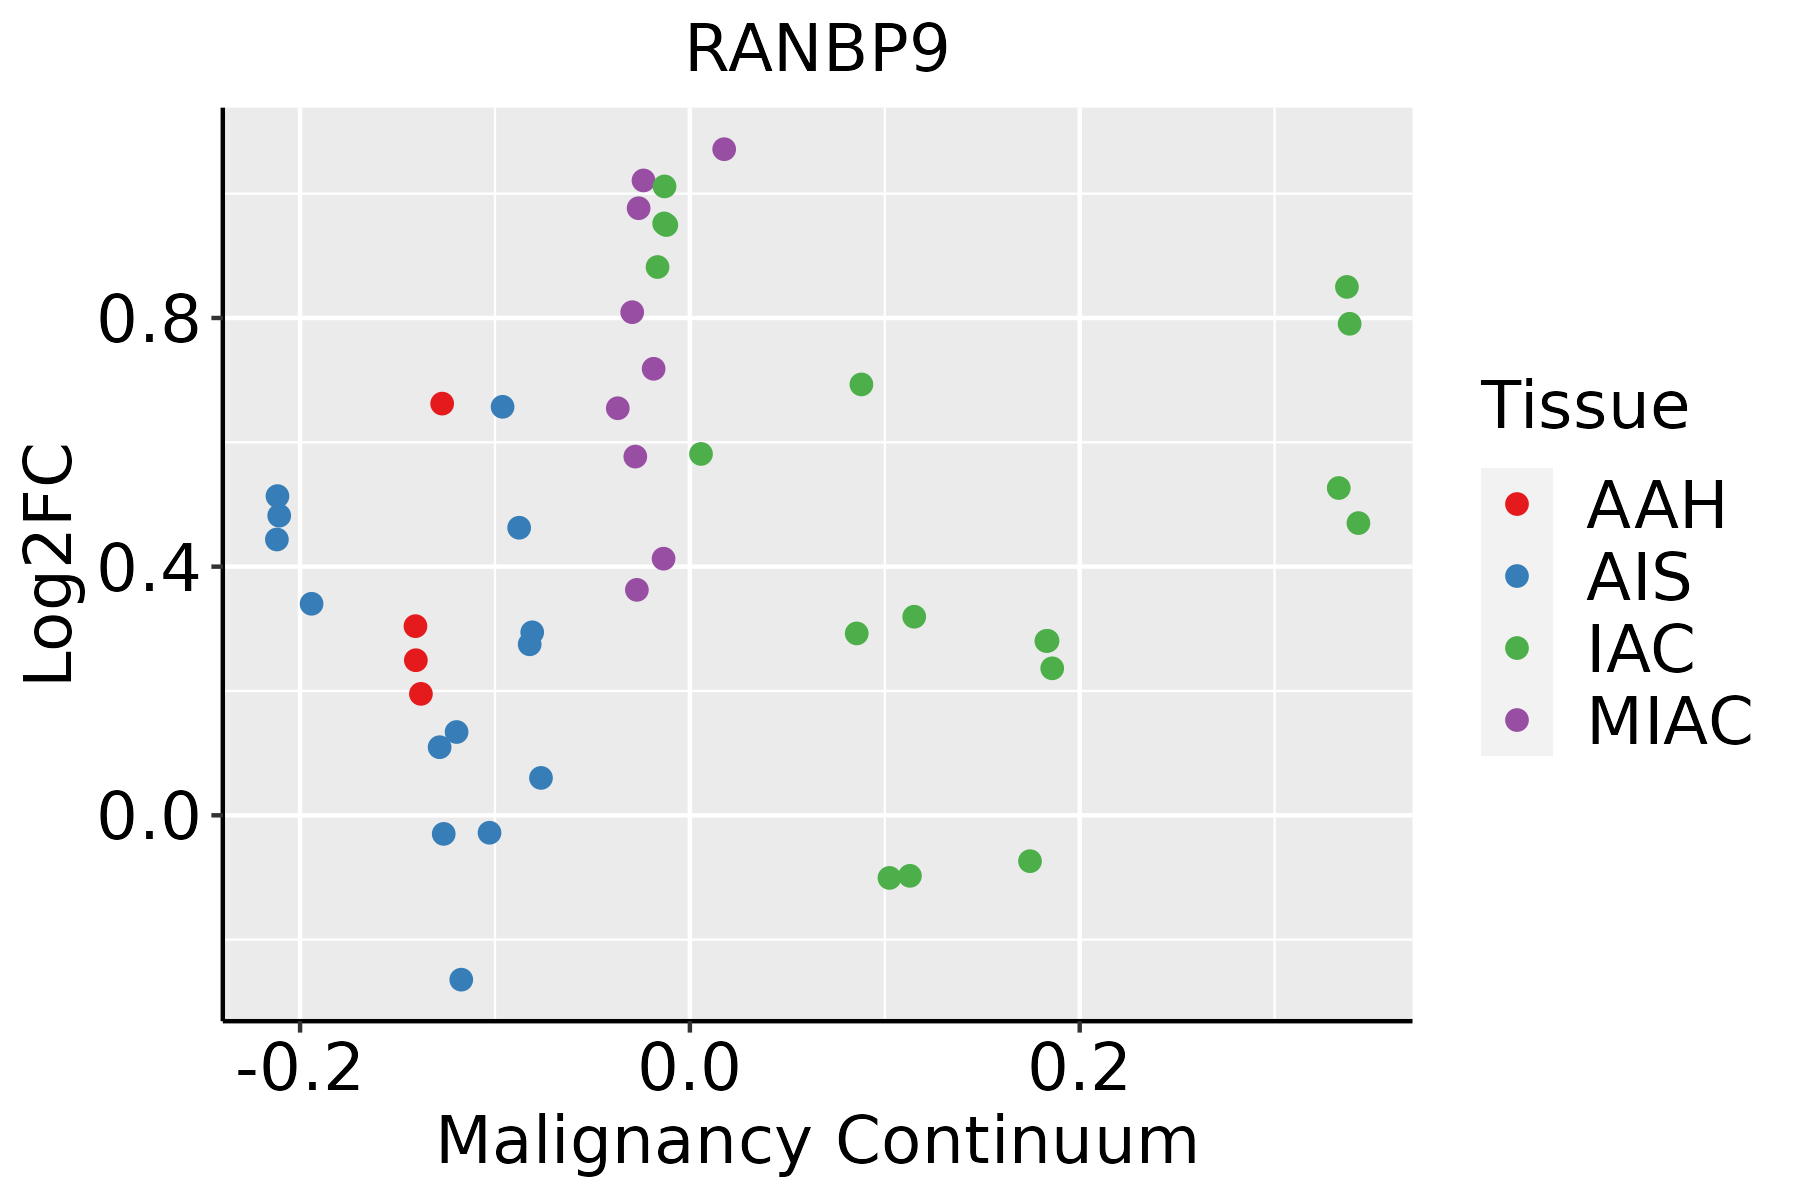 | AAH: Atypical adenomatous hyperplasia |
| AIS: Adenocarcinoma in situ | ||
| IAC: Invasive lung adenocarcinoma | ||
| MIA: Minimally invasive adenocarcinoma | ||
| Oral Cavity | 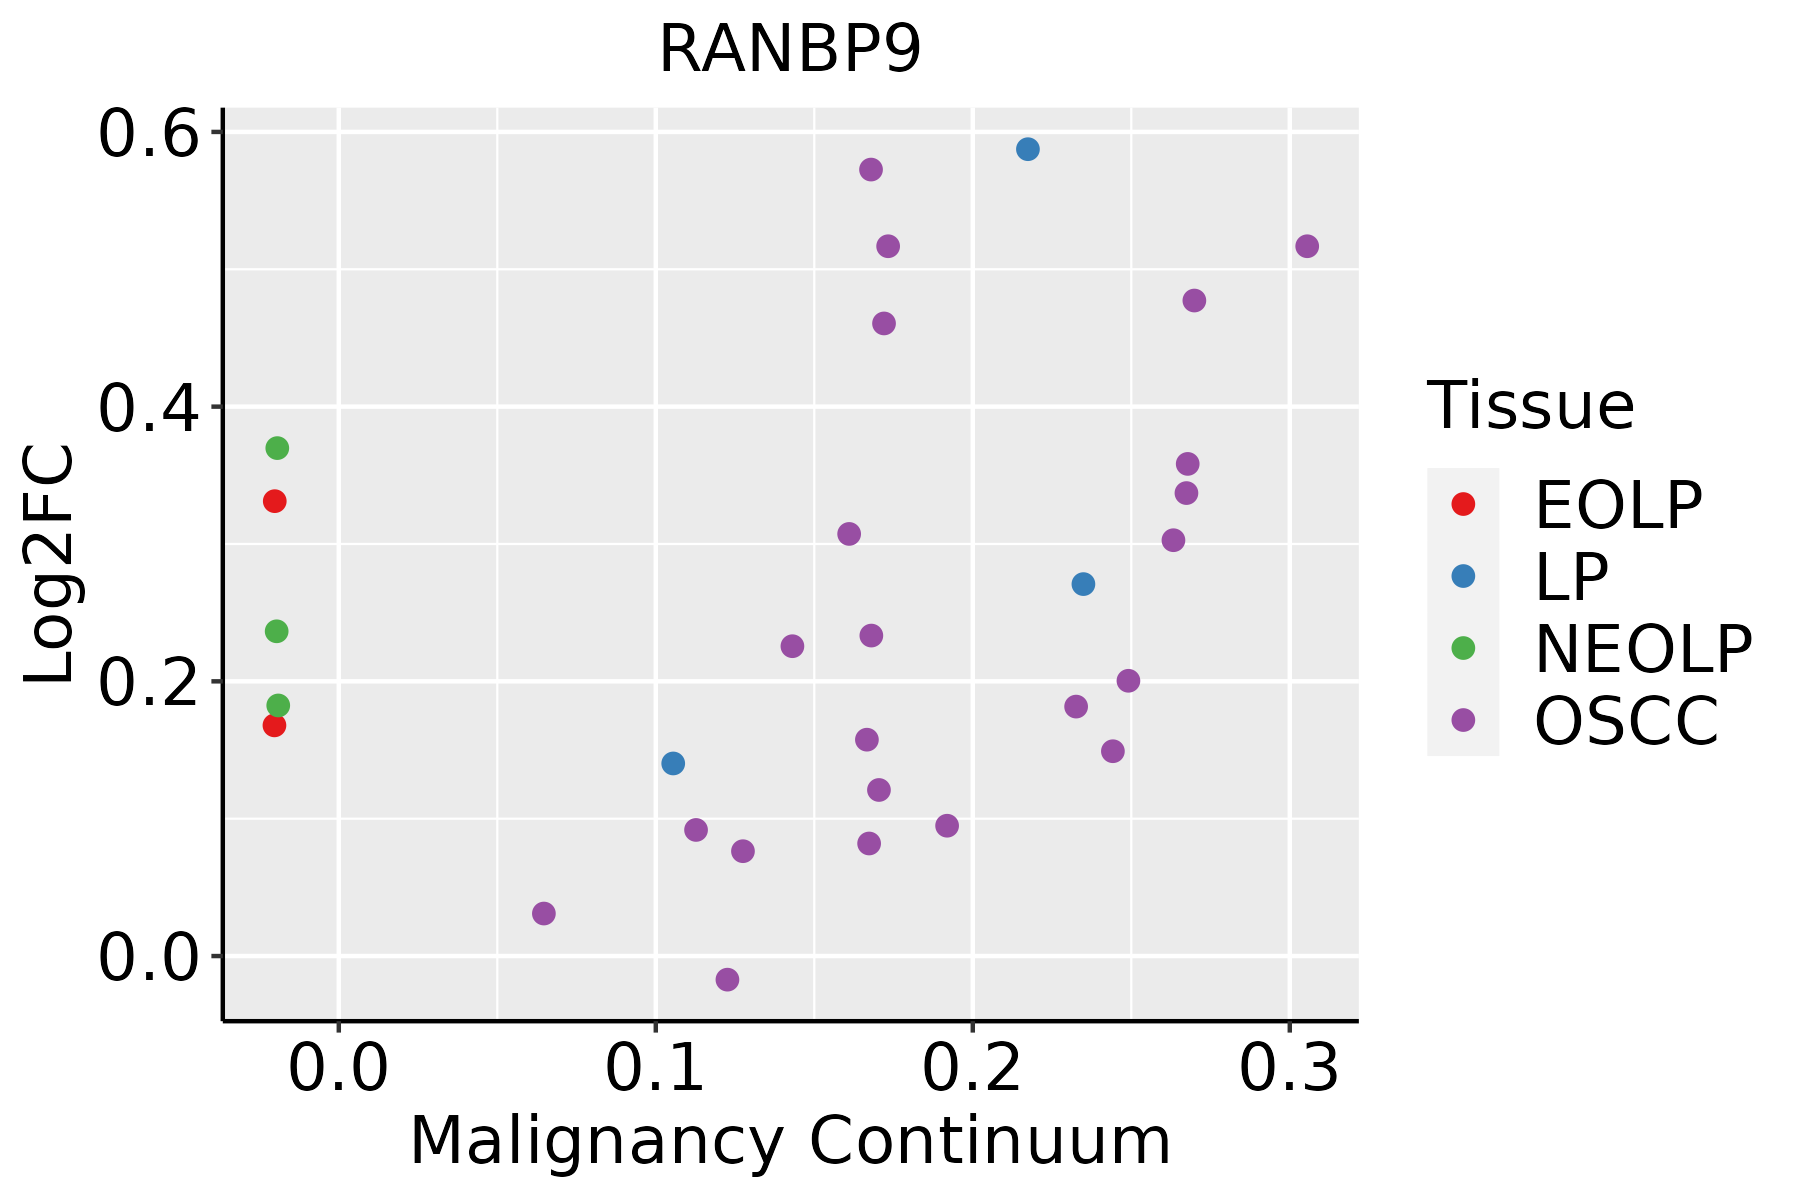 | EOLP: Erosive Oral lichen planus |
| LP: leukoplakia | ||
| NEOLP: Non-erosive oral lichen planus | ||
| OSCC: Oral squamous cell carcinoma |
| ∗log2FC in expression of this searched gene in stem-like cells from each diseased tissue sample relative to stem-like cells in normal samples in each tissue plotted against the malignancy continuum. Samples are colored based on if they are from different disease stage. |
Top |
Malignant transformation related pathway analysis |
| Find out the enriched GO biological processes and KEGG pathways involved in transition from healthy to precancer to cancer |
| Tissue | Disease Stage | Enriched GO biological Processes |
| Colorectum | AD |  |
| Colorectum | SER |  |
| Colorectum | MSS |  |
| Colorectum | MSI-H |  |
| Colorectum | FAP |  |
| ∗Top 15 enriched GO BP terms are showed in the bar plot of each disease state in each tissue. Each row represents a significant GO biological process which is colored according to the -log10(p.adjust). |
| Page: 1 2 3 4 5 6 7 8 9 |
| GO ID | Tissue | Disease Stage | Description | Gene Ratio | Bg Ratio | pvalue | p.adjust | Count |
| GO:005125810 | Cervix | CC | protein polymerization | 70/2311 | 297/18723 | 5.20e-08 | 3.11e-06 | 70 |
| GO:00434099 | Cervix | CC | negative regulation of MAPK cascade | 37/2311 | 180/18723 | 1.17e-03 | 9.50e-03 | 37 |
| GO:00703714 | Cervix | CC | ERK1 and ERK2 cascade | 60/2311 | 330/18723 | 1.28e-03 | 1.02e-02 | 60 |
| GO:00703723 | Cervix | CC | regulation of ERK1 and ERK2 cascade | 54/2311 | 309/18723 | 5.11e-03 | 3.02e-02 | 54 |
| GO:00467853 | Cervix | CC | microtubule polymerization | 19/2311 | 83/18723 | 5.25e-03 | 3.08e-02 | 19 |
| GO:0042987 | Cervix | CC | amyloid precursor protein catabolic process | 16/2311 | 68/18723 | 7.57e-03 | 4.04e-02 | 16 |
| GO:007037112 | Cervix | HSIL_HPV | ERK1 and ERK2 cascade | 25/737 | 330/18723 | 1.42e-03 | 1.59e-02 | 25 |
| GO:005125815 | Cervix | HSIL_HPV | protein polymerization | 23/737 | 297/18723 | 1.63e-03 | 1.77e-02 | 23 |
| GO:004340913 | Cervix | HSIL_HPV | negative regulation of MAPK cascade | 16/737 | 180/18723 | 2.05e-03 | 2.13e-02 | 16 |
| GO:007037211 | Cervix | HSIL_HPV | regulation of ERK1 and ERK2 cascade | 23/737 | 309/18723 | 2.70e-03 | 2.58e-02 | 23 |
| GO:005125816 | Endometrium | AEH | protein polymerization | 62/2100 | 297/18723 | 9.04e-07 | 3.19e-05 | 62 |
| GO:004340910 | Endometrium | AEH | negative regulation of MAPK cascade | 33/2100 | 180/18723 | 3.04e-03 | 2.15e-02 | 33 |
| GO:005125817 | Endometrium | EEC | protein polymerization | 63/2168 | 297/18723 | 1.24e-06 | 4.07e-05 | 63 |
| GO:004340914 | Endometrium | EEC | negative regulation of MAPK cascade | 34/2168 | 180/18723 | 2.69e-03 | 1.95e-02 | 34 |
| GO:0051258111 | Esophagus | ESCC | protein polymerization | 183/8552 | 297/18723 | 1.94e-08 | 3.75e-07 | 183 |
| GO:00311094 | Esophagus | ESCC | microtubule polymerization or depolymerization | 77/8552 | 122/18723 | 7.60e-05 | 5.68e-04 | 77 |
| GO:00467856 | Esophagus | ESCC | microtubule polymerization | 55/8552 | 83/18723 | 1.21e-04 | 8.31e-04 | 55 |
| GO:00070205 | Esophagus | ESCC | microtubule nucleation | 27/8552 | 35/18723 | 1.48e-04 | 9.88e-04 | 27 |
| GO:0043409110 | Esophagus | ESCC | negative regulation of MAPK cascade | 105/8552 | 180/18723 | 4.13e-04 | 2.35e-03 | 105 |
| GO:00512587 | Liver | NAFLD | protein polymerization | 49/1882 | 297/18723 | 3.54e-04 | 5.36e-03 | 49 |
| Page: 1 2 3 4 |
| Pathway ID | Tissue | Disease Stage | Description | Gene Ratio | Bg Ratio | pvalue | p.adjust | qvalue | Count |
| Page: 1 |
Top |
Cell-cell communication analysis |
| Identification of potential cell-cell interactions between two cell types and their ligand-receptor pairs for different disease states |
| Ligand | Receptor | LRpair | Pathway | Tissue | Disease Stage |
| Page: 1 |
Top |
Single-cell gene regulatory network inference analysis |
| Find out the significant the regulons (TFs) and the target genes of each regulon across cell types for different disease states |
| TF | Cell Type | Tissue | Disease Stage | Target Gene | RSS | Regulon Activity |
| ∗The dot plots of a searched regulon are shown for all cell subpopulations in each disease state of each tissue based on the regulon specific score inferred using pySCENIC and by calculating the average expression. |
| Page: 1 |
Top |
Somatic mutation of malignant transformation related genes |
| Annotation of somatic variants for genes involved in malignant transformation |
| Hugo Symbol | Variant Class | Variant Classification | dbSNP RS | HGVSc | HGVSp | HGVSp Short | SWISSPROT | BIOTYPE | SIFT | PolyPhen | Tumor Sample Barcode | Tissue | Histology | Sex | Age | Stage | Therapy Types | Drugs | Outcome |
| RANBP9 | SNV | Missense_Mutation | rs762168475 | c.1819N>T | p.Arg607Cys | p.R607C | Q96S59 | protein_coding | deleterious(0.01) | probably_damaging(0.991) | TCGA-A1-A0SO-01 | Breast | breast invasive carcinoma | Female | >=65 | I/II | Chemotherapy | SD | |
| RANBP9 | SNV | Missense_Mutation | c.893N>T | p.Gly298Val | p.G298V | Q96S59 | protein_coding | deleterious(0) | probably_damaging(1) | TCGA-A8-A08P-01 | Breast | breast invasive carcinoma | Female | >=65 | III/IV | Chemotherapy | 5-fluorouracil | CR | |
| RANBP9 | SNV | Missense_Mutation | novel | c.1307G>T | p.Arg436Ile | p.R436I | Q96S59 | protein_coding | deleterious(0.02) | probably_damaging(0.913) | TCGA-AN-A046-01 | Breast | breast invasive carcinoma | Female | >=65 | I/II | Unknown | Unknown | SD |
| RANBP9 | SNV | Missense_Mutation | novel | c.1720G>A | p.Glu574Lys | p.E574K | Q96S59 | protein_coding | tolerated(0.09) | possibly_damaging(0.829) | TCGA-OL-A5RW-01 | Breast | breast invasive carcinoma | Female | <65 | I/II | Chemotherapy | adriamycin | CR |
| RANBP9 | SNV | Missense_Mutation | novel | c.1631N>A | p.Ser544Asn | p.S544N | Q96S59 | protein_coding | tolerated(0.11) | benign(0.015) | TCGA-C5-A8YQ-01 | Cervix | cervical & endocervical cancer | Female | >=65 | I/II | Chemotherapy | cisplatin | PD |
| RANBP9 | SNV | Missense_Mutation | c.1090N>C | p.Glu364Gln | p.E364Q | Q96S59 | protein_coding | tolerated(0.09) | possibly_damaging(0.867) | TCGA-EK-A3GM-01 | Cervix | cervical & endocervical cancer | Female | >=65 | I/II | Unknown | Unknown | SD | |
| RANBP9 | SNV | Missense_Mutation | novel | c.1952N>A | p.Ala651Glu | p.A651E | Q96S59 | protein_coding | deleterious(0) | probably_damaging(0.999) | TCGA-FU-A3NI-01 | Cervix | cervical & endocervical cancer | Female | <65 | I/II | Unknown | Unknown | SD |
| RANBP9 | SNV | Missense_Mutation | novel | c.1911C>A | p.Asp637Glu | p.D637E | Q96S59 | protein_coding | tolerated(1) | benign(0) | TCGA-AA-A00N-01 | Colorectum | colon adenocarcinoma | Male | >=65 | I/II | Unknown | Unknown | PD |
| RANBP9 | SNV | Missense_Mutation | rs756235885 | c.1189N>A | p.Val397Ile | p.V397I | Q96S59 | protein_coding | tolerated(0.62) | benign(0.106) | TCGA-AD-5900-01 | Colorectum | colon adenocarcinoma | Male | >=65 | I/II | Unknown | Unknown | SD |
| RANBP9 | SNV | Missense_Mutation | c.1339C>T | p.Arg447Cys | p.R447C | Q96S59 | protein_coding | deleterious(0) | probably_damaging(0.998) | TCGA-AD-6901-01 | Colorectum | colon adenocarcinoma | Male | >=65 | I/II | Chemotherapy | xeloda | PD |
| Page: 1 2 3 4 5 6 |
Top |
Related drugs of malignant transformation related genes |
| Identification of chemicals and drugs interact with genes involved in malignant transfromation |
| (DGIdb 4.0) |
| Entrez ID | Symbol | Category | Interaction Types | Drug Claim Name | Drug Name | PMIDs |
| Page: 1 |

Copyright 2023-Present -The University of Texas Health Science Center at Houston |