
|
|||||
|
 | |
| |
| |
| |
| |
| |
|
Gene: RAB5B |
Gene summary for RAB5B |
| Gene information | Species | Human | Gene symbol | RAB5B | Gene ID | 5869 |
| Gene name | RAB5B, member RAS oncogene family | |
| Gene Alias | RAB5B | |
| Cytomap | 12q13.2 | |
| Gene Type | protein-coding | GO ID | GO:0002376 | UniProtAcc | A0A024RB09 |
Top |
Malignant transformation analysis |
| Identification of the aberrant gene expression in precancerous and cancerous lesions by comparing the gene expression of stem-like cells in diseased tissues with normal stem cells |
| Entrez ID | Symbol | Replicates | Species | Organ | Tissue | Adj P-value | Log2FC | Malignancy |
| 5869 | RAB5B | LZE24T | Human | Esophagus | ESCC | 1.36e-19 | 6.54e-01 | 0.0596 |
| 5869 | RAB5B | LZE21T | Human | Esophagus | ESCC | 4.19e-02 | 1.84e-01 | 0.0655 |
| 5869 | RAB5B | LZE6T | Human | Esophagus | ESCC | 1.87e-05 | 1.58e-01 | 0.0845 |
| 5869 | RAB5B | P1T-E | Human | Esophagus | ESCC | 2.49e-09 | 5.72e-01 | 0.0875 |
| 5869 | RAB5B | P2T-E | Human | Esophagus | ESCC | 1.40e-31 | 6.43e-01 | 0.1177 |
| 5869 | RAB5B | P4T-E | Human | Esophagus | ESCC | 2.82e-18 | 4.26e-01 | 0.1323 |
| 5869 | RAB5B | P5T-E | Human | Esophagus | ESCC | 7.13e-15 | 1.08e-01 | 0.1327 |
| 5869 | RAB5B | P8T-E | Human | Esophagus | ESCC | 1.34e-31 | 5.37e-01 | 0.0889 |
| 5869 | RAB5B | P9T-E | Human | Esophagus | ESCC | 2.08e-13 | 1.33e-01 | 0.1131 |
| 5869 | RAB5B | P10T-E | Human | Esophagus | ESCC | 1.69e-27 | 4.61e-01 | 0.116 |
| 5869 | RAB5B | P11T-E | Human | Esophagus | ESCC | 5.61e-17 | 5.57e-01 | 0.1426 |
| 5869 | RAB5B | P12T-E | Human | Esophagus | ESCC | 1.19e-23 | 4.84e-01 | 0.1122 |
| 5869 | RAB5B | P15T-E | Human | Esophagus | ESCC | 7.13e-23 | 3.79e-01 | 0.1149 |
| 5869 | RAB5B | P16T-E | Human | Esophagus | ESCC | 1.36e-37 | 5.47e-01 | 0.1153 |
| 5869 | RAB5B | P17T-E | Human | Esophagus | ESCC | 8.12e-06 | 4.59e-01 | 0.1278 |
| 5869 | RAB5B | P19T-E | Human | Esophagus | ESCC | 2.75e-07 | 8.22e-01 | 0.1662 |
| 5869 | RAB5B | P20T-E | Human | Esophagus | ESCC | 4.64e-25 | 6.47e-01 | 0.1124 |
| 5869 | RAB5B | P21T-E | Human | Esophagus | ESCC | 5.82e-33 | 4.20e-01 | 0.1617 |
| 5869 | RAB5B | P22T-E | Human | Esophagus | ESCC | 5.42e-27 | 4.30e-01 | 0.1236 |
| 5869 | RAB5B | P23T-E | Human | Esophagus | ESCC | 5.67e-29 | 7.05e-01 | 0.108 |
| Page: 1 2 3 4 5 6 7 8 |
| Tissue | Expression Dynamics | Abbreviation |
| Colorectum (GSE201348) |  | FAP: Familial adenomatous polyposis |
| CRC: Colorectal cancer | ||
| Colorectum (HTA11) | 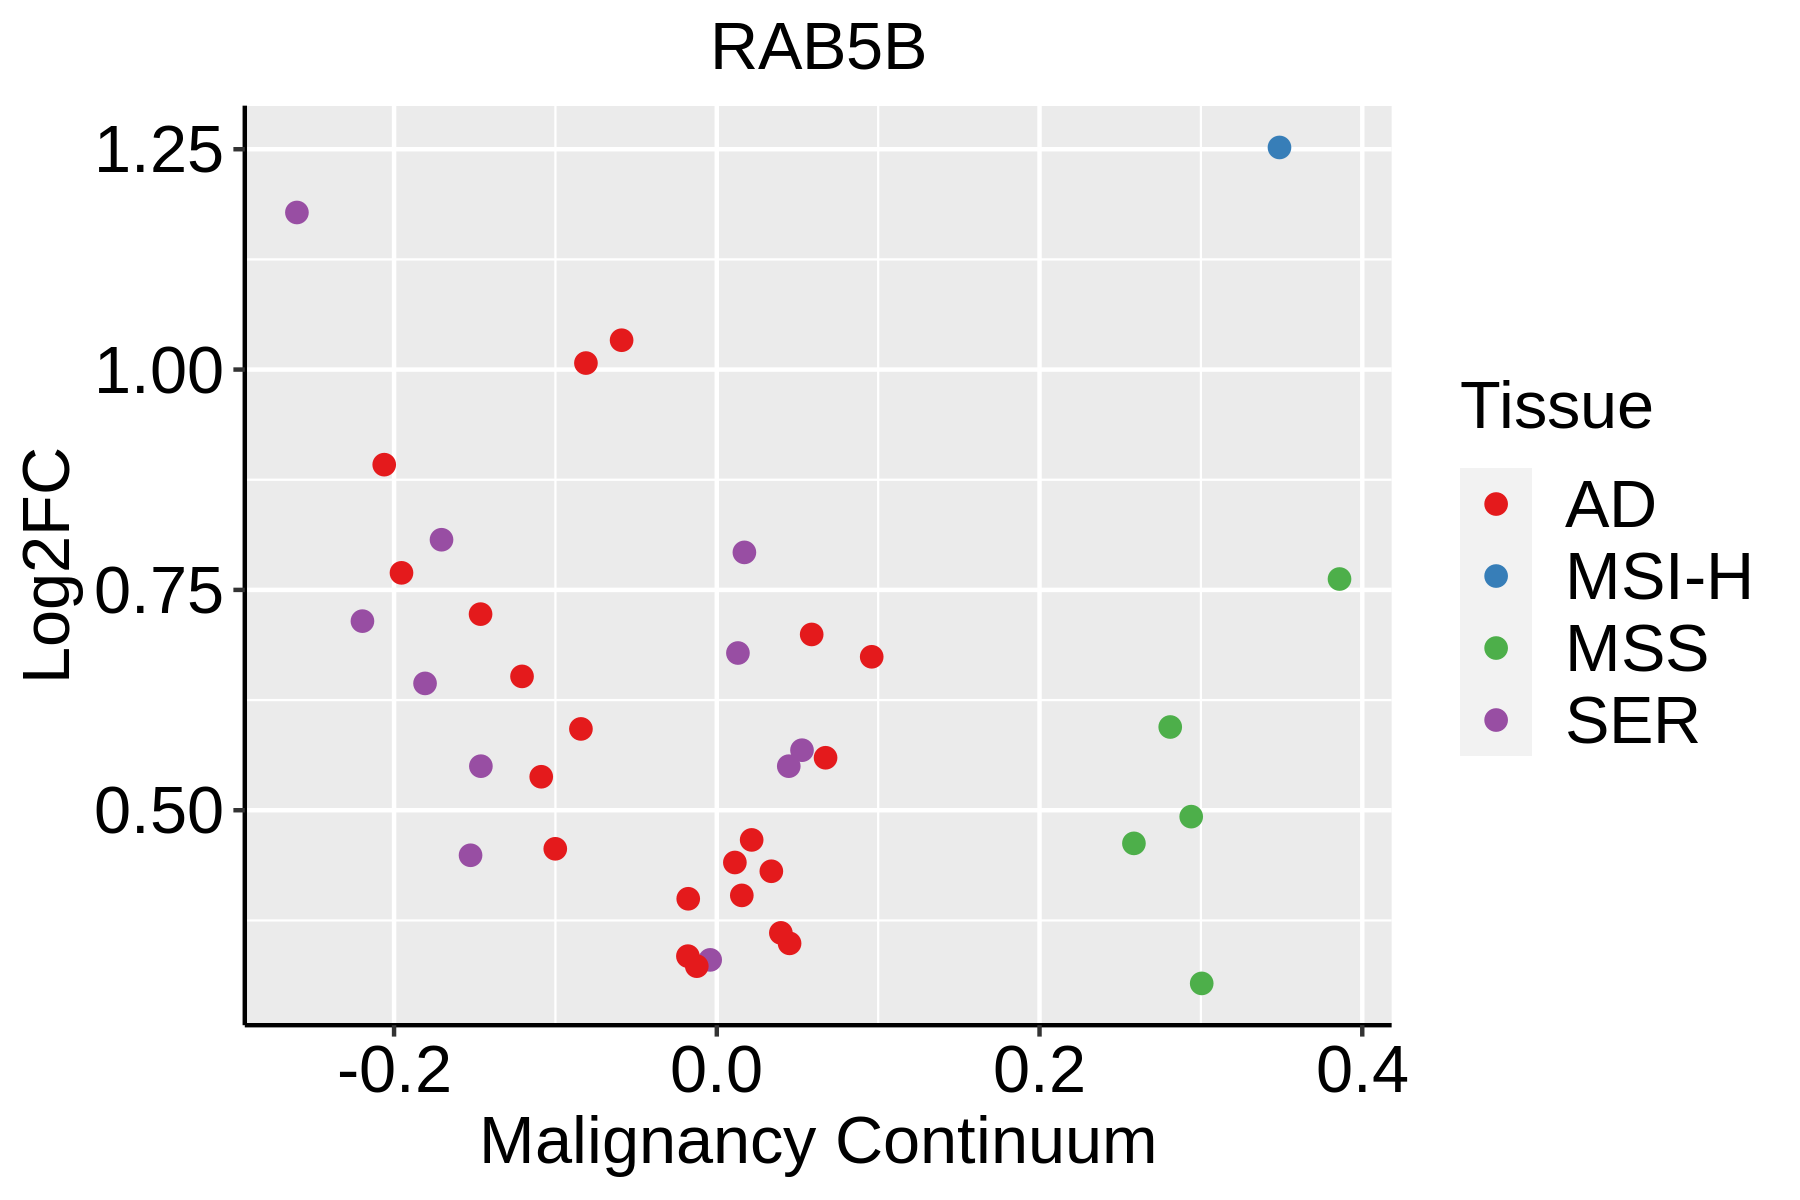 | AD: Adenomas |
| SER: Sessile serrated lesions | ||
| MSI-H: Microsatellite-high colorectal cancer | ||
| MSS: Microsatellite stable colorectal cancer | ||
| Esophagus |  | ESCC: Esophageal squamous cell carcinoma |
| HGIN: High-grade intraepithelial neoplasias | ||
| LGIN: Low-grade intraepithelial neoplasias | ||
| Liver | 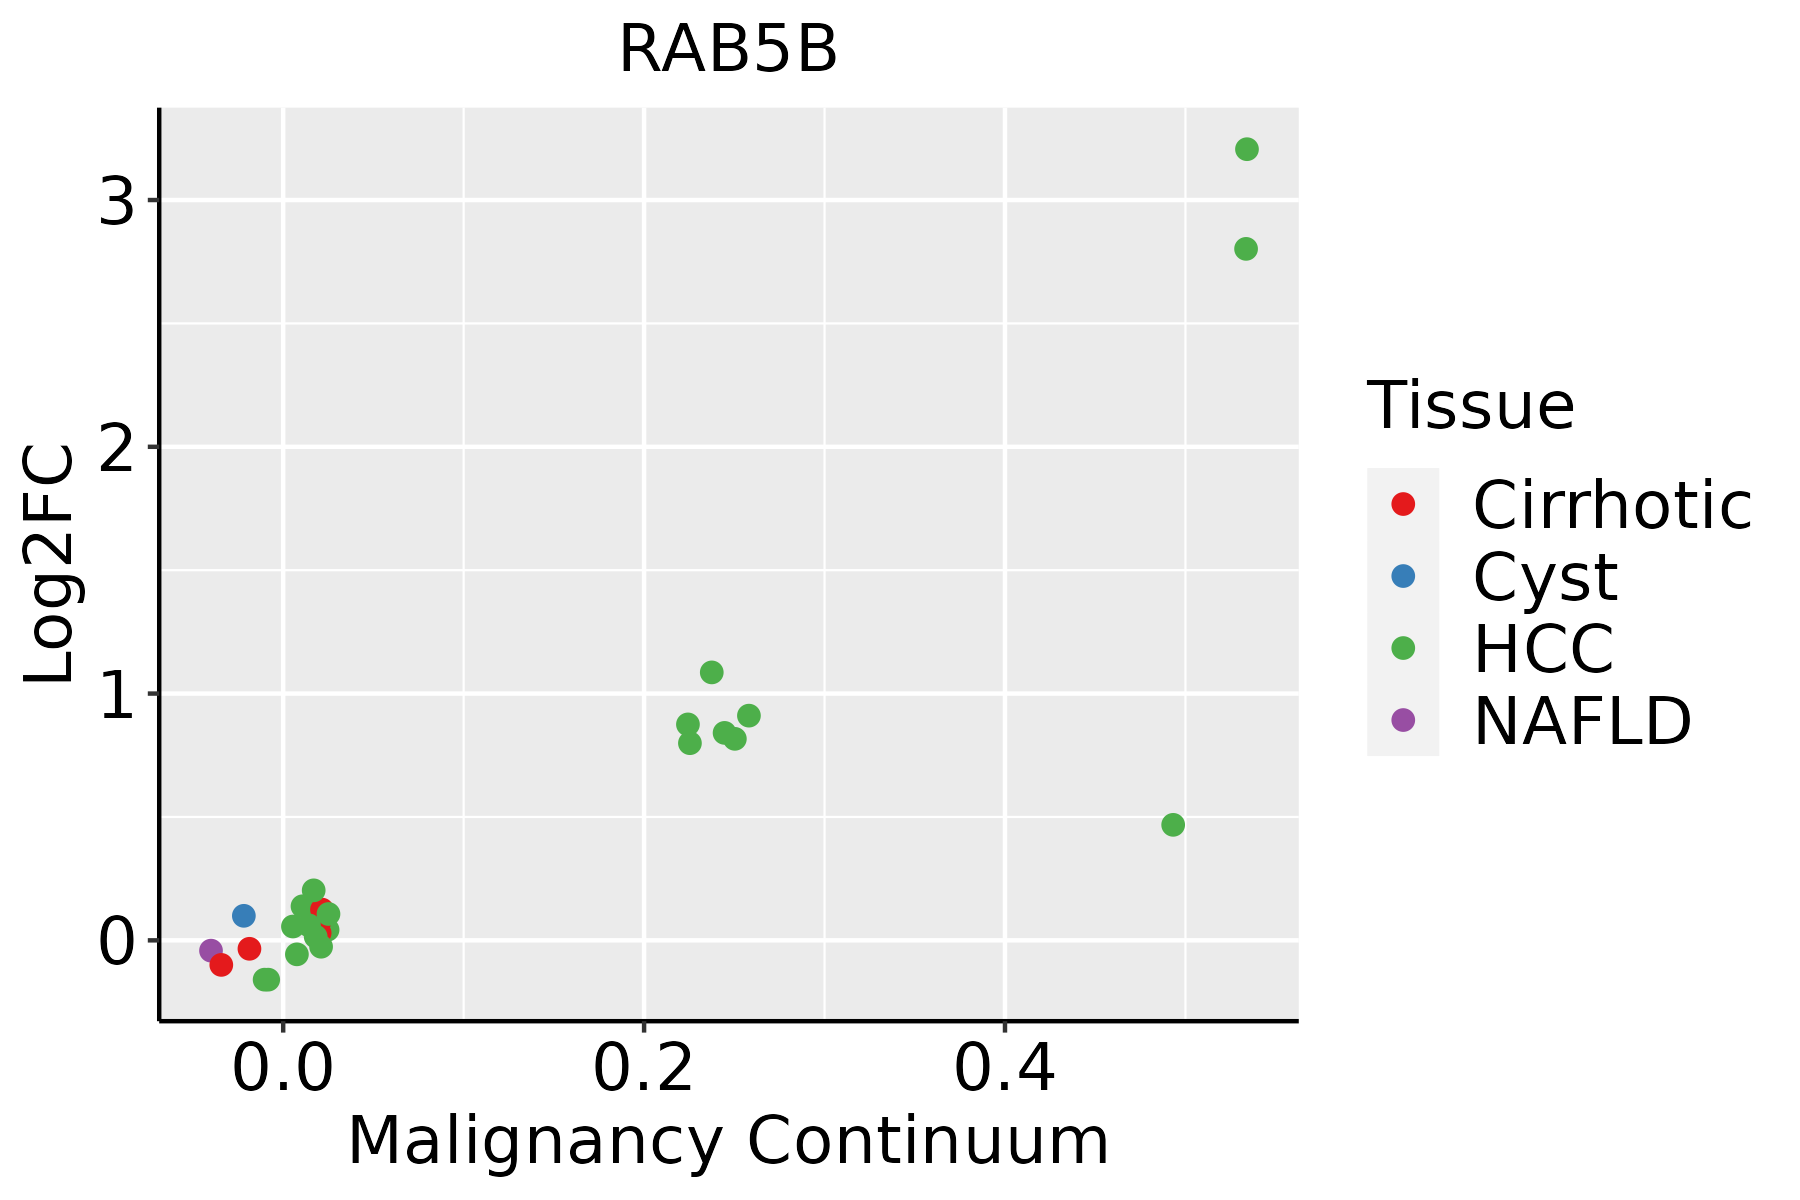 | HCC: Hepatocellular carcinoma |
| NAFLD: Non-alcoholic fatty liver disease | ||
| Oral Cavity | 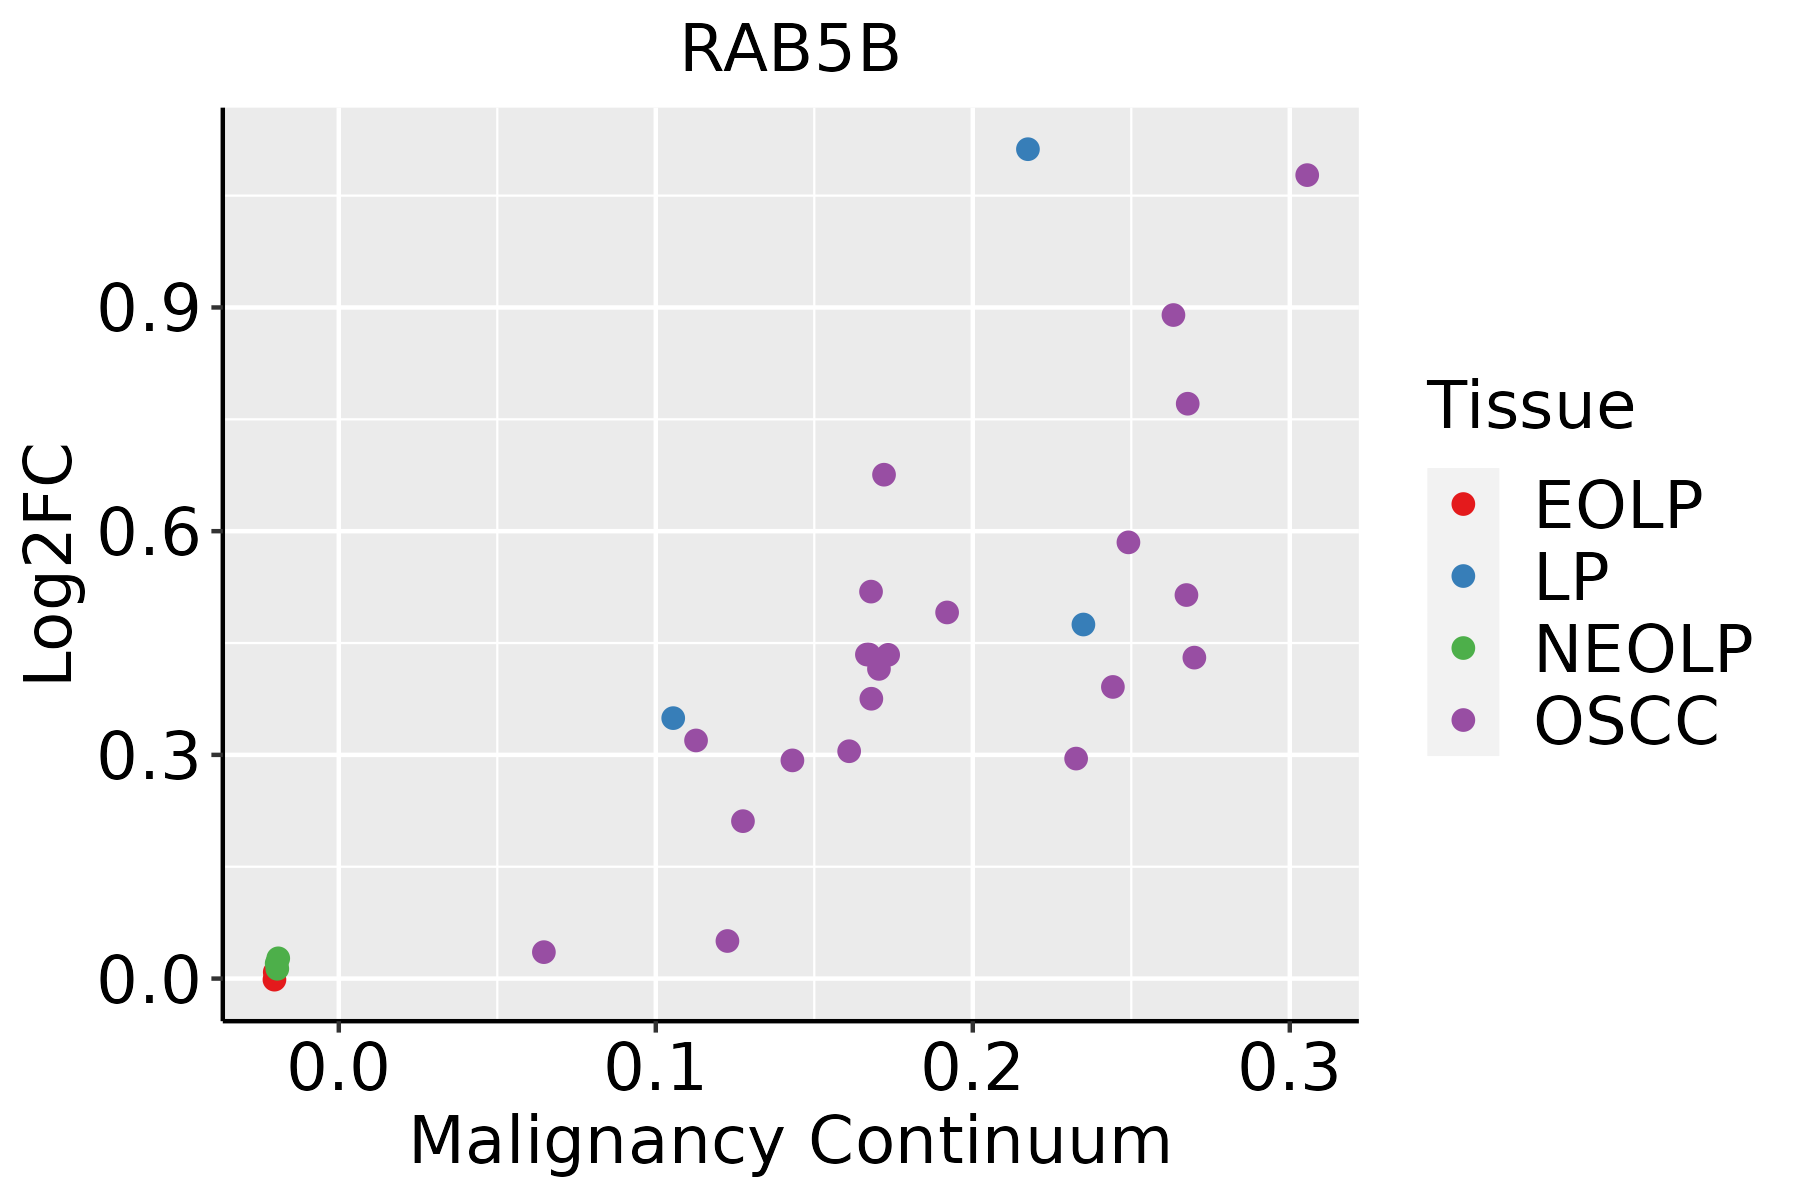 | EOLP: Erosive Oral lichen planus |
| LP: leukoplakia | ||
| NEOLP: Non-erosive oral lichen planus | ||
| OSCC: Oral squamous cell carcinoma | ||
| Prostate |  | BPH: Benign Prostatic Hyperplasia |
| Skin | 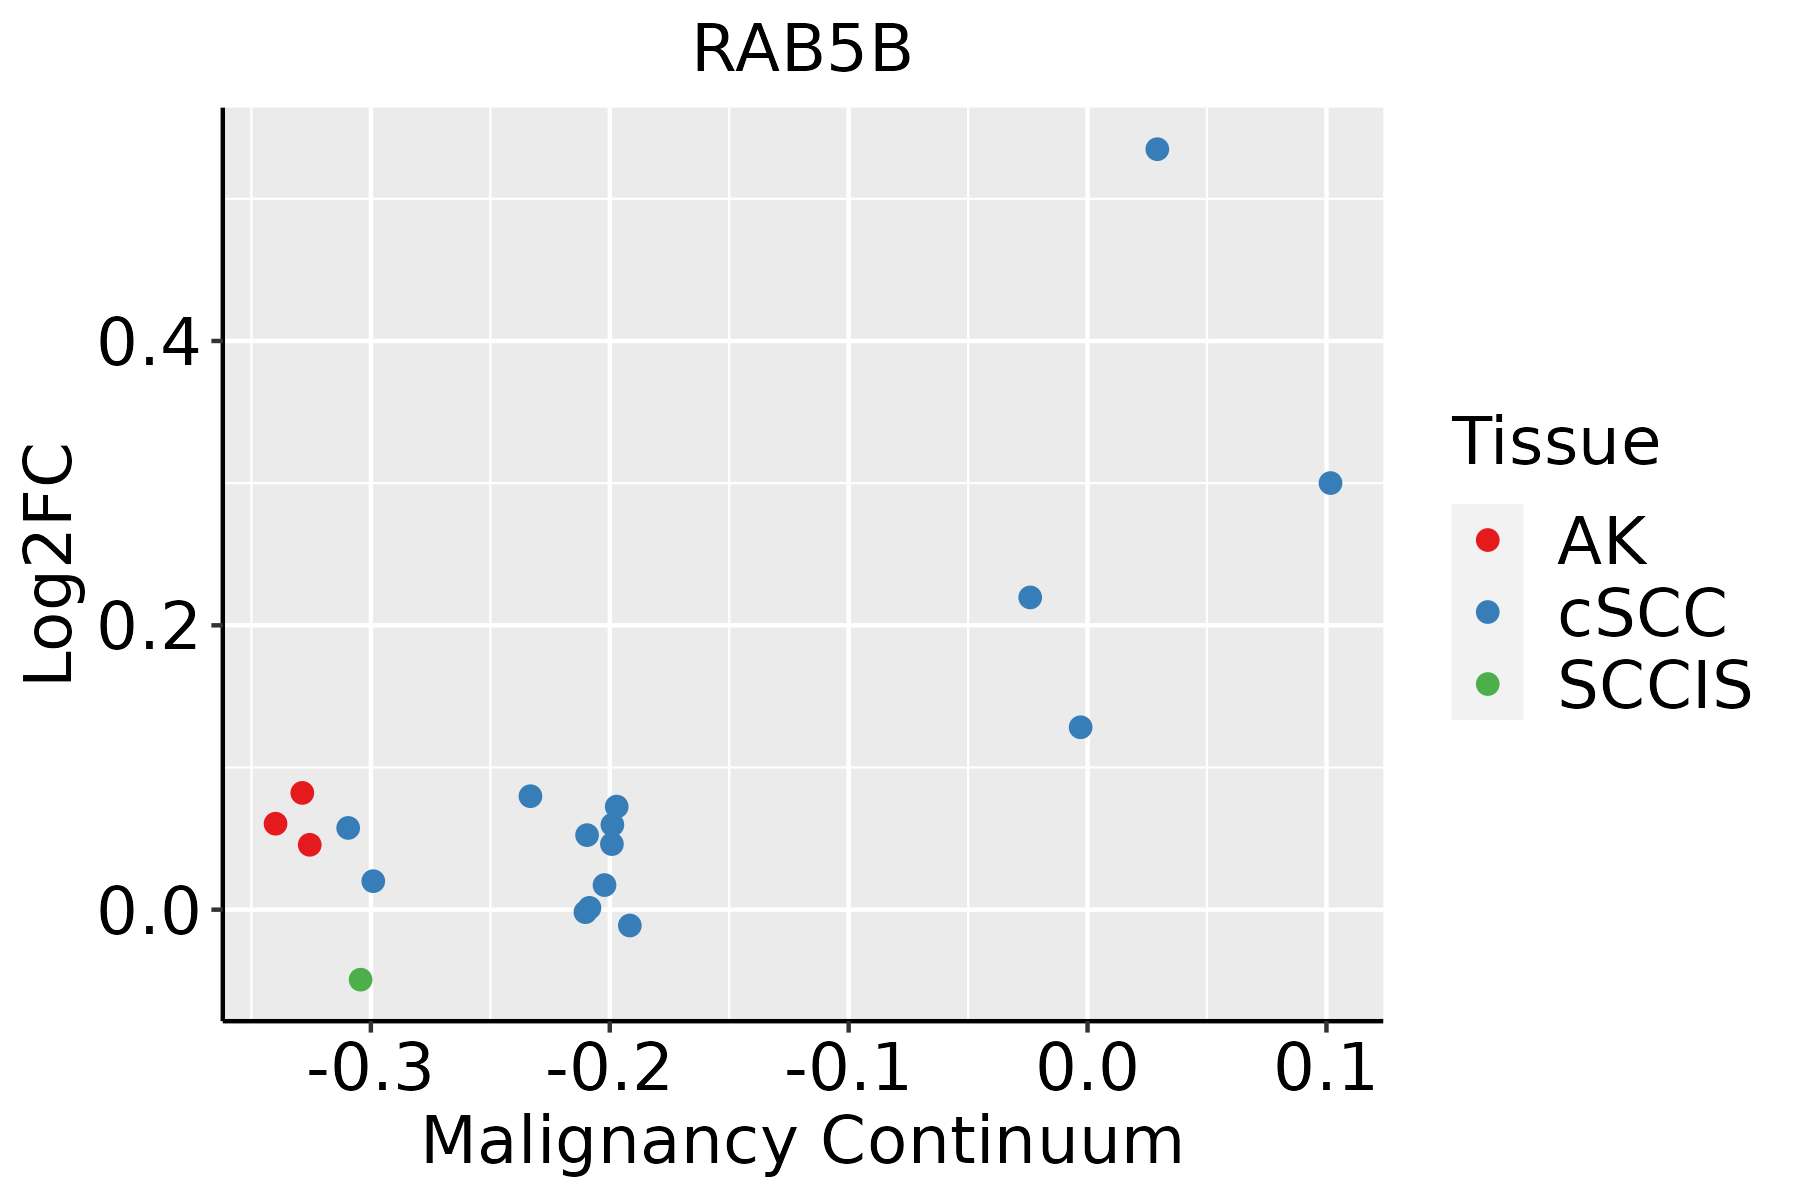 | AK: Actinic keratosis |
| cSCC: Cutaneous squamous cell carcinoma | ||
| SCCIS:squamous cell carcinoma in situ | ||
| Thyroid |  | ATC: Anaplastic thyroid cancer |
| HT: Hashimoto's thyroiditis | ||
| PTC: Papillary thyroid cancer |
| ∗log2FC in expression of this searched gene in stem-like cells from each diseased tissue sample relative to stem-like cells in normal samples in each tissue plotted against the malignancy continuum. Samples are colored based on if they are from different disease stage. |
Top |
Malignant transformation related pathway analysis |
| Find out the enriched GO biological processes and KEGG pathways involved in transition from healthy to precancer to cancer |
| Tissue | Disease Stage | Enriched GO biological Processes |
| Colorectum | AD |  |
| Colorectum | SER |  |
| Colorectum | MSS |  |
| Colorectum | MSI-H |  |
| Colorectum | FAP |  |
| ∗Top 15 enriched GO BP terms are showed in the bar plot of each disease state in each tissue. Each row represents a significant GO biological process which is colored according to the -log10(p.adjust). |
| Page: 1 2 3 4 5 6 7 8 9 |
| GO ID | Tissue | Disease Stage | Description | Gene Ratio | Bg Ratio | pvalue | p.adjust | Count |
| GO:0030100 | Colorectum | AD | regulation of endocytosis | 67/3918 | 211/18723 | 1.42e-04 | 2.01e-03 | 67 |
| GO:0019882 | Colorectum | SER | antigen processing and presentation | 28/2897 | 106/18723 | 2.52e-03 | 2.34e-02 | 28 |
| GO:00301001 | Colorectum | SER | regulation of endocytosis | 48/2897 | 211/18723 | 3.29e-03 | 2.82e-02 | 48 |
| GO:00301002 | Colorectum | MSS | regulation of endocytosis | 63/3467 | 211/18723 | 4.05e-05 | 7.66e-04 | 63 |
| GO:00198821 | Colorectum | MSI-H | antigen processing and presentation | 16/1319 | 106/18723 | 3.00e-03 | 3.78e-02 | 16 |
| GO:00301003 | Colorectum | FAP | regulation of endocytosis | 52/2622 | 211/18723 | 2.47e-05 | 5.77e-04 | 52 |
| GO:003010018 | Esophagus | ESCC | regulation of endocytosis | 135/8552 | 211/18723 | 5.75e-08 | 1.02e-06 | 135 |
| GO:001988225 | Esophagus | ESCC | antigen processing and presentation | 67/8552 | 106/18723 | 2.03e-04 | 1.28e-03 | 67 |
| GO:00198827 | Liver | Cirrhotic | antigen processing and presentation | 44/4634 | 106/18723 | 1.07e-04 | 1.10e-03 | 44 |
| GO:003010011 | Liver | Cirrhotic | regulation of endocytosis | 74/4634 | 211/18723 | 4.86e-04 | 3.90e-03 | 74 |
| GO:001988212 | Liver | HCC | antigen processing and presentation | 65/7958 | 106/18723 | 7.06e-05 | 6.37e-04 | 65 |
| GO:003010021 | Liver | HCC | regulation of endocytosis | 117/7958 | 211/18723 | 9.56e-05 | 8.32e-04 | 117 |
| GO:003010016 | Oral cavity | OSCC | regulation of endocytosis | 121/7305 | 211/18723 | 4.74e-08 | 8.80e-07 | 121 |
| GO:001988220 | Oral cavity | OSCC | antigen processing and presentation | 65/7305 | 106/18723 | 2.69e-06 | 3.32e-05 | 65 |
| GO:0019882110 | Oral cavity | LP | antigen processing and presentation | 48/4623 | 106/18723 | 2.96e-06 | 6.44e-05 | 48 |
| GO:003010017 | Oral cavity | LP | regulation of endocytosis | 81/4623 | 211/18723 | 6.57e-06 | 1.29e-04 | 81 |
| GO:003010015 | Prostate | Tumor | regulation of endocytosis | 60/3246 | 211/18723 | 4.05e-05 | 4.62e-04 | 60 |
| GO:001988219 | Prostate | Tumor | antigen processing and presentation | 35/3246 | 106/18723 | 6.46e-05 | 6.99e-04 | 35 |
| GO:001988227 | Skin | cSCC | antigen processing and presentation | 42/4864 | 106/18723 | 1.42e-03 | 8.98e-03 | 42 |
| GO:003010024 | Skin | cSCC | regulation of endocytosis | 72/4864 | 211/18723 | 5.06e-03 | 2.56e-02 | 72 |
| Page: 1 2 |
| Pathway ID | Tissue | Disease Stage | Description | Gene Ratio | Bg Ratio | pvalue | p.adjust | qvalue | Count |
| hsa04144 | Colorectum | AD | Endocytosis | 111/2092 | 251/8465 | 5.95e-12 | 1.42e-10 | 9.08e-11 | 111 |
| hsa05132 | Colorectum | AD | Salmonella infection | 102/2092 | 249/8465 | 7.65e-09 | 1.28e-07 | 8.17e-08 | 102 |
| hsa04962 | Colorectum | AD | Vasopressin-regulated water reabsorption | 19/2092 | 44/8465 | 5.48e-03 | 2.48e-02 | 1.58e-02 | 19 |
| hsa041441 | Colorectum | AD | Endocytosis | 111/2092 | 251/8465 | 5.95e-12 | 1.42e-10 | 9.08e-11 | 111 |
| hsa051321 | Colorectum | AD | Salmonella infection | 102/2092 | 249/8465 | 7.65e-09 | 1.28e-07 | 8.17e-08 | 102 |
| hsa049621 | Colorectum | AD | Vasopressin-regulated water reabsorption | 19/2092 | 44/8465 | 5.48e-03 | 2.48e-02 | 1.58e-02 | 19 |
| hsa041442 | Colorectum | SER | Endocytosis | 81/1580 | 251/8465 | 1.14e-07 | 2.36e-06 | 1.71e-06 | 81 |
| hsa051322 | Colorectum | SER | Salmonella infection | 77/1580 | 249/8465 | 1.56e-06 | 2.35e-05 | 1.71e-05 | 77 |
| hsa041443 | Colorectum | SER | Endocytosis | 81/1580 | 251/8465 | 1.14e-07 | 2.36e-06 | 1.71e-06 | 81 |
| hsa051323 | Colorectum | SER | Salmonella infection | 77/1580 | 249/8465 | 1.56e-06 | 2.35e-05 | 1.71e-05 | 77 |
| hsa041444 | Colorectum | MSS | Endocytosis | 102/1875 | 251/8465 | 1.85e-11 | 4.43e-10 | 2.71e-10 | 102 |
| hsa051324 | Colorectum | MSS | Salmonella infection | 92/1875 | 249/8465 | 5.23e-08 | 9.74e-07 | 5.97e-07 | 92 |
| hsa049622 | Colorectum | MSS | Vasopressin-regulated water reabsorption | 17/1875 | 44/8465 | 9.76e-03 | 3.55e-02 | 2.18e-02 | 17 |
| hsa041445 | Colorectum | MSS | Endocytosis | 102/1875 | 251/8465 | 1.85e-11 | 4.43e-10 | 2.71e-10 | 102 |
| hsa051325 | Colorectum | MSS | Salmonella infection | 92/1875 | 249/8465 | 5.23e-08 | 9.74e-07 | 5.97e-07 | 92 |
| hsa049623 | Colorectum | MSS | Vasopressin-regulated water reabsorption | 17/1875 | 44/8465 | 9.76e-03 | 3.55e-02 | 2.18e-02 | 17 |
| hsa051326 | Colorectum | MSI-H | Salmonella infection | 43/797 | 249/8465 | 5.91e-05 | 8.33e-04 | 6.98e-04 | 43 |
| hsa04145 | Colorectum | MSI-H | Phagosome | 27/797 | 152/8465 | 8.74e-04 | 1.01e-02 | 8.48e-03 | 27 |
| hsa051327 | Colorectum | MSI-H | Salmonella infection | 43/797 | 249/8465 | 5.91e-05 | 8.33e-04 | 6.98e-04 | 43 |
| hsa041451 | Colorectum | MSI-H | Phagosome | 27/797 | 152/8465 | 8.74e-04 | 1.01e-02 | 8.48e-03 | 27 |
| Page: 1 2 3 4 |
Top |
Cell-cell communication analysis |
| Identification of potential cell-cell interactions between two cell types and their ligand-receptor pairs for different disease states |
| Ligand | Receptor | LRpair | Pathway | Tissue | Disease Stage |
| Page: 1 |
Top |
Single-cell gene regulatory network inference analysis |
| Find out the significant the regulons (TFs) and the target genes of each regulon across cell types for different disease states |
| TF | Cell Type | Tissue | Disease Stage | Target Gene | RSS | Regulon Activity |
| ∗The dot plots of a searched regulon are shown for all cell subpopulations in each disease state of each tissue based on the regulon specific score inferred using pySCENIC and by calculating the average expression. |
| Page: 1 |
Top |
Somatic mutation of malignant transformation related genes |
| Annotation of somatic variants for genes involved in malignant transformation |
| Hugo Symbol | Variant Class | Variant Classification | dbSNP RS | HGVSc | HGVSp | HGVSp Short | SWISSPROT | BIOTYPE | SIFT | PolyPhen | Tumor Sample Barcode | Tissue | Histology | Sex | Age | Stage | Therapy Types | Drugs | Outcome |
| RAB5B | SNV | Missense_Mutation | novel | c.592G>T | p.Gly198Cys | p.G198C | P61020 | protein_coding | deleterious(0) | possibly_damaging(0.682) | TCGA-VS-A8EG-01 | Cervix | cervical & endocervical cancer | Female | <65 | I/II | Unknown | Unknown | SD |
| RAB5B | SNV | Missense_Mutation | c.242N>A | p.Arg81Gln | p.R81Q | P61020 | protein_coding | deleterious(0.03) | possibly_damaging(0.693) | TCGA-AF-2687-01 | Colorectum | rectum adenocarcinoma | Male | <65 | III/IV | Chemotherapy | xeloda | PD | |
| RAB5B | SNV | Missense_Mutation | rs531655278 | c.184G>A | p.Val62Ile | p.V62I | P61020 | protein_coding | tolerated(0.43) | benign(0.014) | TCGA-A5-A0G2-01 | Endometrium | uterine corpus endometrioid carcinoma | Female | <65 | III/IV | Unknown | Unknown | SD |
| RAB5B | SNV | Missense_Mutation | rs377046623 | c.589N>T | p.Arg197Trp | p.R197W | P61020 | protein_coding | deleterious(0) | possibly_damaging(0.586) | TCGA-AP-A059-01 | Endometrium | uterine corpus endometrioid carcinoma | Female | >=65 | I/II | Unknown | Unknown | SD |
| RAB5B | SNV | Missense_Mutation | c.535N>G | p.Lys179Glu | p.K179E | P61020 | protein_coding | tolerated(0.12) | benign(0.021) | TCGA-AX-A0J0-01 | Endometrium | uterine corpus endometrioid carcinoma | Female | <65 | I/II | Unknown | Unknown | SD | |
| RAB5B | SNV | Missense_Mutation | c.581N>A | p.Gly194Asp | p.G194D | P61020 | protein_coding | deleterious(0.04) | benign(0.067) | TCGA-D1-A17Q-01 | Endometrium | uterine corpus endometrioid carcinoma | Female | <65 | I/II | Unknown | Unknown | SD | |
| RAB5B | SNV | Missense_Mutation | novel | c.418N>G | p.Lys140Glu | p.K140E | P61020 | protein_coding | tolerated(0.19) | benign(0.015) | TCGA-DI-A1BU-01 | Endometrium | uterine corpus endometrioid carcinoma | Female | <65 | I/II | Chemotherapy | paclitaxel | SD |
| RAB5B | SNV | Missense_Mutation | novel | c.409N>A | p.Leu137Met | p.L137M | P61020 | protein_coding | deleterious(0.04) | possibly_damaging(0.62) | TCGA-EY-A1GU-01 | Endometrium | uterine corpus endometrioid carcinoma | Female | >=65 | I/II | Unknown | Unknown | SD |
| RAB5B | SNV | Missense_Mutation | c.42N>T | p.Gln14His | p.Q14H | P61020 | protein_coding | tolerated(0.13) | benign(0.009) | TCGA-53-7813-01 | Lung | lung adenocarcinoma | Female | <65 | III/IV | Chemotherapy | cisplatin | SD | |
| RAB5B | SNV | Missense_Mutation | c.424N>G | p.Met142Val | p.M142V | P61020 | protein_coding | tolerated(0.24) | benign(0) | TCGA-33-AASI-01 | Lung | lung squamous cell carcinoma | Female | >=65 | I/II | Chemotherapy | taxotere | PD |
| Page: 1 2 |
Top |
Related drugs of malignant transformation related genes |
| Identification of chemicals and drugs interact with genes involved in malignant transfromation |
| (DGIdb 4.0) |
| Entrez ID | Symbol | Category | Interaction Types | Drug Claim Name | Drug Name | PMIDs |
| Page: 1 |

Copyright 2023-Present -The University of Texas Health Science Center at Houston |