Schematic overview of the cellular and molecular mechanisms involved in the cancer progression, including the proposed cellular and molecular mechanisms in cancer cells trajectory. AT1: alveolar type 1 cells; AT2: alveolar type 2 cells; AAH: atypical adenomatous hyperplasia; AIS: adenocarcinoma in situ; MIA: minimally invasive adenocarcinoma; IA: invasive adenocarcinoma; EMT: epithelial-mesenchymal transition

Home

Download

Statistics

Help

Contact

Center for Computational Systems Medicine
leaf

Gene summary

leaf

Malignant transformation analysis

leaf

Malignant transformation related pathway analysis

leaf

Cell-cell communication analysis

leaf

Single-cell gene regulatory network inference analysis

leaf

Somatic mutation of malignant transformation related genes

leaf

Related drugs of malignant transformation related genes

Gene: RAB3IP

Gene summary for RAB3IP

check button Gene summary.

Gene informationSpeciesHuman
Gene symbol

RAB3IP

Gene ID

117177

Gene nameRAB3A interacting protein
Gene AliasRABIN3
Cytomap12q15
Gene Typeprotein-coding
GO ID

GO:0006605

UniProtAcc

Q96QF0


Top

Malignant transformation analysis

check button Identification of the aberrant gene expression in precancerous and cancerous lesions by comparing the gene expression of stem-like cells in diseased tissues with normal stem cells
check button Malignant transformation involving gene list.
Entrez IDSymbolReplicatesSpeciesOrganTissueAdj P-valueLog2FCMalignancy
117177RAB3IPP32T-EHumanEsophagusESCC7.63e-173.24e-010.1666
117177RAB3IPP36T-EHumanEsophagusESCC5.69e-401.61e+000.1187
117177RAB3IPP37T-EHumanEsophagusESCC1.77e-295.29e-010.1371
117177RAB3IPP38T-EHumanEsophagusESCC2.62e-216.76e-010.127
117177RAB3IPP39T-EHumanEsophagusESCC9.02e-326.36e-010.0894
117177RAB3IPP40T-EHumanEsophagusESCC3.91e-154.36e-010.109
117177RAB3IPP42T-EHumanEsophagusESCC1.78e-143.96e-010.1175
117177RAB3IPP44T-EHumanEsophagusESCC2.44e-113.34e-010.1096
117177RAB3IPP47T-EHumanEsophagusESCC1.04e-329.19e-010.1067
117177RAB3IPP48T-EHumanEsophagusESCC2.14e-286.84e-010.0959
117177RAB3IPP49T-EHumanEsophagusESCC2.94e-074.65e-010.1768
117177RAB3IPP52T-EHumanEsophagusESCC1.12e-196.48e-010.1555
117177RAB3IPP54T-EHumanEsophagusESCC1.98e-571.20e+000.0975
117177RAB3IPP56T-EHumanEsophagusESCC9.98e-064.77e-010.1613
117177RAB3IPP57T-EHumanEsophagusESCC2.91e-255.30e-010.0926
117177RAB3IPP61T-EHumanEsophagusESCC1.75e-204.44e-010.099
117177RAB3IPP62T-EHumanEsophagusESCC1.45e-508.51e-010.1302
117177RAB3IPP65T-EHumanEsophagusESCC1.98e-122.98e-010.0978
117177RAB3IPP74T-EHumanEsophagusESCC6.56e-316.94e-010.1479
117177RAB3IPP75T-EHumanEsophagusESCC2.87e-571.20e+000.1125
Page: 1 2 3 4 5 6 

check button Transcriptomic changes along malignancy continuum.
TissueExpression DynamicsAbbreviation
EndometriumThe image shows the transcriptomic changes along malignancy continuum.log2FC in expression of this searched gene in stem-like cells from each diseased tissue sample relative to stem-like cells in normal samples in each tissue plotted against the malignancy continuum. Samples are colored based on if they are from different disease stage.
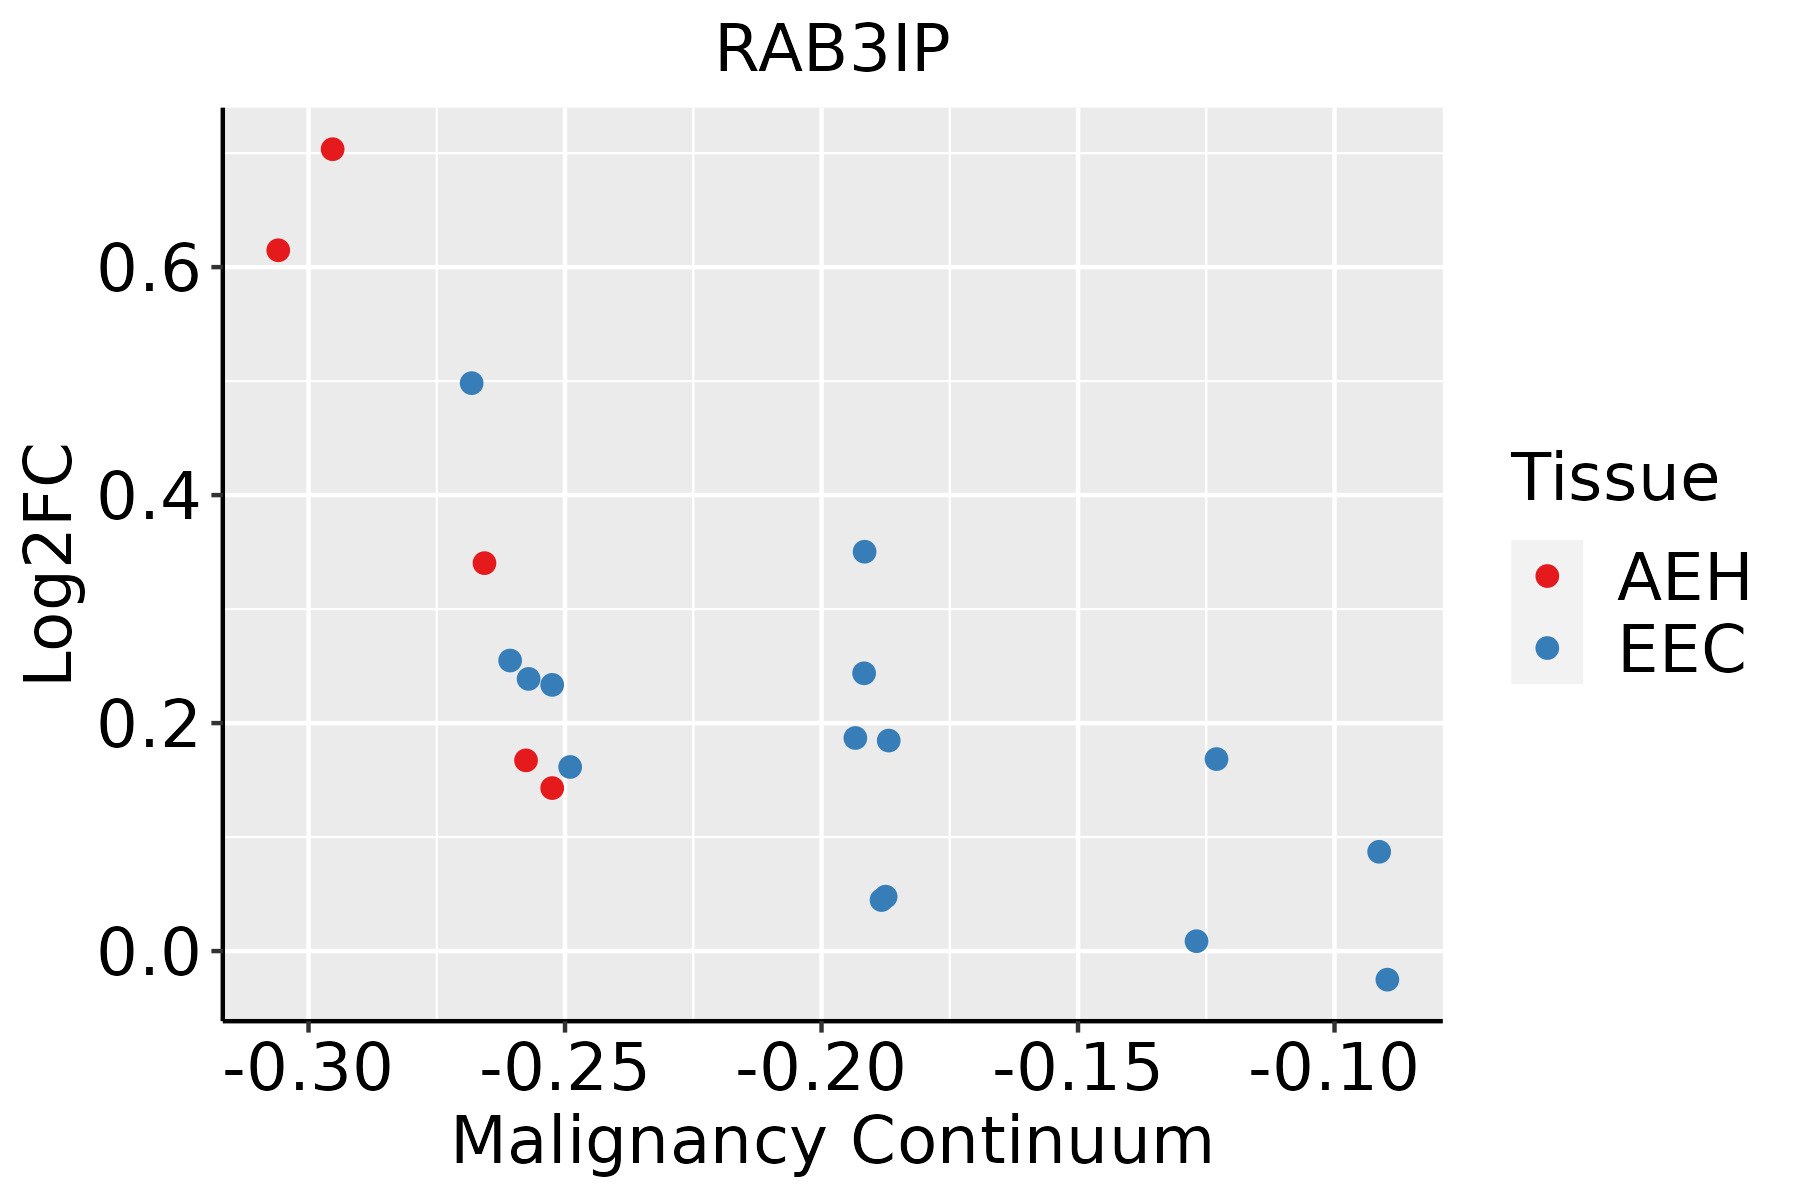
AEH: Atypical endometrial hyperplasia
EEC: Endometrioid Cancer
EsophagusThe image shows the transcriptomic changes along malignancy continuum.log2FC in expression of this searched gene in stem-like cells from each diseased tissue sample relative to stem-like cells in normal samples in each tissue plotted against the malignancy continuum. Samples are colored based on if they are from different disease stage.ESCC: Esophageal squamous cell carcinoma
HGIN: High-grade intraepithelial neoplasias
LGIN: Low-grade intraepithelial neoplasias
LiverThe image shows the transcriptomic changes along malignancy continuum.log2FC in expression of this searched gene in stem-like cells from each diseased tissue sample relative to stem-like cells in normal samples in each tissue plotted against the malignancy continuum. Samples are colored based on if they are from different disease stage.HCC: Hepatocellular carcinoma
NAFLD: Non-alcoholic fatty liver disease
Oral CavityThe image shows the transcriptomic changes along malignancy continuum.log2FC in expression of this searched gene in stem-like cells from each diseased tissue sample relative to stem-like cells in normal samples in each tissue plotted against the malignancy continuum. Samples are colored based on if they are from different disease stage.
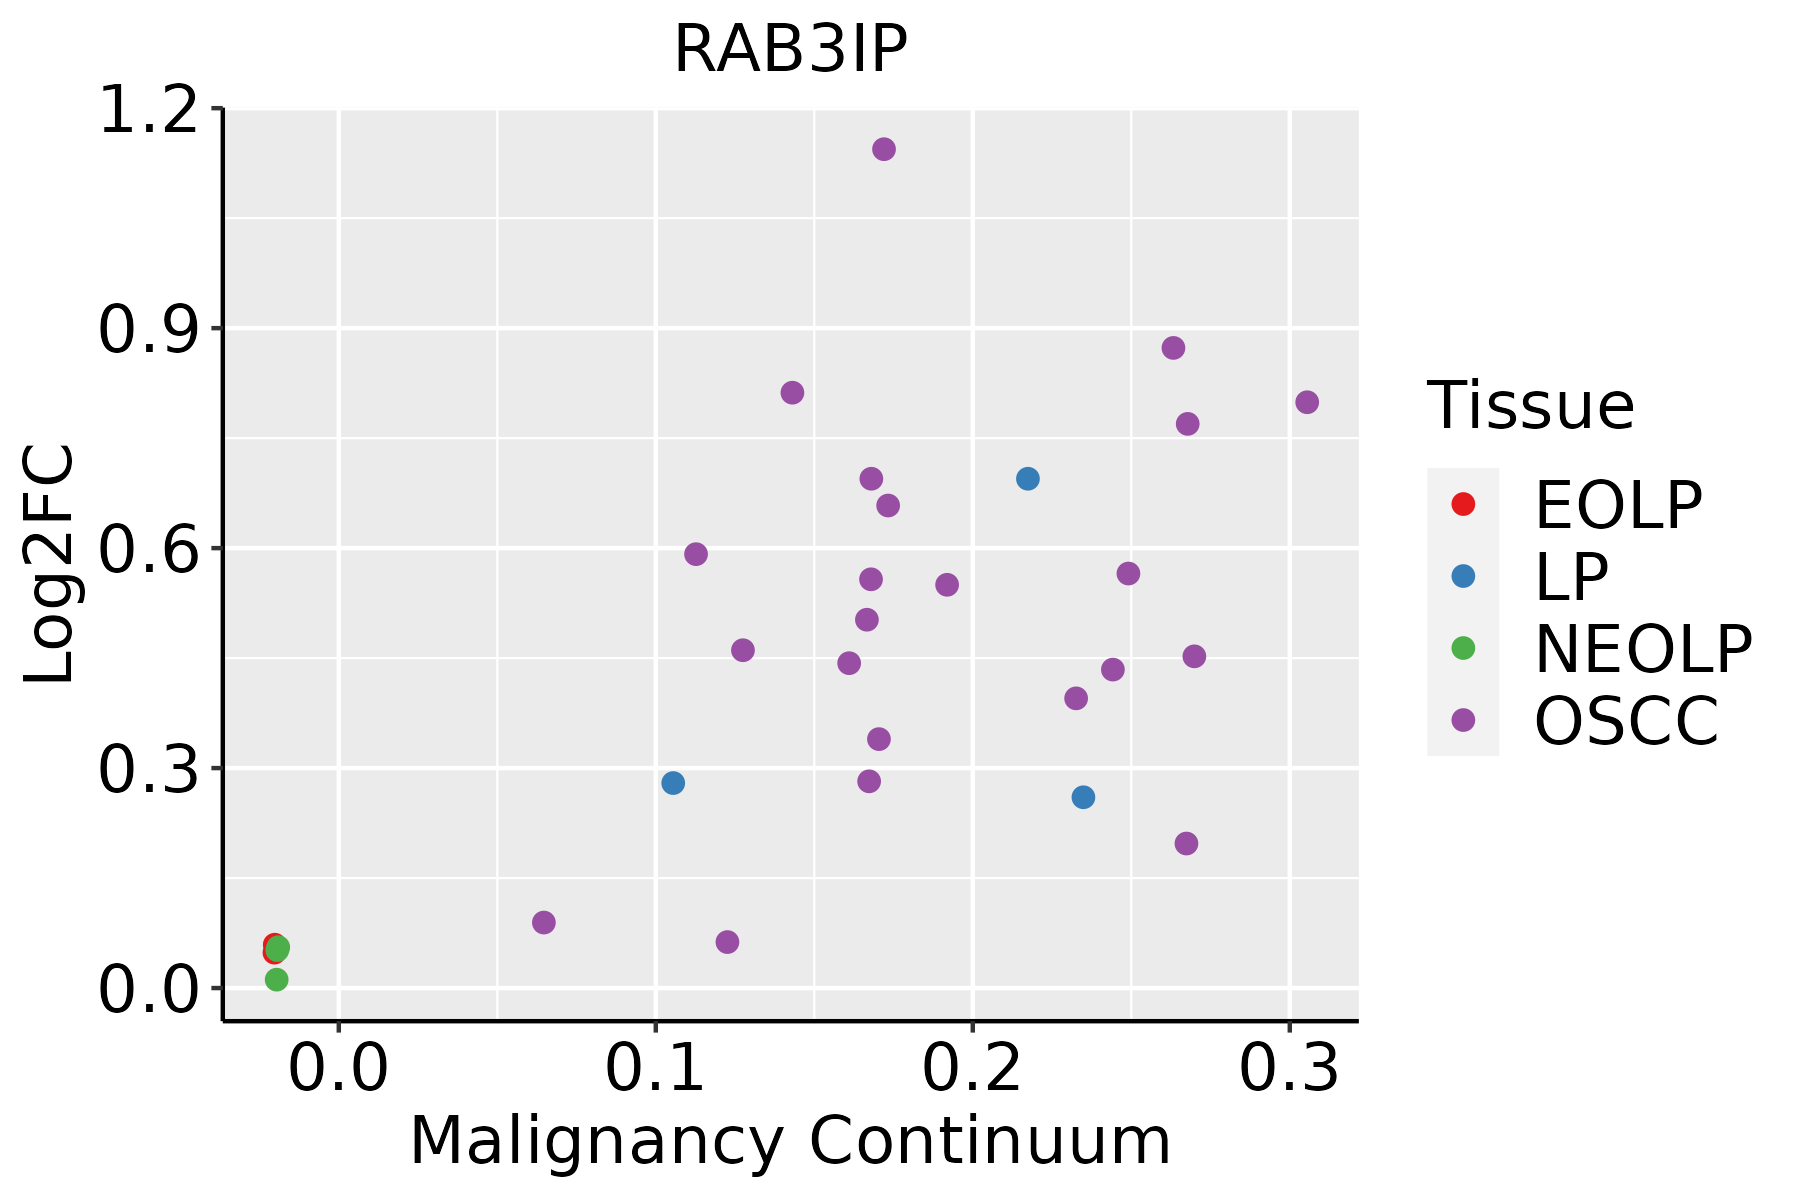
EOLP: Erosive Oral lichen planus
LP: leukoplakia
NEOLP: Non-erosive oral lichen planus
OSCC: Oral squamous cell carcinoma
ThyroidThe image shows the transcriptomic changes along malignancy continuum.log2FC in expression of this searched gene in stem-like cells from each diseased tissue sample relative to stem-like cells in normal samples in each tissue plotted against the malignancy continuum. Samples are colored based on if they are from different disease stage.
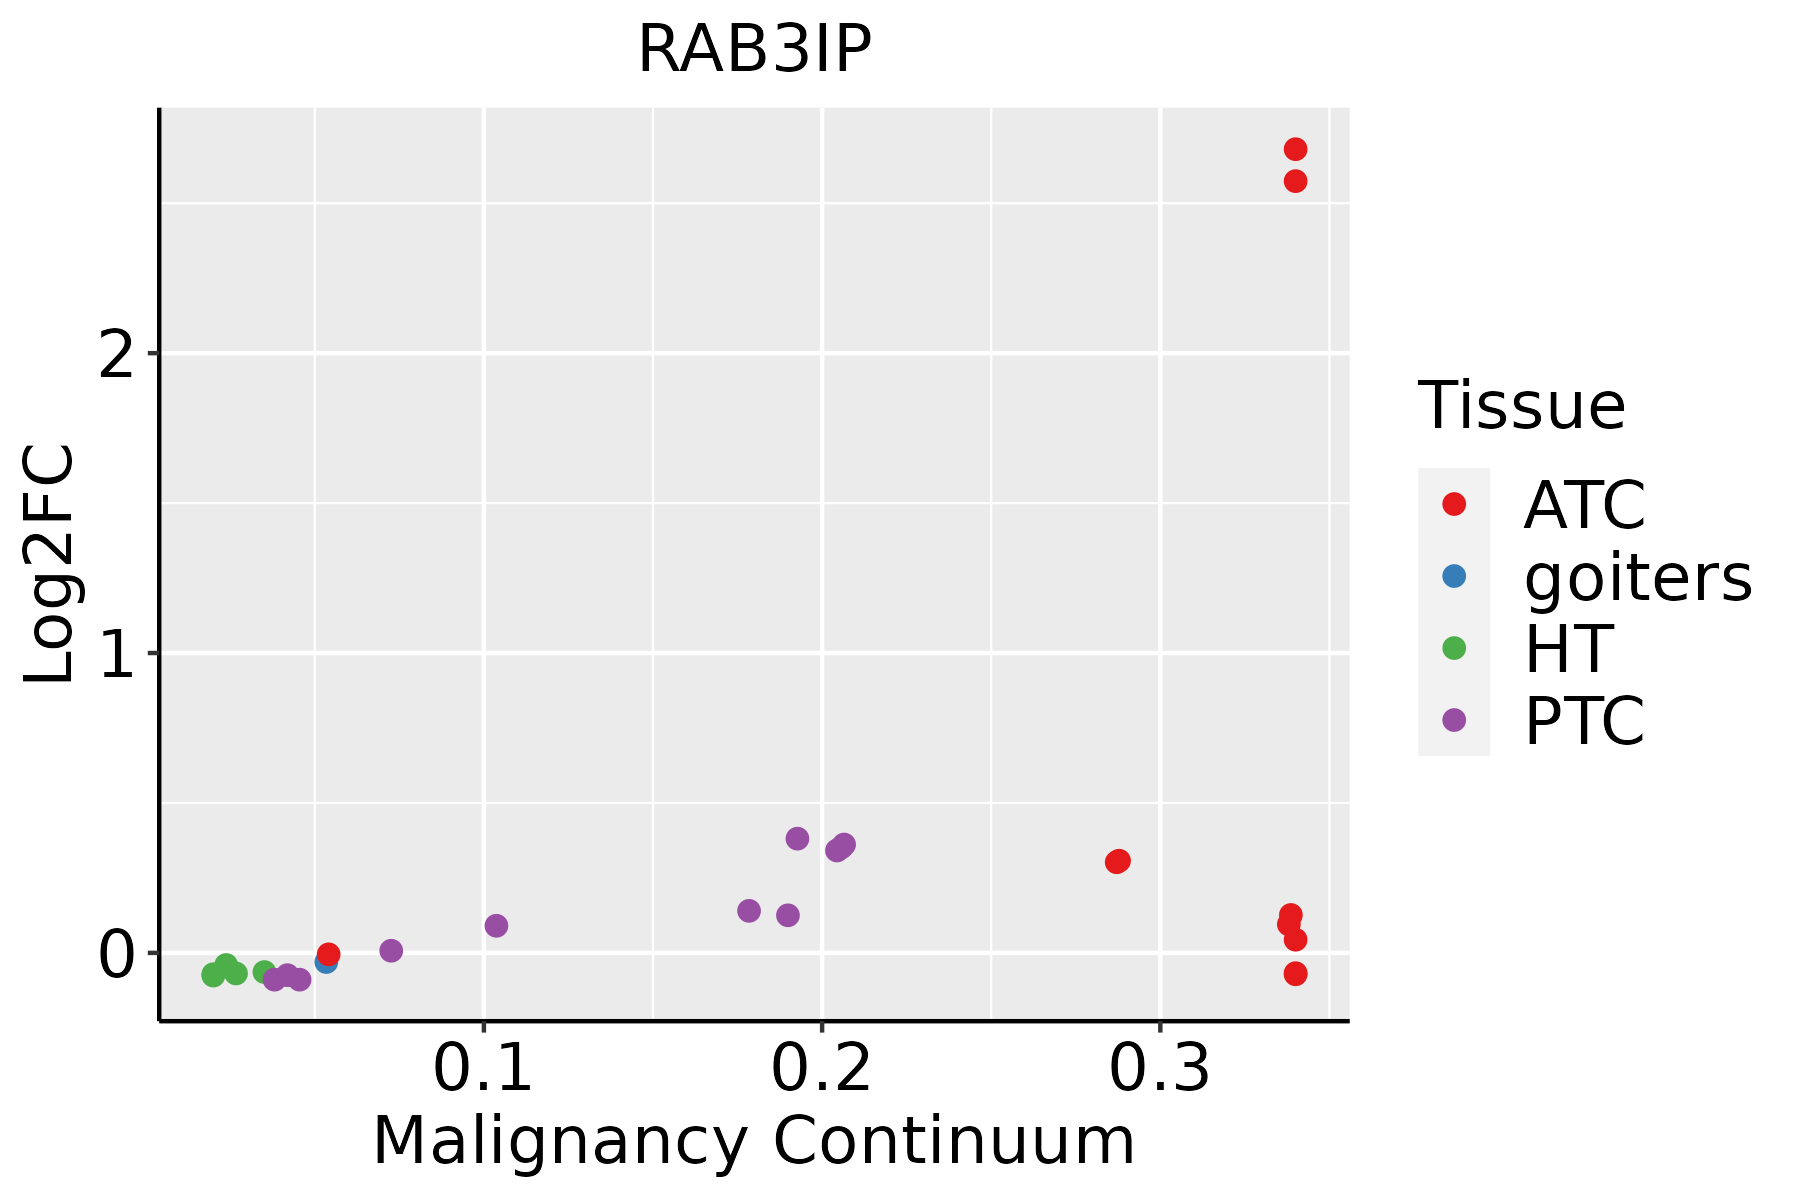
ATC: Anaplastic thyroid cancer
HT: Hashimoto's thyroiditis
PTC: Papillary thyroid cancer
∗log2FC in expression of this searched gene in stem-like cells from each diseased tissue sample relative to stem-like cells in normal samples in each tissue plotted against the malignancy continuum. Samples are colored based on if they are from different disease stage.

Top

Malignant transformation related pathway analysis

check buttonFind out the enriched GO biological processes and KEGG pathways involved in transition from healthy to precancer to cancer
check button Figure of enriched GO biological processes.
TissueDisease StageEnriched GO biological Processes
ColorectumADGO analysis - Figure of enriched GO biological processes: Top 15 enriched GO BP terms are showed in the bar plot of each disease state in each tissue. Each row represents a significant GO biological process which is colored according to the -log10(p.adjust).
ColorectumSERGO analysis - Figure of enriched GO biological processes: Top 15 enriched GO BP terms are showed in the bar plot of each disease state in each tissue. Each row represents a significant GO biological process which is colored according to the -log10(p.adjust).
ColorectumMSSGO analysis - Figure of enriched GO biological processes: Top 15 enriched GO BP terms are showed in the bar plot of each disease state in each tissue. Each row represents a significant GO biological process which is colored according to the -log10(p.adjust).
ColorectumMSI-HGO analysis - Figure of enriched GO biological processes: Top 15 enriched GO BP terms are showed in the bar plot of each disease state in each tissue. Each row represents a significant GO biological process which is colored according to the -log10(p.adjust).
ColorectumFAPGO analysis - Figure of enriched GO biological processes: Top 15 enriched GO BP terms are showed in the bar plot of each disease state in each tissue. Each row represents a significant GO biological process which is colored according to the -log10(p.adjust).
∗Top 15 enriched GO BP terms are showed in the bar plot of each disease state in each tissue. Each row represents a significant GO biological process which is colored according to the -log10(p.adjust).
Page: 1 2 3 4 5 6 7 8 9 

check button Enriched GO biological processes.
GO IDTissueDisease StageDescriptionGene RatioBg Ratiopvaluep.adjustCount
GO:000660516EndometriumAEHprotein targeting68/2100314/187236.30e-083.38e-0668
GO:009015010EndometriumAEHestablishment of protein localization to membrane51/2100260/187234.74e-057.85e-0451
GO:000660517EndometriumEECprotein targeting69/2168314/187239.61e-084.69e-0669
GO:009015015EndometriumEECestablishment of protein localization to membrane52/2168260/187235.46e-058.64e-0452
GO:0006605111EsophagusESCCprotein targeting229/8552314/187234.93e-231.01e-20229
GO:0090150110EsophagusESCCestablishment of protein localization to membrane182/8552260/187231.27e-158.19e-14182
GO:00224069EsophagusESCCmembrane docking62/855286/187235.93e-077.79e-0662
GO:00066124EsophagusESCCprotein targeting to membrane83/8552131/187233.31e-052.73e-0483
GO:01400567EsophagusESCCorganelle localization by membrane tethering53/855277/187233.33e-052.74e-0453
GO:00066057LiverCirrhoticprotein targeting148/4634314/187233.86e-186.20e-16148
GO:00901507LiverCirrhoticestablishment of protein localization to membrane123/4634260/187231.85e-152.15e-13123
GO:00224065LiverCirrhoticmembrane docking39/463486/187232.47e-053.22e-0439
GO:00066122LiverCirrhoticprotein targeting to membrane53/4634131/187235.17e-055.95e-0453
GO:01400565LiverCirrhoticorganelle localization by membrane tethering32/463477/187238.65e-046.23e-0332
GO:000660512LiverHCCprotein targeting219/7958314/187237.74e-231.49e-20219
GO:009015012LiverHCCestablishment of protein localization to membrane168/7958260/187234.07e-132.13e-11168
GO:002240611LiverHCCmembrane docking57/795886/187237.14e-068.47e-0557
GO:014005611LiverHCCorganelle localization by membrane tethering49/795877/187231.46e-041.18e-0349
GO:00066121LiverHCCprotein targeting to membrane75/7958131/187234.58e-043.04e-0375
GO:000660520Oral cavityOSCCprotein targeting204/7305314/187236.78e-211.13e-18204
Page: 1 2 

check button Enriched KEGG pathways.
Pathway IDTissueDisease StageDescriptionGene RatioBg Ratiopvaluep.adjustqvalueCount
Page: 1 

Top

Cell-cell communication analysis

check buttonIdentification of potential cell-cell interactions between two cell types and their ligand-receptor pairs for different disease states
LigandReceptorLRpairPathwayTissueDisease Stage
Page: 1 

Top

Single-cell gene regulatory network inference analysis

check buttonFind out the significant the regulons (TFs) and the target genes of each regulon across cell types for different disease states
TFCell TypeTissueDisease StageTarget GeneRSSRegulon Activity
∗The dot plots of a searched regulon are shown for all cell subpopulations in each disease state of each tissue based on the regulon specific score inferred using pySCENIC and by calculating the average expression.
Page: 1 

Top

Somatic mutation of malignant transformation related genes

check buttonAnnotation of somatic variants for genes involved in malignant transformation
Hugo SymbolVariant ClassVariant ClassificationdbSNP RSHGVScHGVSpHGVSp ShortSWISSPROTBIOTYPESIFTPolyPhenTumor Sample BarcodeTissueHistologySexAgeStageTherapy TypesDrugsOutcome
RAB3IPSNVMissense_Mutationnovelc.1380N>Cp.Leu460Phep.L460FQ96QF0protein_codingdeleterious(0.01)probably_damaging(0.994)TCGA-BH-A0B6-01Breastbreast invasive carcinomaFemale<65I/IIUnknownUnknownSD
RAB3IPSNVMissense_Mutationc.139C>Gp.Gln47Glup.Q47EQ96QF0protein_codingtolerated_low_confidence(0.24)benign(0.039)TCGA-GM-A2DH-01Breastbreast invasive carcinomaFemale<65I/IIChemotherapytaxolCR
RAB3IPinsertionIn_Frame_Insnovelc.1055_1056insTCTACCTTTTGATGTTTTTTGTCAATTTTTp.Ser352_Lys353insLeuProPheAspValPheCysGlnPheLeup.S352_K353insLPFDVFCQFLQ96QF0protein_codingTCGA-A8-A0A6-01Breastbreast invasive carcinomaFemale<65III/IVChemotherapyepirubicinCR
RAB3IPSNVMissense_Mutationc.582N>Cp.Glu194Aspp.E194DQ96QF0protein_codingdeleterious(0)probably_damaging(0.989)TCGA-C5-A1ME-01Cervixcervical & endocervical cancerFemale<65I/IIUnknownUnknownSD
RAB3IPSNVMissense_Mutationrs575263311c.803N>Tp.Thr268Metp.T268MQ96QF0protein_codingtolerated(0.1)possibly_damaging(0.806)TCGA-EA-A410-01Cervixcervical & endocervical cancerFemale<65I/IIUnknownUnknownSD
RAB3IPSNVMissense_Mutationc.751N>Cp.Glu251Glnp.E251QQ96QF0protein_codingdeleterious(0)probably_damaging(0.996)TCGA-VS-A958-01Cervixcervical & endocervical cancerFemale<65I/IIChemotherapycisplatinCR
RAB3IPSNVMissense_Mutationc.790N>Ap.Pro264Thrp.P264TQ96QF0protein_codingdeleterious(0)probably_damaging(0.999)TCGA-A6-6653-01Colorectumcolon adenocarcinomaMale>=65I/IIUnknownUnknownSD
RAB3IPSNVMissense_Mutationnovelc.1063N>Cp.Glu355Glnp.E355QQ96QF0protein_codingdeleterious(0.03)probably_damaging(0.986)TCGA-AM-5820-01Colorectumcolon adenocarcinomaFemale<65I/IIUnknownUnknownSD
RAB3IPSNVMissense_Mutationnovelc.12N>Cp.Lys4Asnp.K4NQ96QF0protein_codingtolerated_low_confidence(0.21)benign(0)TCGA-AZ-4315-01Colorectumcolon adenocarcinomaMale<65I/IIUnknownUnknownSD
RAB3IPSNVMissense_Mutationrs200501608c.479N>Ap.Arg160Hisp.R160HQ96QF0protein_codingtolerated(0.11)benign(0.007)TCGA-AZ-6601-01Colorectumcolon adenocarcinomaMale>=65I/IIUnknownUnknownPD
Page: 1 2 3 4 5 6 7 

Top

Related drugs of malignant transformation related genes

check buttonIdentification of chemicals and drugs interact with genes involved in malignant transfromation
(DGIdb 4.0)
Entrez IDSymbolCategoryInteraction TypesDrug Claim NameDrug NamePMIDs
Page: 1