
|
|||||
|
 | |
| |
| |
| |
| |
| |
|
Gene: RAB18 |
Gene summary for RAB18 |
| Gene information | Species | Human | Gene symbol | RAB18 | Gene ID | 22931 |
| Gene name | RAB18, member RAS oncogene family | |
| Gene Alias | RAB18LI1 | |
| Cytomap | 10p12.1 | |
| Gene Type | protein-coding | GO ID | GO:0001654 | UniProtAcc | Q9NP72 |
Top |
Malignant transformation analysis |
| Identification of the aberrant gene expression in precancerous and cancerous lesions by comparing the gene expression of stem-like cells in diseased tissues with normal stem cells |
| Entrez ID | Symbol | Replicates | Species | Organ | Tissue | Adj P-value | Log2FC | Malignancy |
| 22931 | RAB18 | P48T-E | Human | Esophagus | ESCC | 1.94e-15 | 3.85e-01 | 0.0959 |
| 22931 | RAB18 | P49T-E | Human | Esophagus | ESCC | 5.21e-22 | 2.30e+00 | 0.1768 |
| 22931 | RAB18 | P52T-E | Human | Esophagus | ESCC | 1.23e-23 | 7.32e-01 | 0.1555 |
| 22931 | RAB18 | P54T-E | Human | Esophagus | ESCC | 2.16e-23 | 5.59e-01 | 0.0975 |
| 22931 | RAB18 | P56T-E | Human | Esophagus | ESCC | 7.47e-04 | 1.08e+00 | 0.1613 |
| 22931 | RAB18 | P57T-E | Human | Esophagus | ESCC | 2.16e-17 | 3.37e-01 | 0.0926 |
| 22931 | RAB18 | P61T-E | Human | Esophagus | ESCC | 1.50e-23 | 1.03e+00 | 0.099 |
| 22931 | RAB18 | P62T-E | Human | Esophagus | ESCC | 5.61e-30 | 6.42e-01 | 0.1302 |
| 22931 | RAB18 | P65T-E | Human | Esophagus | ESCC | 2.69e-18 | 3.25e-01 | 0.0978 |
| 22931 | RAB18 | P74T-E | Human | Esophagus | ESCC | 6.30e-45 | 1.34e+00 | 0.1479 |
| 22931 | RAB18 | P75T-E | Human | Esophagus | ESCC | 1.01e-24 | 5.12e-01 | 0.1125 |
| 22931 | RAB18 | P76T-E | Human | Esophagus | ESCC | 8.33e-17 | 3.49e-01 | 0.1207 |
| 22931 | RAB18 | P79T-E | Human | Esophagus | ESCC | 7.39e-27 | 4.28e-01 | 0.1154 |
| 22931 | RAB18 | P80T-E | Human | Esophagus | ESCC | 1.92e-25 | 1.03e+00 | 0.155 |
| 22931 | RAB18 | P82T-E | Human | Esophagus | ESCC | 8.90e-16 | 1.16e+00 | 0.1072 |
| 22931 | RAB18 | P83T-E | Human | Esophagus | ESCC | 2.49e-47 | 1.79e+00 | 0.1738 |
| 22931 | RAB18 | P84T-E | Human | Esophagus | ESCC | 2.29e-06 | 4.60e-01 | 0.0933 |
| 22931 | RAB18 | P89T-E | Human | Esophagus | ESCC | 1.86e-10 | 1.23e+00 | 0.1752 |
| 22931 | RAB18 | P91T-E | Human | Esophagus | ESCC | 2.44e-17 | 2.42e+00 | 0.1828 |
| 22931 | RAB18 | P107T-E | Human | Esophagus | ESCC | 7.61e-34 | 8.30e-01 | 0.171 |
| Page: 1 2 3 4 5 6 7 |
| Tissue | Expression Dynamics | Abbreviation |
| Esophagus | 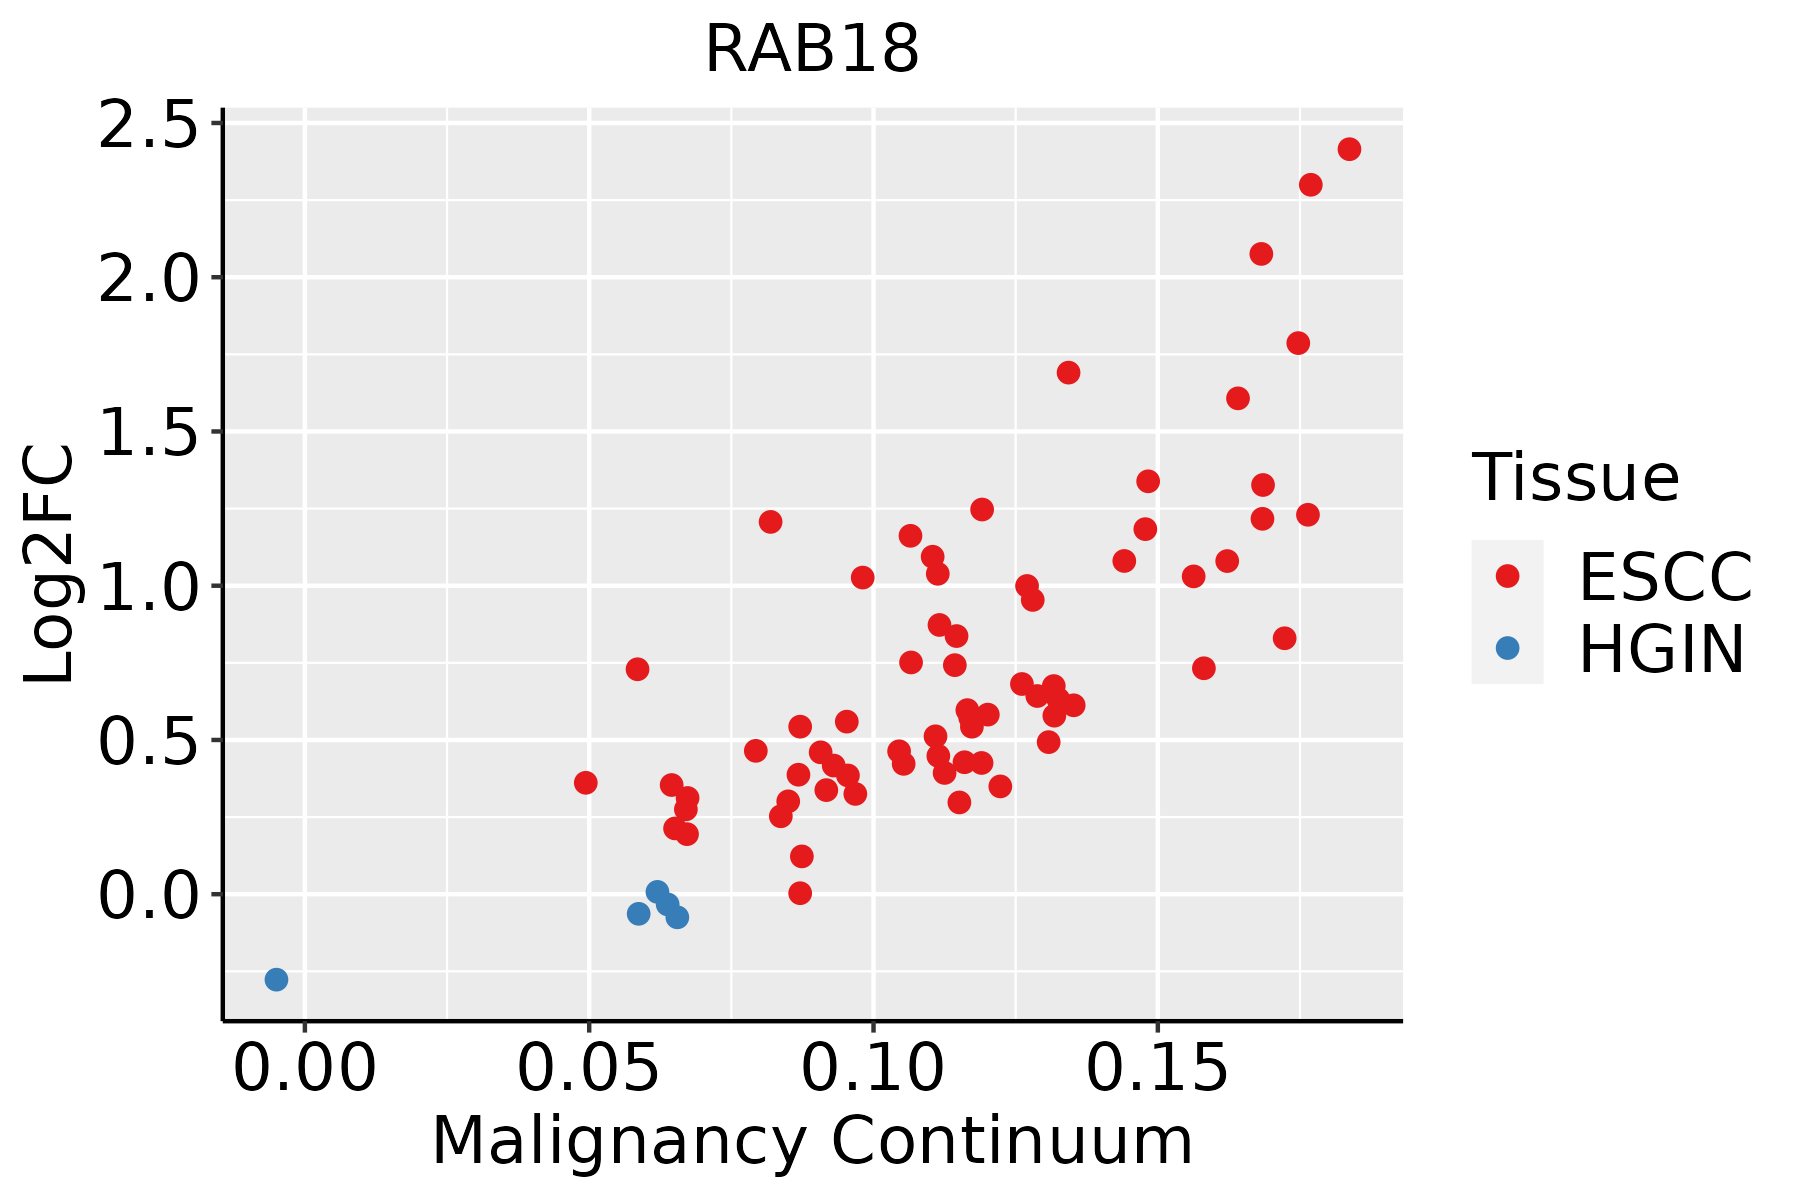 | ESCC: Esophageal squamous cell carcinoma |
| HGIN: High-grade intraepithelial neoplasias | ||
| LGIN: Low-grade intraepithelial neoplasias | ||
| Liver | 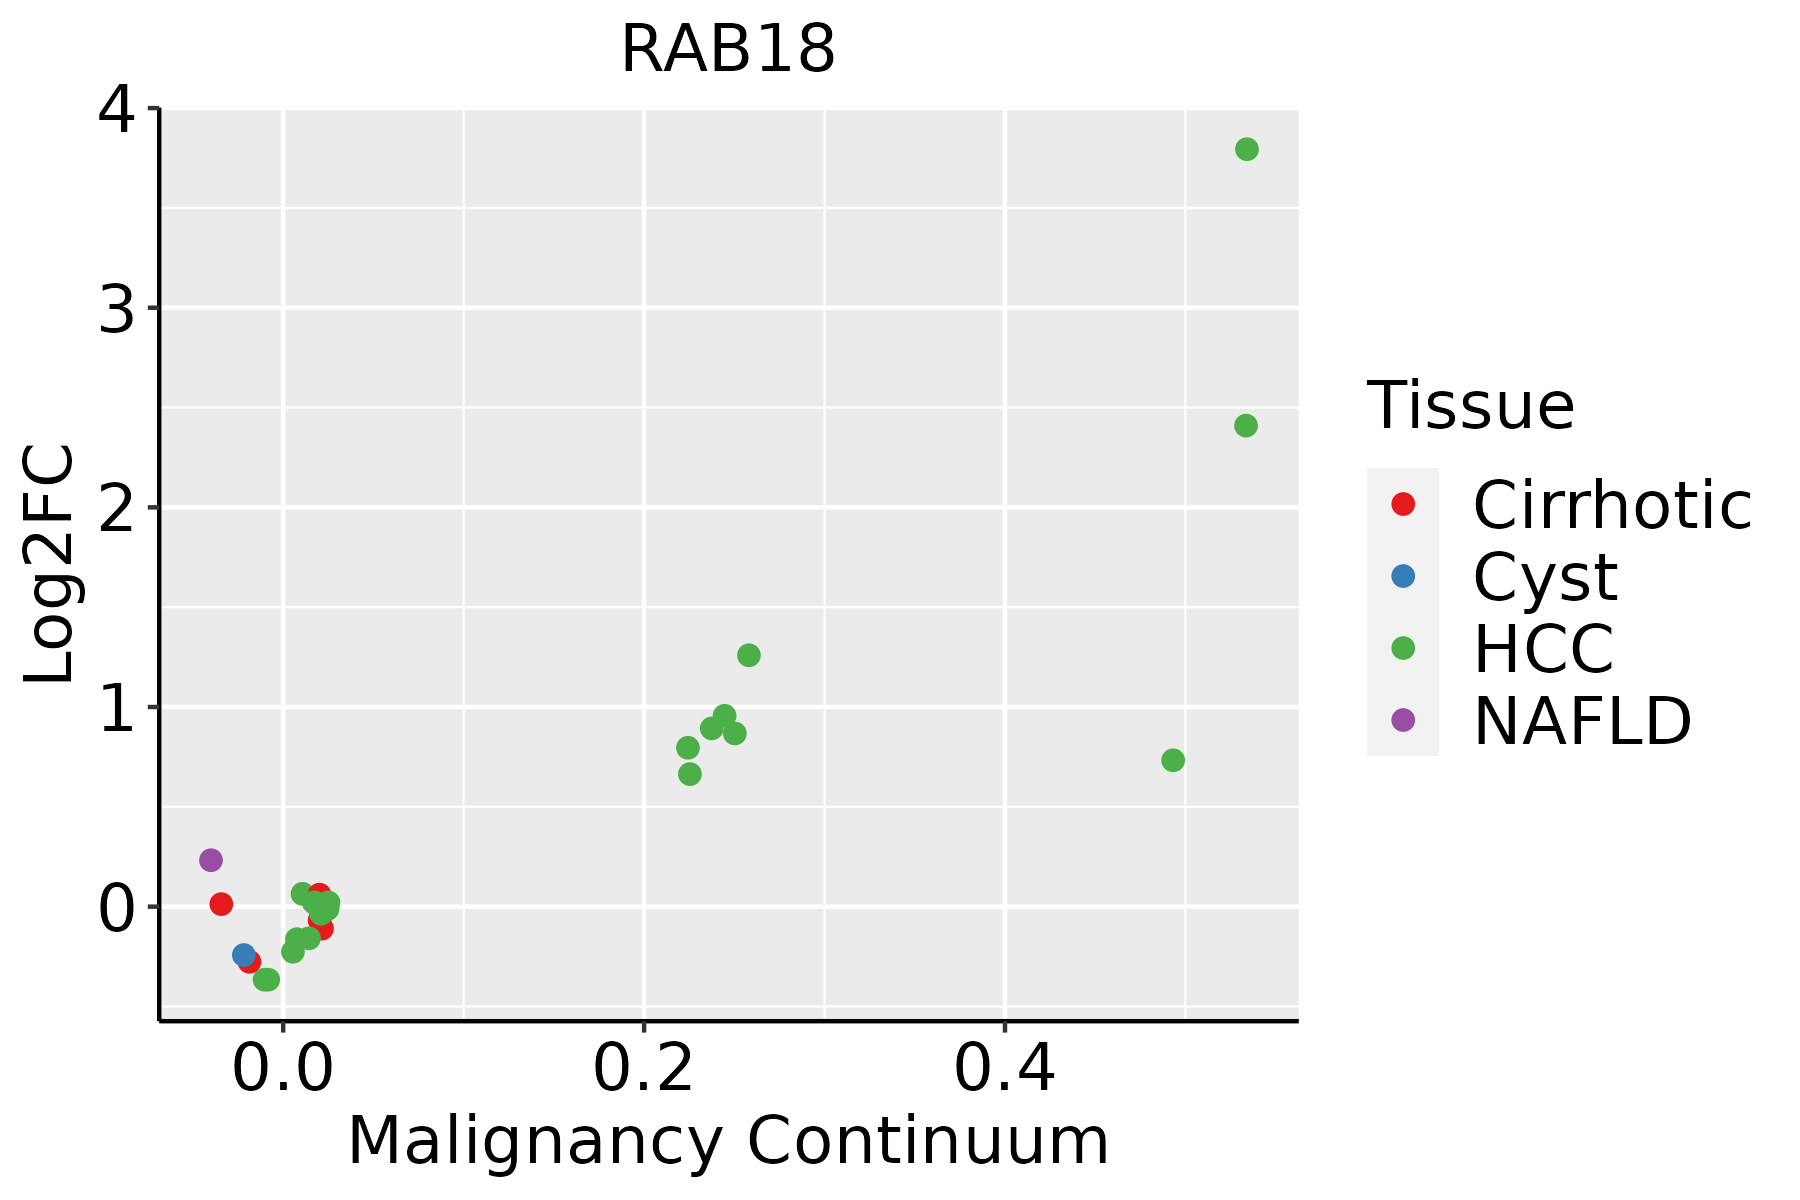 | HCC: Hepatocellular carcinoma |
| NAFLD: Non-alcoholic fatty liver disease | ||
| Oral Cavity | 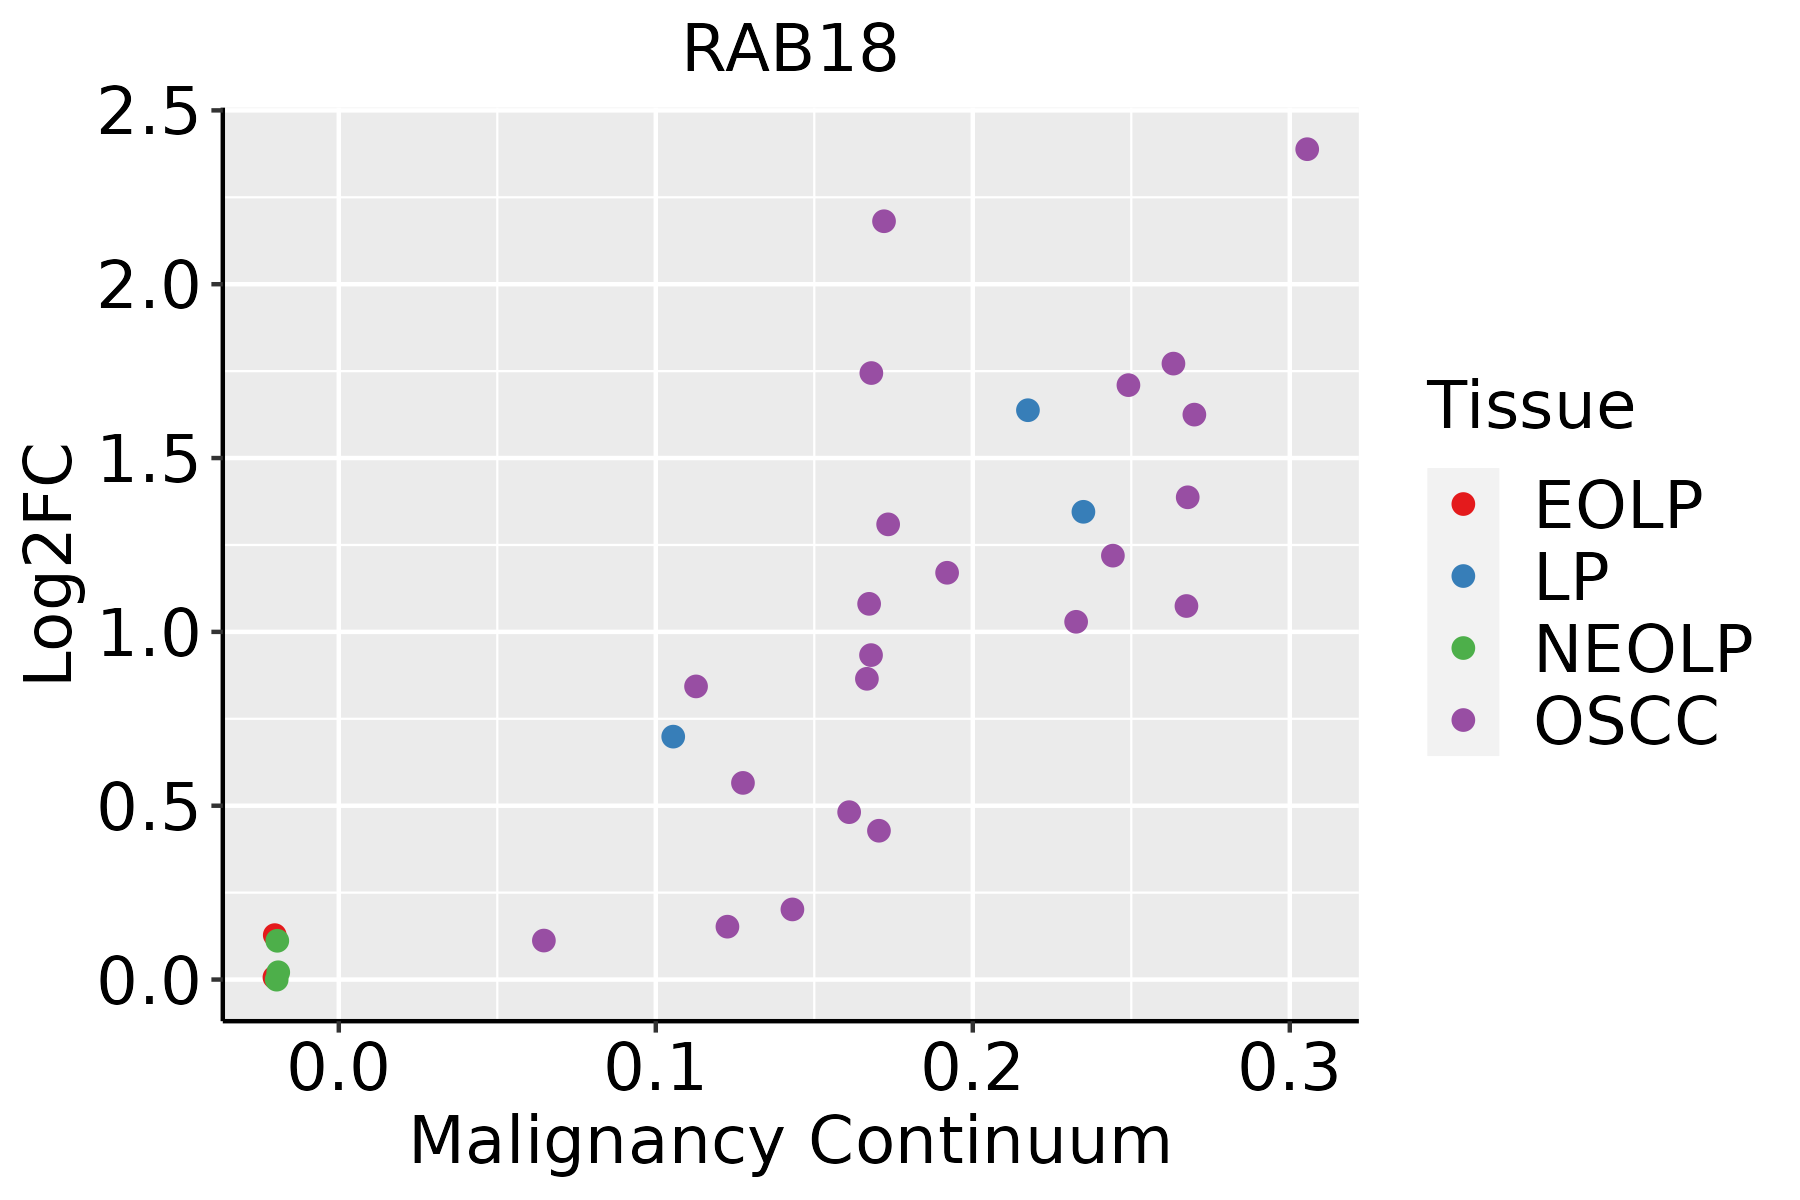 | EOLP: Erosive Oral lichen planus |
| LP: leukoplakia | ||
| NEOLP: Non-erosive oral lichen planus | ||
| OSCC: Oral squamous cell carcinoma | ||
| Prostate | 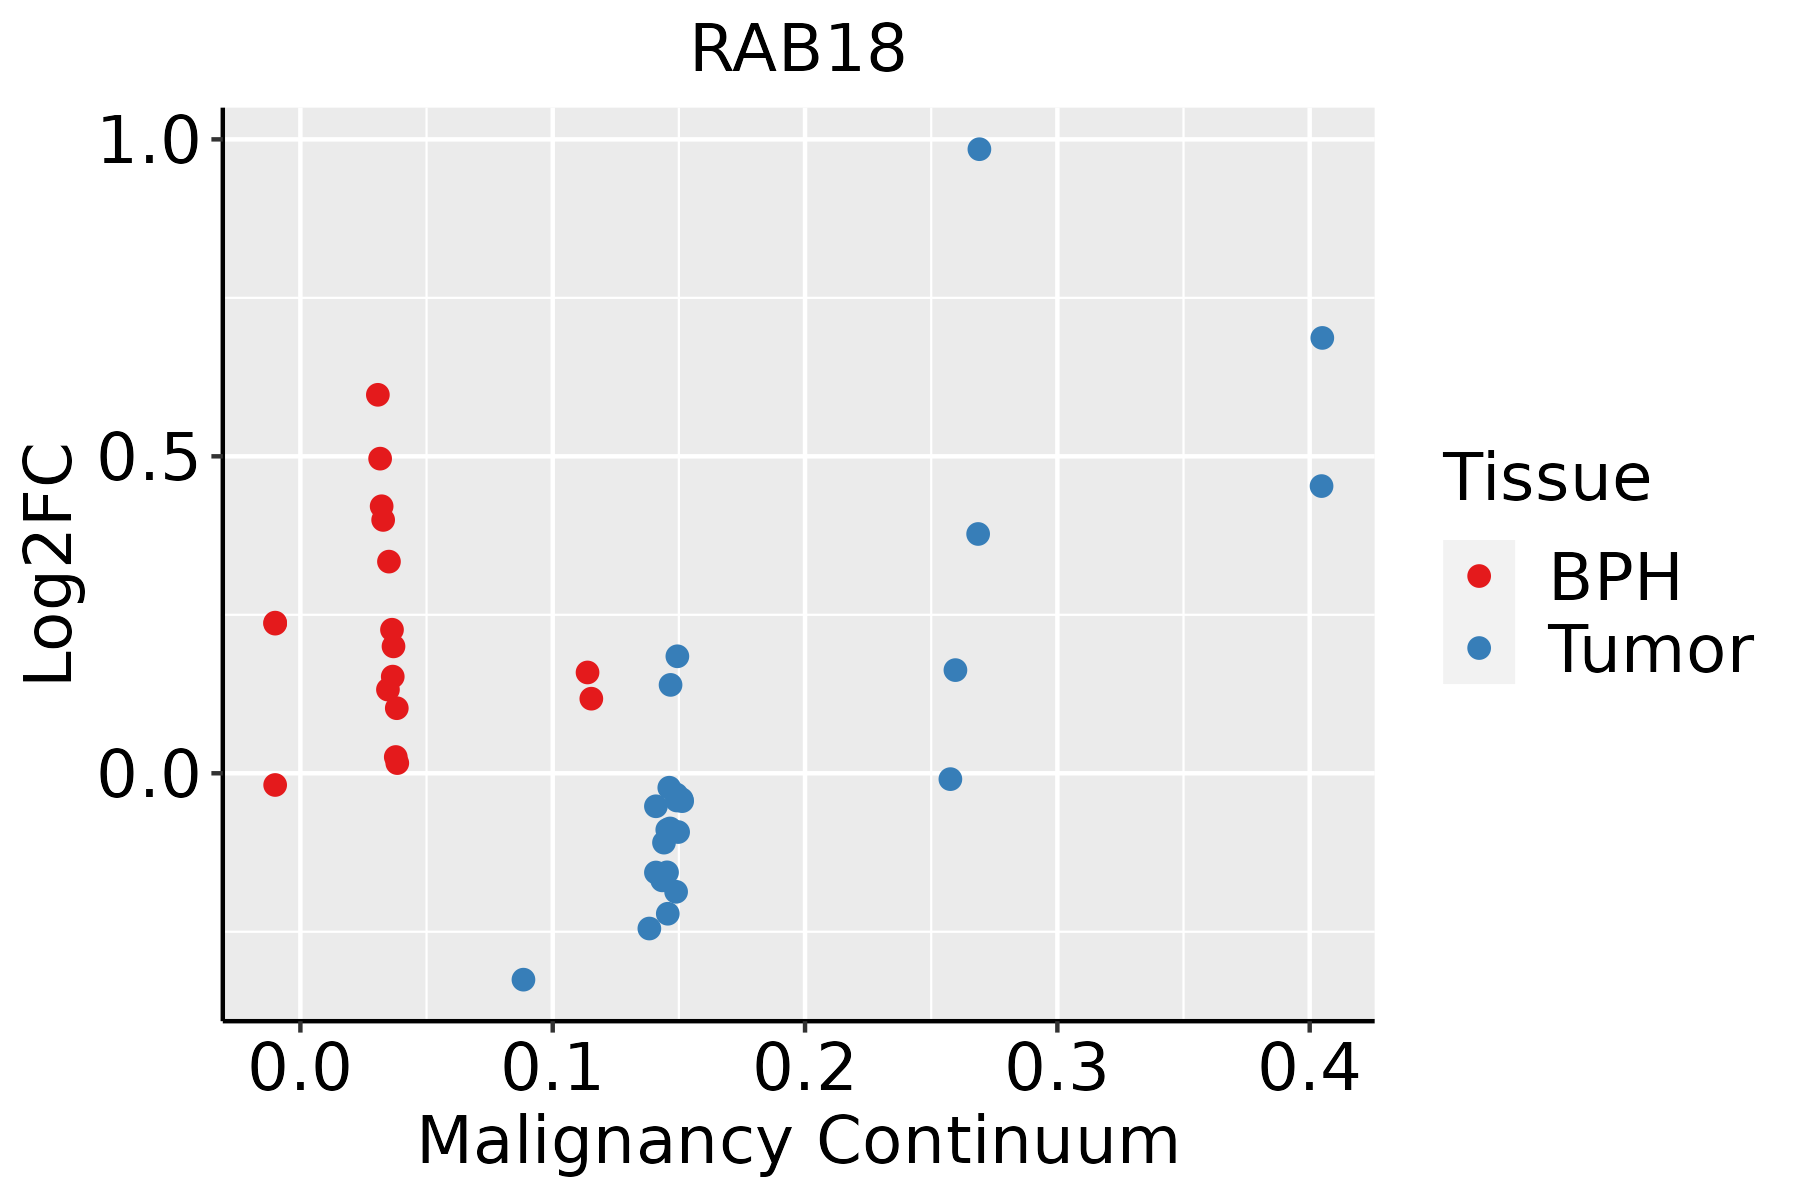 | BPH: Benign Prostatic Hyperplasia |
| Skin | 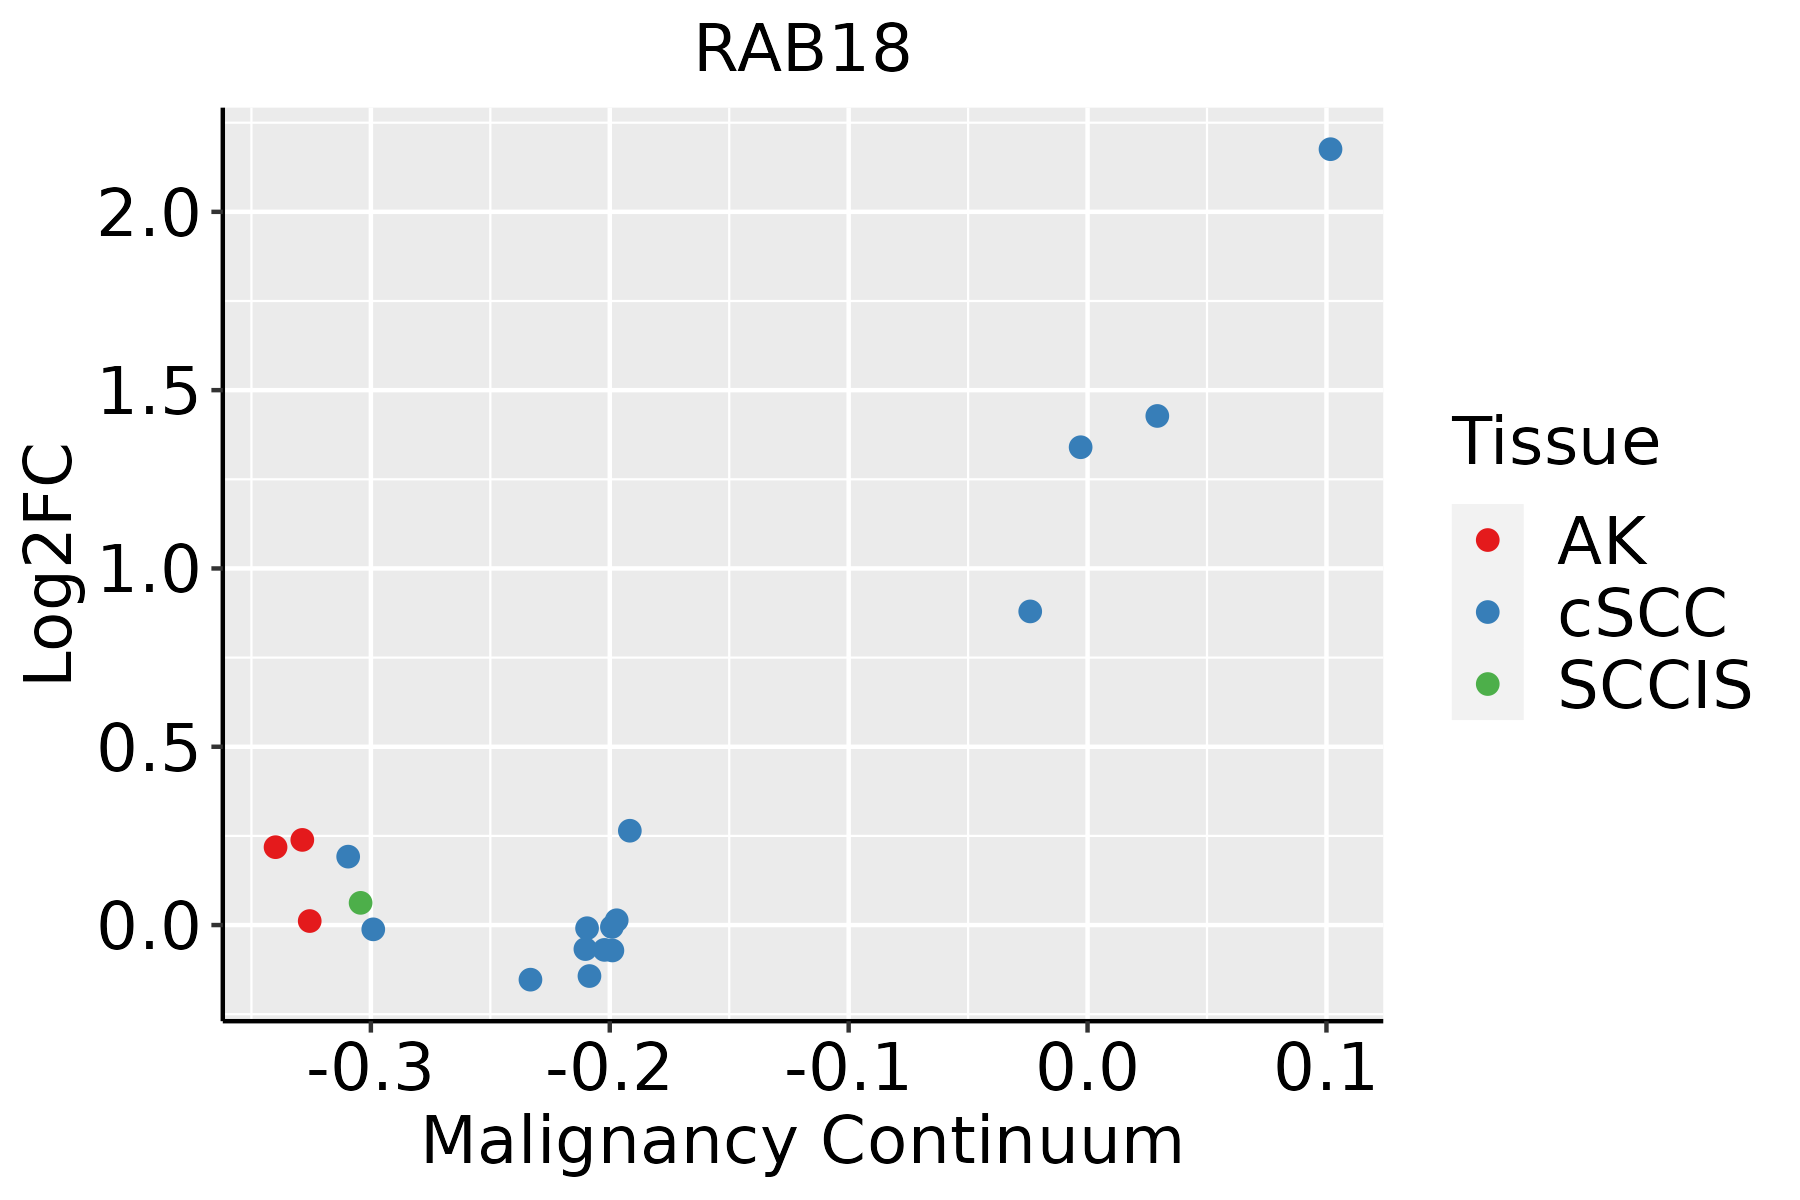 | AK: Actinic keratosis |
| cSCC: Cutaneous squamous cell carcinoma | ||
| SCCIS:squamous cell carcinoma in situ | ||
| Thyroid | 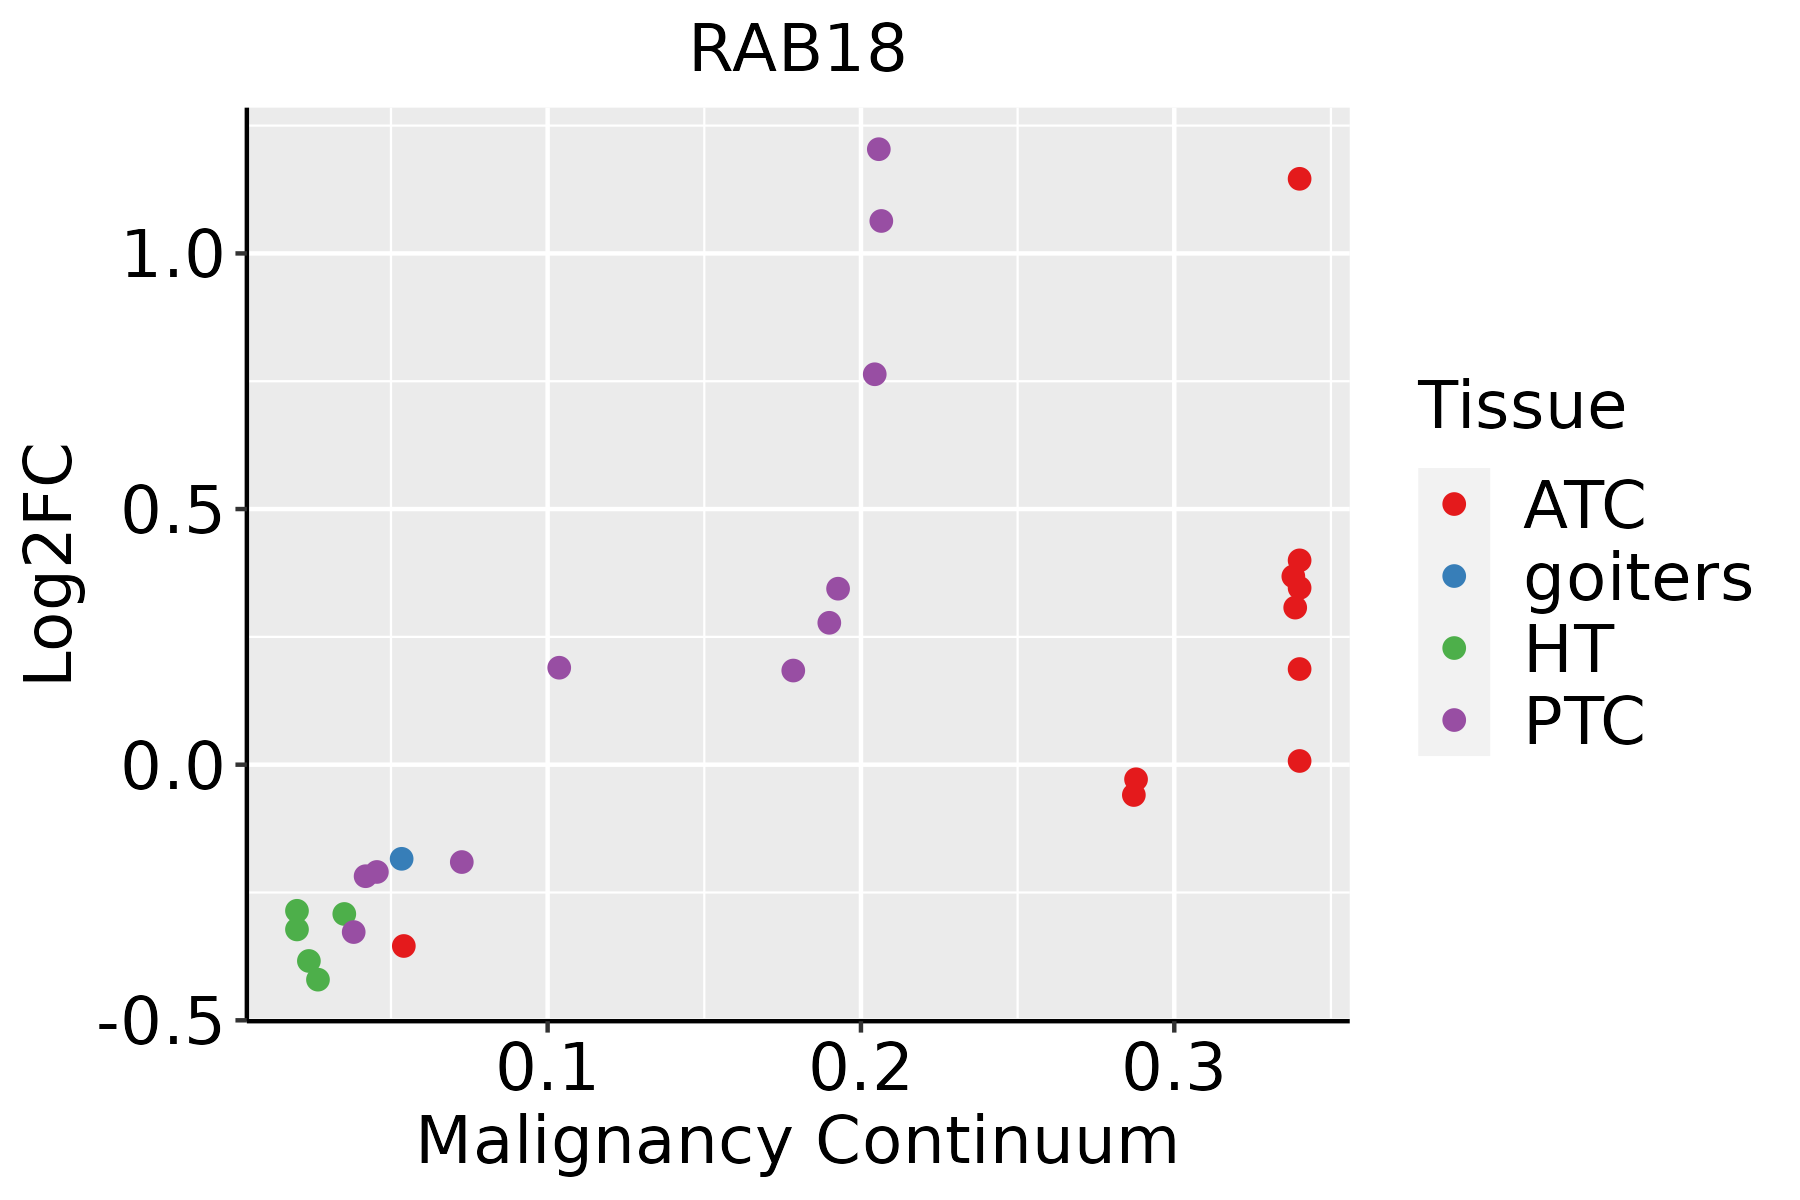 | ATC: Anaplastic thyroid cancer |
| HT: Hashimoto's thyroiditis | ||
| PTC: Papillary thyroid cancer |
| ∗log2FC in expression of this searched gene in stem-like cells from each diseased tissue sample relative to stem-like cells in normal samples in each tissue plotted against the malignancy continuum. Samples are colored based on if they are from different disease stage. |
Top |
Malignant transformation related pathway analysis |
| Find out the enriched GO biological processes and KEGG pathways involved in transition from healthy to precancer to cancer |
| Tissue | Disease Stage | Enriched GO biological Processes |
| Colorectum | AD |  |
| Colorectum | SER |  |
| Colorectum | MSS |  |
| Colorectum | MSI-H |  |
| Colorectum | FAP |  |
| ∗Top 15 enriched GO BP terms are showed in the bar plot of each disease state in each tissue. Each row represents a significant GO biological process which is colored according to the -log10(p.adjust). |
| Page: 1 2 3 4 5 6 7 8 9 |
| GO ID | Tissue | Disease Stage | Description | Gene Ratio | Bg Ratio | pvalue | p.adjust | Count |
| GO:000702914 | Esophagus | ESCC | endoplasmic reticulum organization | 65/8552 | 87/18723 | 3.28e-08 | 6.08e-07 | 65 |
| GO:00717865 | Esophagus | ESCC | endoplasmic reticulum tubular network organization | 15/8552 | 18/18723 | 1.20e-03 | 5.88e-03 | 15 |
| GO:00070292 | Liver | Cirrhotic | endoplasmic reticulum organization | 42/4634 | 87/18723 | 1.67e-06 | 3.22e-05 | 42 |
| GO:00717861 | Liver | Cirrhotic | endoplasmic reticulum tubular network organization | 11/4634 | 18/18723 | 1.13e-03 | 7.73e-03 | 11 |
| GO:000702911 | Liver | HCC | endoplasmic reticulum organization | 64/7958 | 87/18723 | 3.92e-09 | 1.04e-07 | 64 |
| GO:00717862 | Liver | HCC | endoplasmic reticulum tubular network organization | 15/7958 | 18/18723 | 4.74e-04 | 3.12e-03 | 15 |
| GO:00070294 | Oral cavity | OSCC | endoplasmic reticulum organization | 58/7305 | 87/18723 | 1.59e-07 | 2.61e-06 | 58 |
| GO:00717864 | Oral cavity | OSCC | endoplasmic reticulum tubular network organization | 14/7305 | 18/18723 | 9.51e-04 | 4.96e-03 | 14 |
| GO:000702913 | Oral cavity | LP | endoplasmic reticulum organization | 41/4623 | 87/18723 | 4.49e-06 | 9.16e-05 | 41 |
| GO:007178611 | Oral cavity | LP | endoplasmic reticulum tubular network organization | 10/4623 | 18/18723 | 4.91e-03 | 3.06e-02 | 10 |
| GO:00070293 | Prostate | BPH | endoplasmic reticulum organization | 26/3107 | 87/18723 | 1.45e-03 | 8.61e-03 | 26 |
| GO:000702912 | Prostate | Tumor | endoplasmic reticulum organization | 27/3246 | 87/18723 | 1.24e-03 | 7.83e-03 | 27 |
| GO:00016541 | Prostate | Tumor | eye development | 82/3246 | 371/18723 | 1.02e-02 | 4.27e-02 | 82 |
| GO:00717866 | Skin | AK | endoplasmic reticulum tubular network organization | 6/1910 | 18/18723 | 7.04e-03 | 3.63e-02 | 6 |
| GO:00070296 | Skin | cSCC | endoplasmic reticulum organization | 42/4864 | 87/18723 | 6.36e-06 | 8.92e-05 | 42 |
| GO:007178612 | Skin | cSCC | endoplasmic reticulum tubular network organization | 11/4864 | 18/18723 | 1.74e-03 | 1.06e-02 | 11 |
| GO:00717867 | Thyroid | HT | endoplasmic reticulum tubular network organization | 6/1272 | 18/18723 | 8.86e-04 | 9.30e-03 | 6 |
| GO:00070297 | Thyroid | HT | endoplasmic reticulum organization | 13/1272 | 87/18723 | 5.73e-03 | 3.72e-02 | 13 |
| GO:000702915 | Thyroid | PTC | endoplasmic reticulum organization | 51/5968 | 87/18723 | 2.37e-07 | 4.15e-06 | 51 |
| GO:007178613 | Thyroid | PTC | endoplasmic reticulum tubular network organization | 14/5968 | 18/18723 | 8.31e-05 | 7.01e-04 | 14 |
| Page: 1 2 |
| Pathway ID | Tissue | Disease Stage | Description | Gene Ratio | Bg Ratio | pvalue | p.adjust | qvalue | Count |
| Page: 1 |
Top |
Cell-cell communication analysis |
| Identification of potential cell-cell interactions between two cell types and their ligand-receptor pairs for different disease states |
| Ligand | Receptor | LRpair | Pathway | Tissue | Disease Stage |
| Page: 1 |
Top |
Single-cell gene regulatory network inference analysis |
| Find out the significant the regulons (TFs) and the target genes of each regulon across cell types for different disease states |
| TF | Cell Type | Tissue | Disease Stage | Target Gene | RSS | Regulon Activity |
| RAB18 | GOB | Stomach | Healthy | MRPL47,PSENEN,INHBA, etc. | 4.46e-01 |  |
| RAB18 | iATC | Thyroid | ADJ | SBDS,FAM84A,AP1S3, etc. | 0.00e+00 |  |
| RAB18 | TFC | Thyroid | HT | SBDS,FAM84A,AP1S3, etc. | 0.00e+00 |  |
| RAB18 | iATC | Thyroid | PTC | SBDS,FAM84A,AP1S3, etc. | 4.34e-03 |  |
| RAB18 | TFC | Thyroid | PTC | SBDS,FAM84A,AP1S3, etc. | 4.32e-03 | |
| ∗The dot plots of a searched regulon are shown for all cell subpopulations in each disease state of each tissue based on the regulon specific score inferred using pySCENIC and by calculating the average expression. |
| Page: 1 |
Top |
Somatic mutation of malignant transformation related genes |
| Annotation of somatic variants for genes involved in malignant transformation |
| Hugo Symbol | Variant Class | Variant Classification | dbSNP RS | HGVSc | HGVSp | HGVSp Short | SWISSPROT | BIOTYPE | SIFT | PolyPhen | Tumor Sample Barcode | Tissue | Histology | Sex | Age | Stage | Therapy Types | Drugs | Outcome |
| RAB18 | SNV | Missense_Mutation | c.95N>G | p.Thr32Arg | p.T32R | Q9NP72 | protein_coding | deleterious(0.03) | benign(0.086) | TCGA-E9-A247-01 | Breast | breast invasive carcinoma | Female | <65 | I/II | Hormone Therapy | tamoxiphen | SD | |
| RAB18 | SNV | Missense_Mutation | c.158A>G | p.Asp53Gly | p.D53G | Q9NP72 | protein_coding | tolerated(0.41) | benign(0.139) | TCGA-AA-3672-01 | Colorectum | colon adenocarcinoma | Female | >=65 | III/IV | Unknown | Unknown | SD | |
| RAB18 | SNV | Missense_Mutation | novel | c.455N>G | p.Lys152Arg | p.K152R | Q9NP72 | protein_coding | deleterious(0) | probably_damaging(1) | TCGA-CA-6717-01 | Colorectum | colon adenocarcinoma | Male | <65 | I/II | Chemotherapy | oxaliplatin | CR |
| RAB18 | SNV | Missense_Mutation | novel | c.370N>G | p.Thr124Ala | p.T124A | Q9NP72 | protein_coding | deleterious(0) | possibly_damaging(0.812) | TCGA-A5-A0VP-01 | Endometrium | uterine corpus endometrioid carcinoma | Female | >=65 | I/II | Unknown | Unknown | SD |
| RAB18 | SNV | Missense_Mutation | novel | c.503T>G | p.Phe168Cys | p.F168C | Q9NP72 | protein_coding | deleterious(0.01) | benign(0.33) | TCGA-AJ-A5DW-01 | Endometrium | uterine corpus endometrioid carcinoma | Female | <65 | I/II | Unknown | Unknown | SD |
| RAB18 | SNV | Missense_Mutation | novel | c.167N>C | p.Lys56Thr | p.K56T | Q9NP72 | protein_coding | tolerated(0.15) | benign(0.023) | TCGA-AX-A05Z-01 | Endometrium | uterine corpus endometrioid carcinoma | Female | <65 | III/IV | Chemotherapy | adriamycin | SD |
| RAB18 | SNV | Missense_Mutation | novel | c.605N>A | p.Pro202His | p.P202H | Q9NP72 | protein_coding | deleterious(0) | probably_damaging(0.996) | TCGA-AX-A1CE-01 | Endometrium | uterine corpus endometrioid carcinoma | Female | <65 | I/II | Unspecific | Paclitaxel | SD |
| RAB18 | SNV | Missense_Mutation | rs140686479 | c.472C>T | p.Arg158Cys | p.R158C | Q9NP72 | protein_coding | deleterious(0) | probably_damaging(0.992) | TCGA-AX-A2HC-01 | Endometrium | uterine corpus endometrioid carcinoma | Female | <65 | III/IV | Chemotherapy | paclitaxel | PD |
| RAB18 | SNV | Missense_Mutation | novel | c.467N>G | p.Glu156Gly | p.E156G | Q9NP72 | protein_coding | deleterious(0.02) | benign(0.232) | TCGA-AX-A2HJ-01 | Endometrium | uterine corpus endometrioid carcinoma | Female | <65 | I/II | Unknown | Unknown | SD |
| RAB18 | SNV | Missense_Mutation | novel | c.281N>A | p.Ala94Asp | p.A94D | Q9NP72 | protein_coding | deleterious(0) | probably_damaging(1) | TCGA-B5-A3FC-01 | Endometrium | uterine corpus endometrioid carcinoma | Female | <65 | I/II | Unknown | Unknown | SD |
| Page: 1 2 |
Top |
Related drugs of malignant transformation related genes |
| Identification of chemicals and drugs interact with genes involved in malignant transfromation |
| (DGIdb 4.0) |
| Entrez ID | Symbol | Category | Interaction Types | Drug Claim Name | Drug Name | PMIDs |
| Page: 1 |

Copyright 2023-Present -The University of Texas Health Science Center at Houston |