
|
|||||
|
 | |
| |
| |
| |
| |
| |
|
Gene: QTRT1 |
Gene summary for QTRT1 |
| Gene information | Species | Human | Gene symbol | QTRT1 | Gene ID | 81890 |
| Gene name | queuine tRNA-ribosyltransferase catalytic subunit 1 | |
| Gene Alias | FP3235 | |
| Cytomap | 19p13.2 | |
| Gene Type | protein-coding | GO ID | GO:0006139 | UniProtAcc | Q71RF8 |
Top |
Malignant transformation analysis |
| Identification of the aberrant gene expression in precancerous and cancerous lesions by comparing the gene expression of stem-like cells in diseased tissues with normal stem cells |
| Entrez ID | Symbol | Replicates | Species | Organ | Tissue | Adj P-value | Log2FC | Malignancy |
| 81890 | QTRT1 | LZE6T | Human | Esophagus | ESCC | 1.03e-04 | 2.41e-01 | 0.0845 |
| 81890 | QTRT1 | P1T-E | Human | Esophagus | ESCC | 2.23e-15 | 1.11e+00 | 0.0875 |
| 81890 | QTRT1 | P2T-E | Human | Esophagus | ESCC | 8.61e-37 | 6.03e-01 | 0.1177 |
| 81890 | QTRT1 | P4T-E | Human | Esophagus | ESCC | 1.12e-23 | 5.82e-01 | 0.1323 |
| 81890 | QTRT1 | P5T-E | Human | Esophagus | ESCC | 5.11e-28 | 5.26e-01 | 0.1327 |
| 81890 | QTRT1 | P8T-E | Human | Esophagus | ESCC | 7.25e-36 | 7.00e-01 | 0.0889 |
| 81890 | QTRT1 | P9T-E | Human | Esophagus | ESCC | 2.48e-40 | 9.56e-01 | 0.1131 |
| 81890 | QTRT1 | P10T-E | Human | Esophagus | ESCC | 7.10e-29 | 6.48e-01 | 0.116 |
| 81890 | QTRT1 | P11T-E | Human | Esophagus | ESCC | 1.50e-18 | 6.16e-01 | 0.1426 |
| 81890 | QTRT1 | P12T-E | Human | Esophagus | ESCC | 3.12e-38 | 7.13e-01 | 0.1122 |
| 81890 | QTRT1 | P15T-E | Human | Esophagus | ESCC | 2.42e-22 | 5.00e-01 | 0.1149 |
| 81890 | QTRT1 | P16T-E | Human | Esophagus | ESCC | 1.18e-28 | 5.75e-01 | 0.1153 |
| 81890 | QTRT1 | P17T-E | Human | Esophagus | ESCC | 5.05e-12 | 6.18e-01 | 0.1278 |
| 81890 | QTRT1 | P19T-E | Human | Esophagus | ESCC | 1.77e-09 | 7.58e-01 | 0.1662 |
| 81890 | QTRT1 | P20T-E | Human | Esophagus | ESCC | 1.45e-23 | 6.15e-01 | 0.1124 |
| 81890 | QTRT1 | P21T-E | Human | Esophagus | ESCC | 2.06e-21 | 4.02e-01 | 0.1617 |
| 81890 | QTRT1 | P22T-E | Human | Esophagus | ESCC | 5.97e-40 | 7.88e-01 | 0.1236 |
| 81890 | QTRT1 | P23T-E | Human | Esophagus | ESCC | 1.60e-38 | 1.09e+00 | 0.108 |
| 81890 | QTRT1 | P24T-E | Human | Esophagus | ESCC | 9.36e-22 | 4.68e-01 | 0.1287 |
| 81890 | QTRT1 | P26T-E | Human | Esophagus | ESCC | 1.98e-45 | 8.70e-01 | 0.1276 |
| Page: 1 2 3 4 5 6 7 8 |
| Tissue | Expression Dynamics | Abbreviation |
| Colorectum (GSE201348) |  | FAP: Familial adenomatous polyposis |
| CRC: Colorectal cancer | ||
| Colorectum (HTA11) |  | AD: Adenomas |
| SER: Sessile serrated lesions | ||
| MSI-H: Microsatellite-high colorectal cancer | ||
| MSS: Microsatellite stable colorectal cancer | ||
| Esophagus | 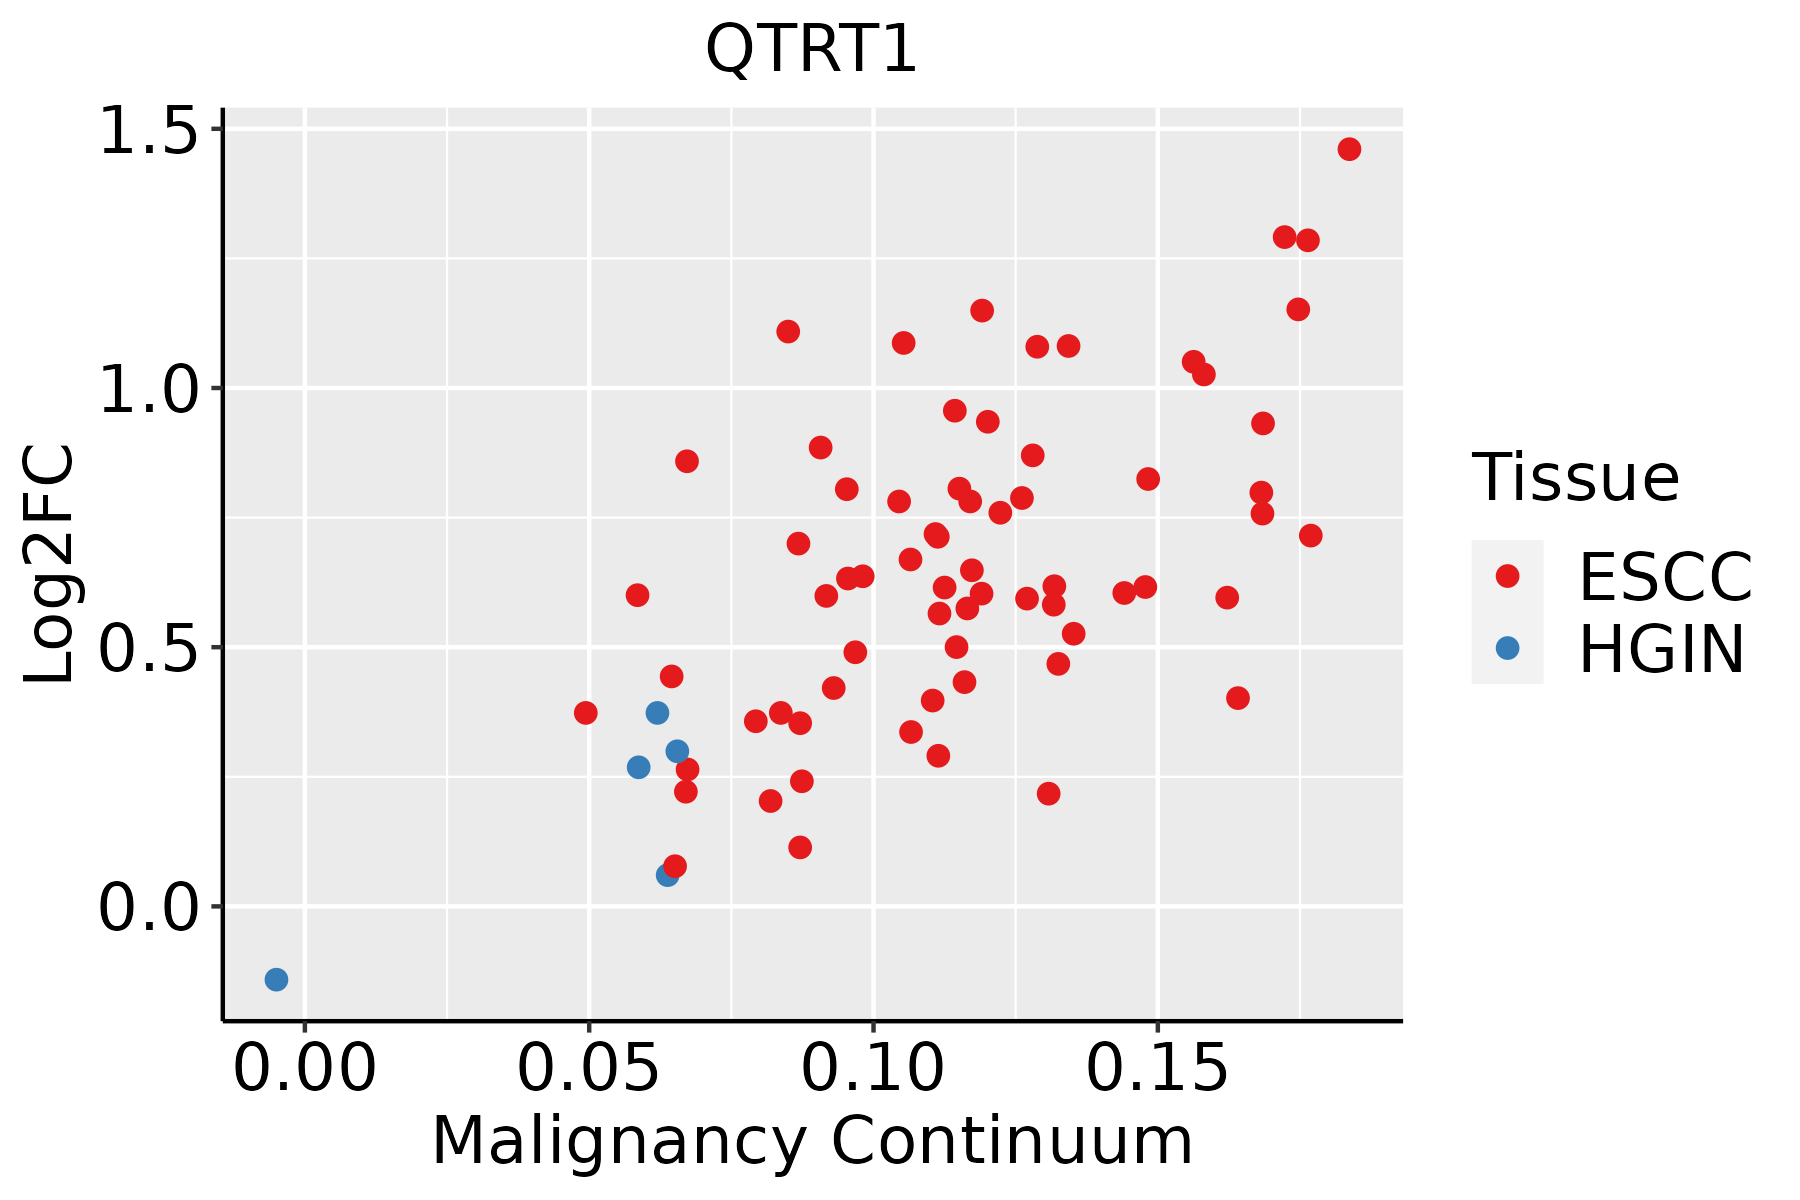 | ESCC: Esophageal squamous cell carcinoma |
| HGIN: High-grade intraepithelial neoplasias | ||
| LGIN: Low-grade intraepithelial neoplasias | ||
| Liver | 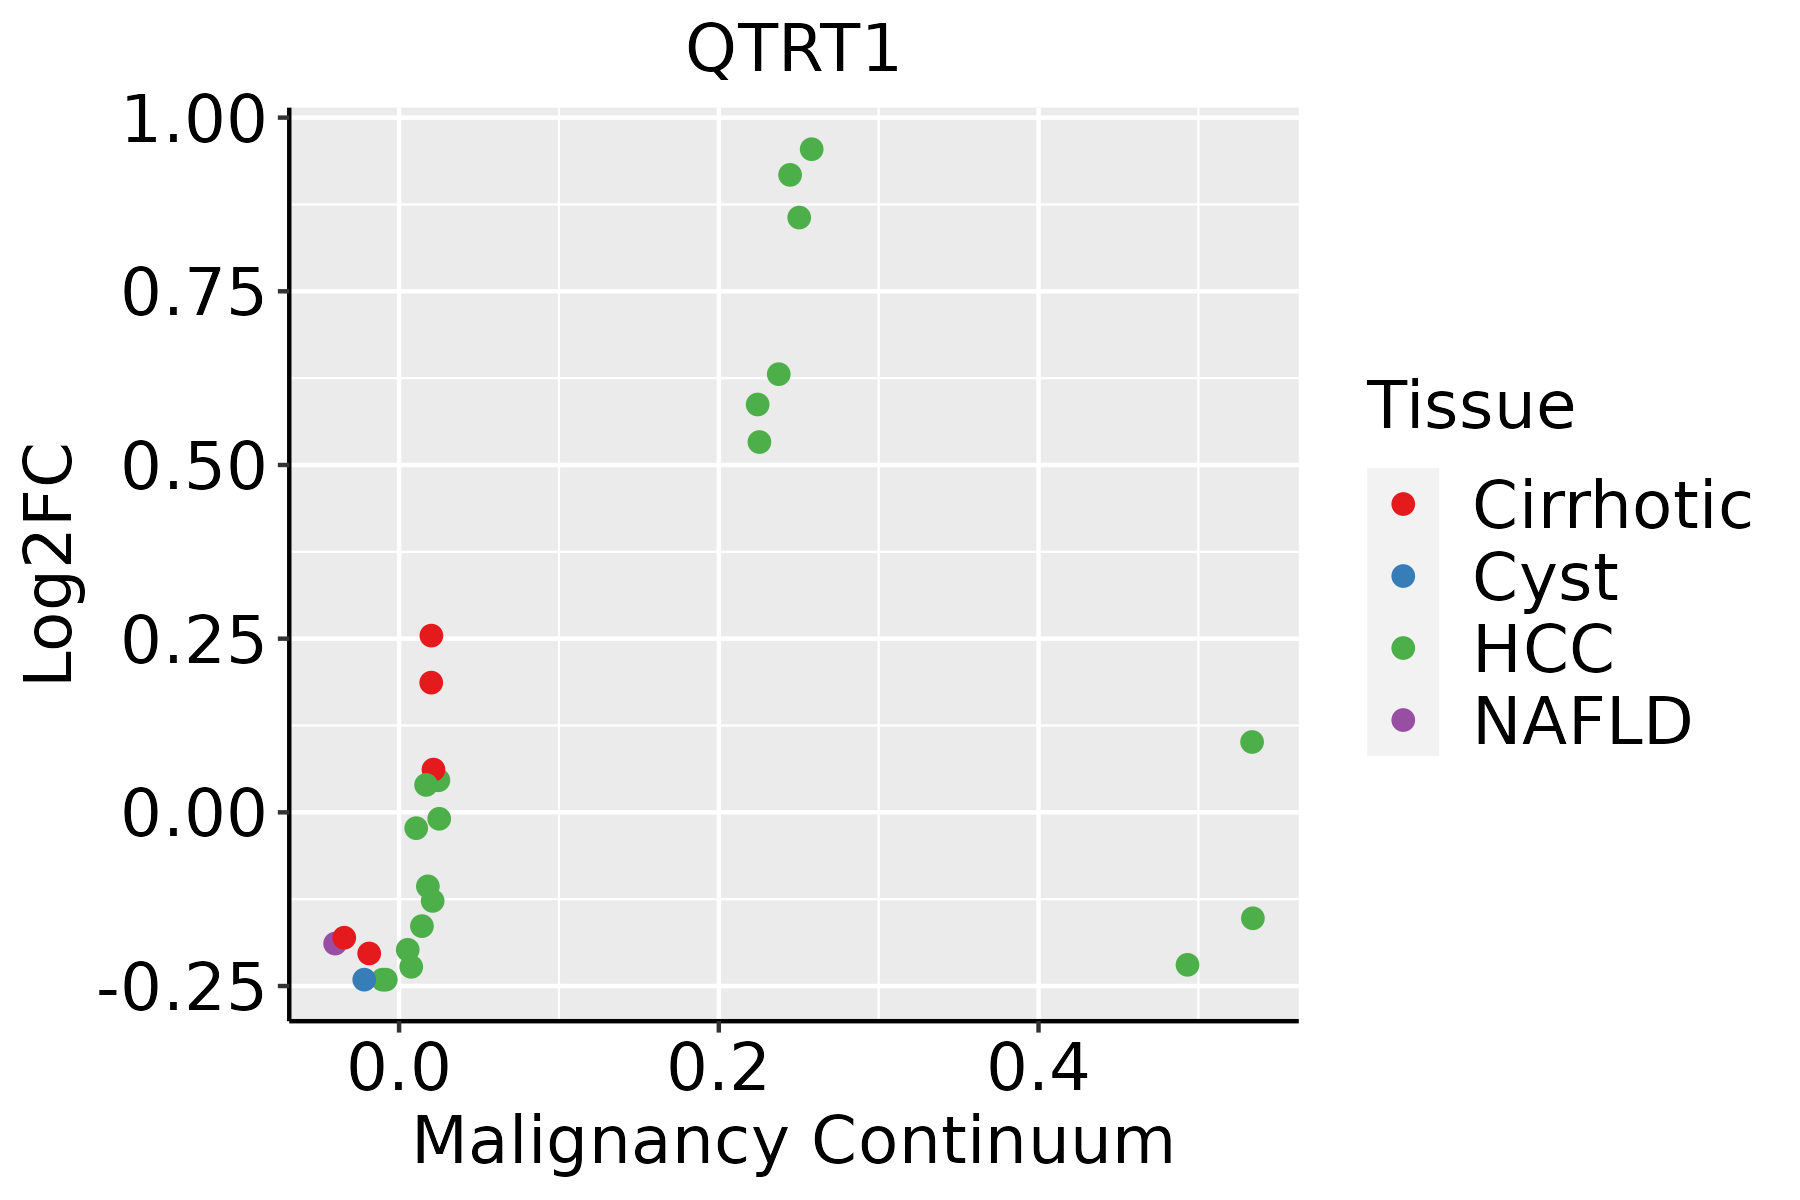 | HCC: Hepatocellular carcinoma |
| NAFLD: Non-alcoholic fatty liver disease | ||
| Oral Cavity | 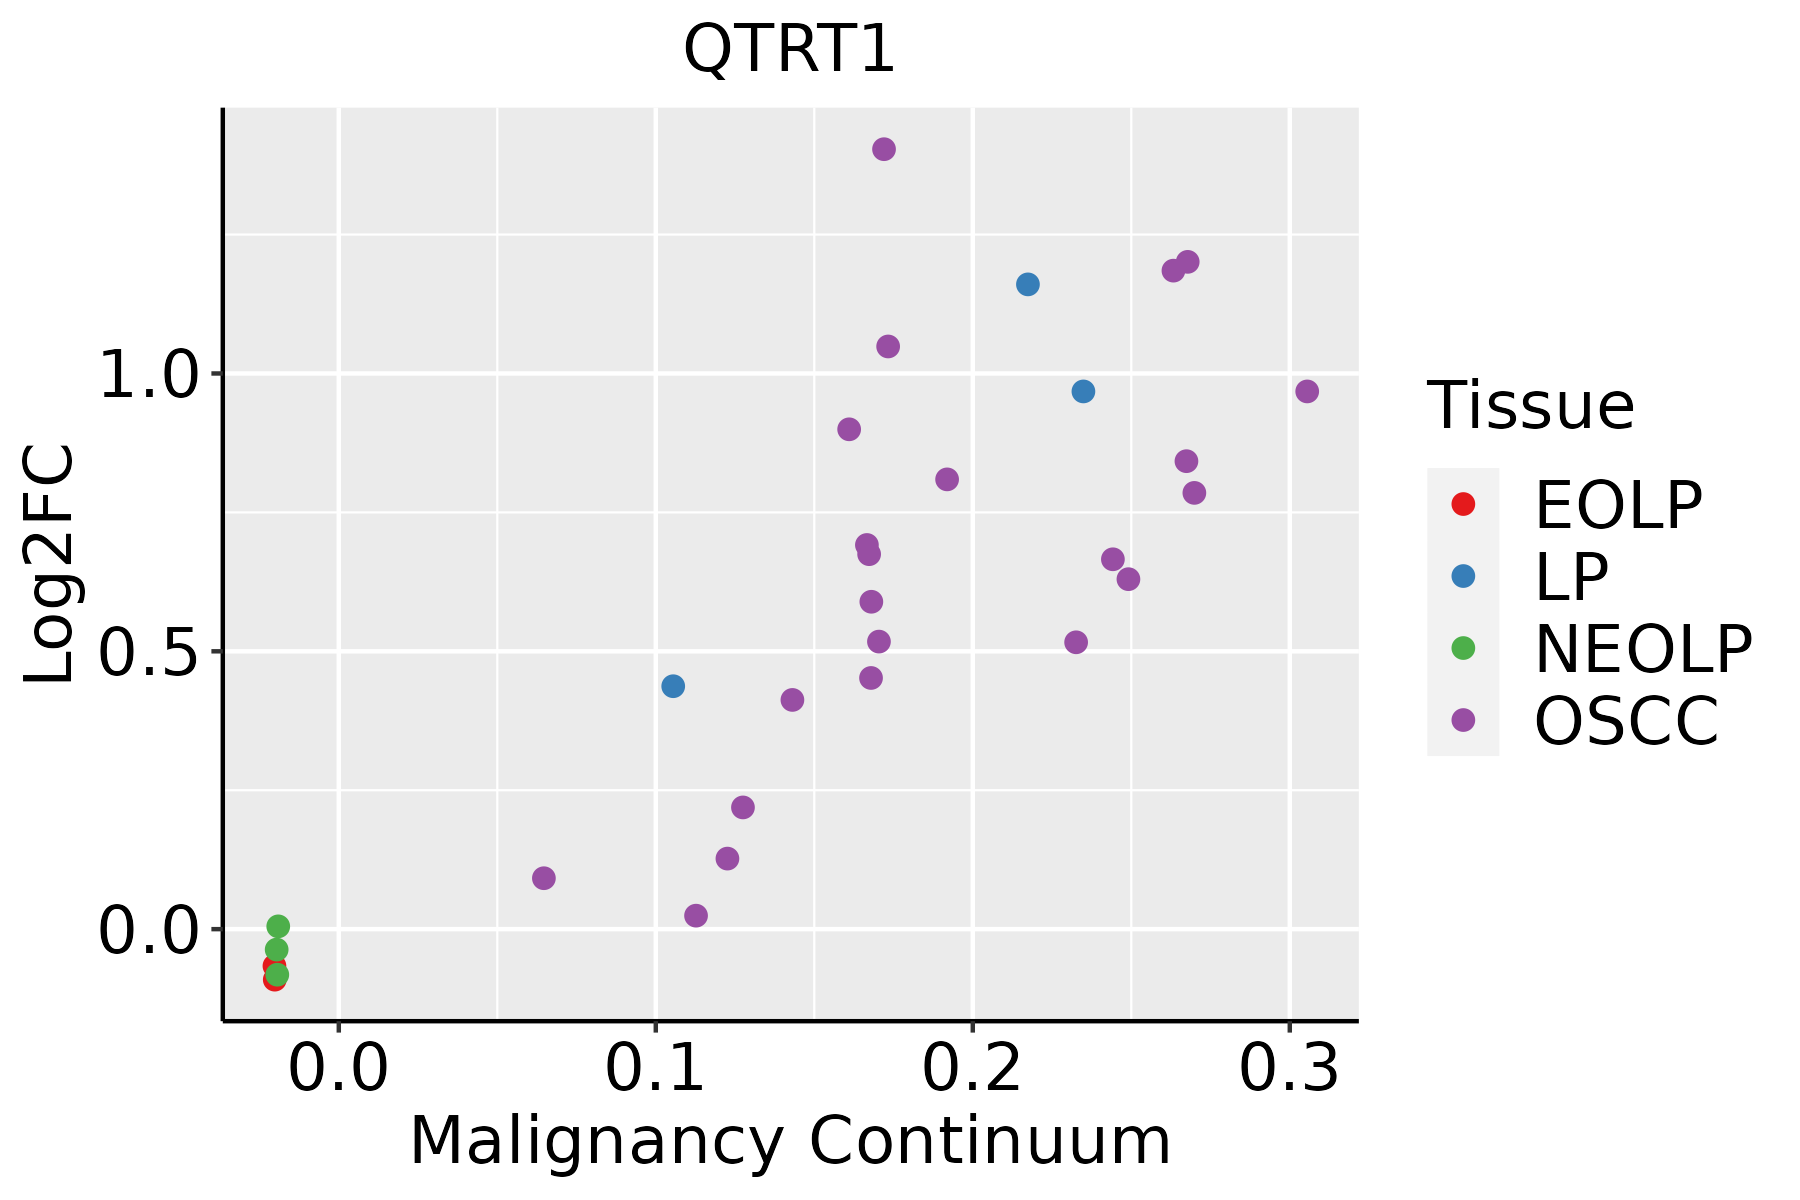 | EOLP: Erosive Oral lichen planus |
| LP: leukoplakia | ||
| NEOLP: Non-erosive oral lichen planus | ||
| OSCC: Oral squamous cell carcinoma | ||
| Skin | 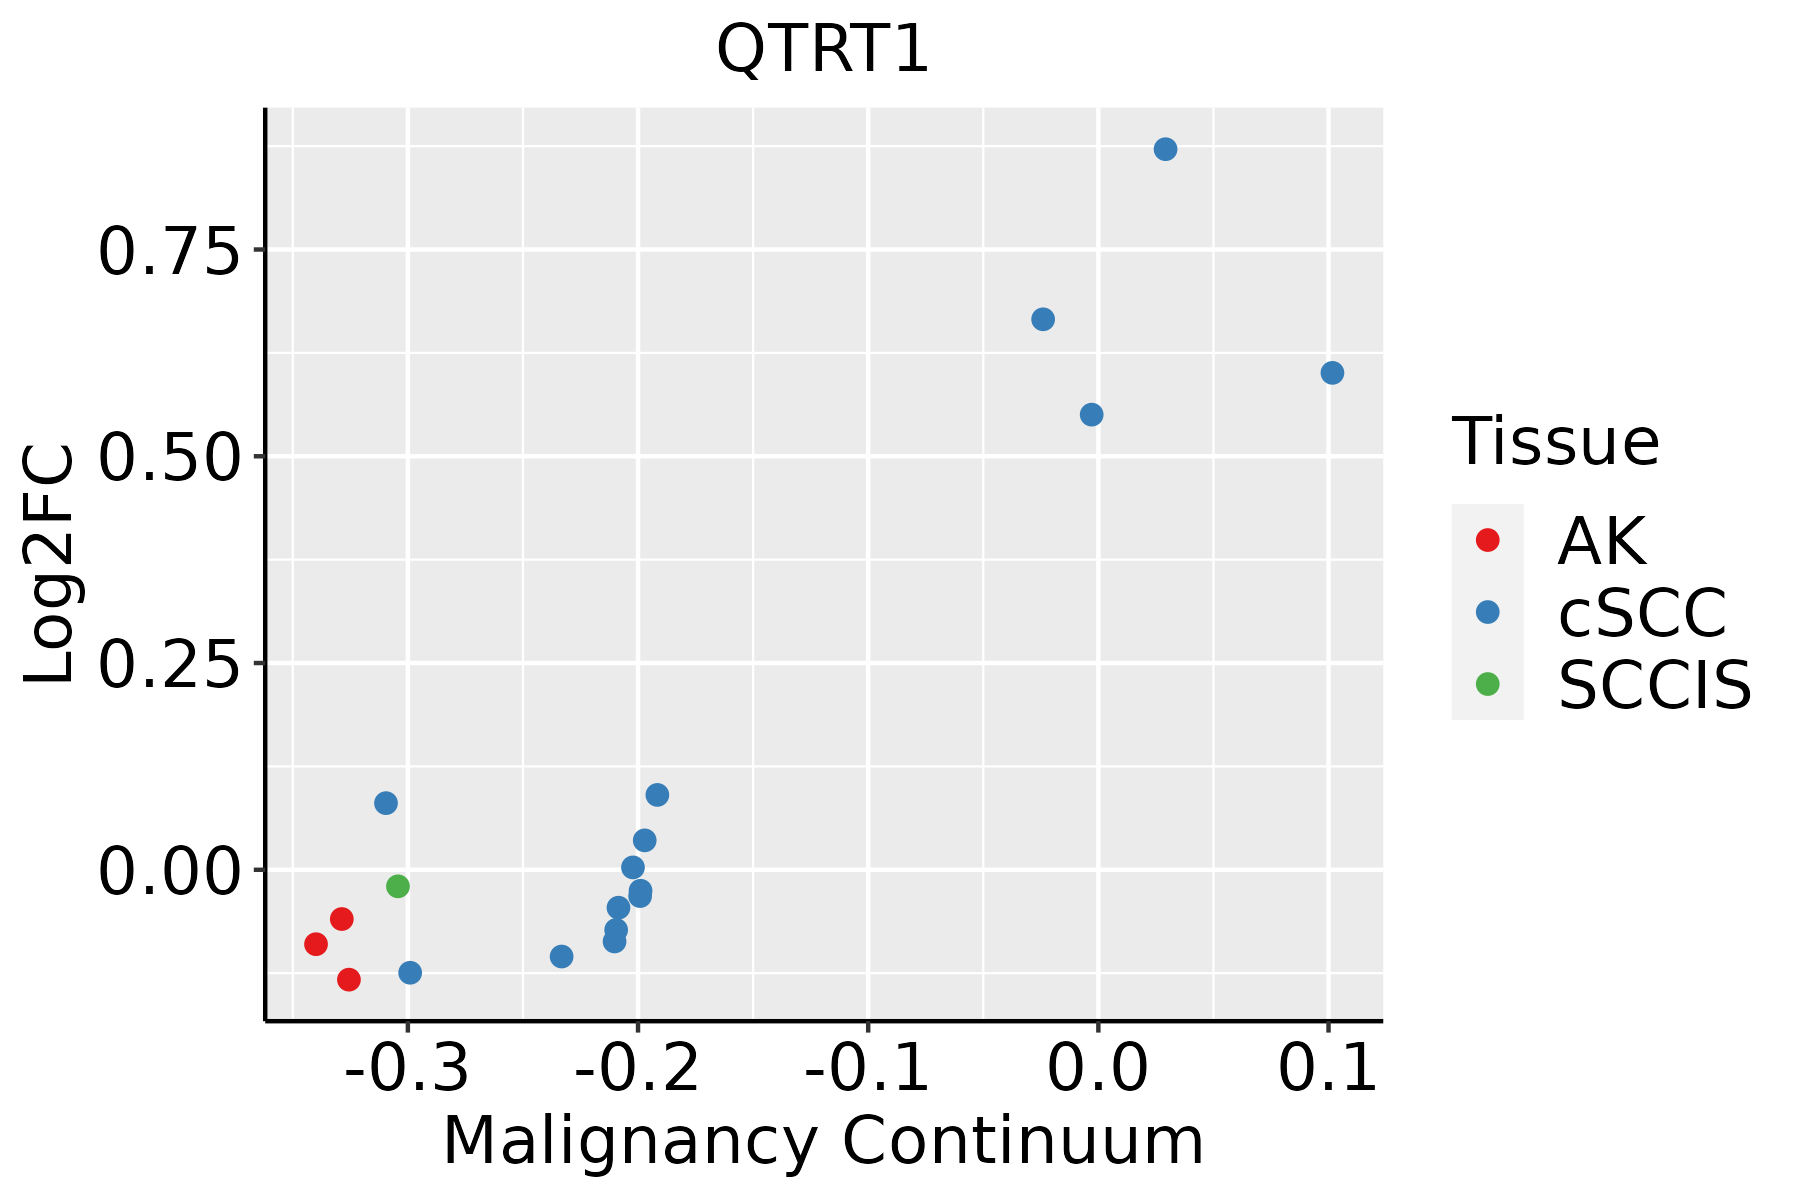 | AK: Actinic keratosis |
| cSCC: Cutaneous squamous cell carcinoma | ||
| SCCIS:squamous cell carcinoma in situ | ||
| Thyroid |  | ATC: Anaplastic thyroid cancer |
| HT: Hashimoto's thyroiditis | ||
| PTC: Papillary thyroid cancer |
| ∗log2FC in expression of this searched gene in stem-like cells from each diseased tissue sample relative to stem-like cells in normal samples in each tissue plotted against the malignancy continuum. Samples are colored based on if they are from different disease stage. |
Top |
Malignant transformation related pathway analysis |
| Find out the enriched GO biological processes and KEGG pathways involved in transition from healthy to precancer to cancer |
| Tissue | Disease Stage | Enriched GO biological Processes |
| Colorectum | AD |  |
| Colorectum | SER |  |
| Colorectum | MSS |  |
| Colorectum | MSI-H |  |
| Colorectum | FAP |  |
| ∗Top 15 enriched GO BP terms are showed in the bar plot of each disease state in each tissue. Each row represents a significant GO biological process which is colored according to the -log10(p.adjust). |
| Page: 1 2 3 4 5 6 7 8 9 |
| GO ID | Tissue | Disease Stage | Description | Gene Ratio | Bg Ratio | pvalue | p.adjust | Count |
| GO:003447015 | Esophagus | ESCC | ncRNA processing | 300/8552 | 395/18723 | 3.09e-35 | 3.26e-32 | 300 |
| GO:003466012 | Esophagus | ESCC | ncRNA metabolic process | 346/8552 | 485/18723 | 4.35e-31 | 2.51e-28 | 346 |
| GO:00080333 | Esophagus | ESCC | tRNA processing | 92/8552 | 127/18723 | 7.83e-10 | 1.93e-08 | 92 |
| GO:00063992 | Esophagus | ESCC | tRNA metabolic process | 122/8552 | 179/18723 | 9.03e-10 | 2.19e-08 | 122 |
| GO:00094512 | Esophagus | ESCC | RNA modification | 114/8552 | 167/18723 | 2.76e-09 | 6.04e-08 | 114 |
| GO:00064002 | Esophagus | ESCC | tRNA modification | 62/8552 | 90/18723 | 7.02e-06 | 7.04e-05 | 62 |
| GO:00344701 | Liver | Cirrhotic | ncRNA processing | 158/4634 | 395/18723 | 1.09e-11 | 6.96e-10 | 158 |
| GO:00346603 | Liver | Cirrhotic | ncRNA metabolic process | 173/4634 | 485/18723 | 3.64e-08 | 1.21e-06 | 173 |
| GO:00344702 | Liver | HCC | ncRNA processing | 293/7958 | 395/18723 | 4.26e-38 | 6.76e-35 | 293 |
| GO:00346601 | Liver | HCC | ncRNA metabolic process | 332/7958 | 485/18723 | 1.48e-31 | 7.80e-29 | 332 |
| GO:0008033 | Liver | HCC | tRNA processing | 87/7958 | 127/18723 | 2.66e-09 | 7.23e-08 | 87 |
| GO:0006399 | Liver | HCC | tRNA metabolic process | 108/7958 | 179/18723 | 1.07e-06 | 1.59e-05 | 108 |
| GO:0009451 | Liver | HCC | RNA modification | 101/7958 | 167/18723 | 2.02e-06 | 2.78e-05 | 101 |
| GO:0006400 | Liver | HCC | tRNA modification | 60/7958 | 90/18723 | 3.09e-06 | 4.09e-05 | 60 |
| GO:00344709 | Oral cavity | OSCC | ncRNA processing | 263/7305 | 395/18723 | 4.38e-29 | 2.78e-26 | 263 |
| GO:00346605 | Oral cavity | OSCC | ncRNA metabolic process | 296/7305 | 485/18723 | 2.94e-23 | 6.65e-21 | 296 |
| GO:00080332 | Oral cavity | OSCC | tRNA processing | 78/7305 | 127/18723 | 2.56e-07 | 4.00e-06 | 78 |
| GO:00063991 | Oral cavity | OSCC | tRNA metabolic process | 101/7305 | 179/18723 | 1.65e-06 | 2.15e-05 | 101 |
| GO:00094511 | Oral cavity | OSCC | RNA modification | 95/7305 | 167/18723 | 2.05e-06 | 2.62e-05 | 95 |
| GO:00064001 | Oral cavity | OSCC | tRNA modification | 53/7305 | 90/18723 | 1.04e-04 | 7.70e-04 | 53 |
| Page: 1 2 |
| Pathway ID | Tissue | Disease Stage | Description | Gene Ratio | Bg Ratio | pvalue | p.adjust | qvalue | Count |
| Page: 1 |
Top |
Cell-cell communication analysis |
| Identification of potential cell-cell interactions between two cell types and their ligand-receptor pairs for different disease states |
| Ligand | Receptor | LRpair | Pathway | Tissue | Disease Stage |
| Page: 1 |
Top |
Single-cell gene regulatory network inference analysis |
| Find out the significant the regulons (TFs) and the target genes of each regulon across cell types for different disease states |
| TF | Cell Type | Tissue | Disease Stage | Target Gene | RSS | Regulon Activity |
| ∗The dot plots of a searched regulon are shown for all cell subpopulations in each disease state of each tissue based on the regulon specific score inferred using pySCENIC and by calculating the average expression. |
| Page: 1 |
Top |
Somatic mutation of malignant transformation related genes |
| Annotation of somatic variants for genes involved in malignant transformation |
| Hugo Symbol | Variant Class | Variant Classification | dbSNP RS | HGVSc | HGVSp | HGVSp Short | SWISSPROT | BIOTYPE | SIFT | PolyPhen | Tumor Sample Barcode | Tissue | Histology | Sex | Age | Stage | Therapy Types | Drugs | Outcome |
| QTRT1 | SNV | Missense_Mutation | c.629N>A | p.Arg210Gln | p.R210Q | Q9BXR0 | protein_coding | deleterious(0) | probably_damaging(1) | TCGA-2W-A8YY-01 | Cervix | cervical & endocervical cancer | Female | <65 | I/II | Chemotherapy | cisplatin | CR | |
| QTRT1 | SNV | Missense_Mutation | novel | c.405N>C | p.Glu135Asp | p.E135D | Q9BXR0 | protein_coding | tolerated(0.32) | benign(0.035) | TCGA-DG-A2KM-01 | Cervix | cervical & endocervical cancer | Female | <65 | I/II | Chemotherapy | cisplatin | SD |
| QTRT1 | SNV | Missense_Mutation | rs377094295 | c.1081C>T | p.Arg361Cys | p.R361C | Q9BXR0 | protein_coding | deleterious(0) | probably_damaging(0.993) | TCGA-EA-A3HS-01 | Cervix | cervical & endocervical cancer | Female | <65 | I/II | Unknown | Unknown | SD |
| QTRT1 | SNV | Missense_Mutation | novel | c.398N>T | p.Gly133Val | p.G133V | Q9BXR0 | protein_coding | deleterious(0) | benign(0.312) | TCGA-VS-A9UJ-01 | Cervix | cervical & endocervical cancer | Female | <65 | I/II | Unknown | Unknown | PD |
| QTRT1 | SNV | Missense_Mutation | c.629N>A | p.Arg210Gln | p.R210Q | Q9BXR0 | protein_coding | deleterious(0) | probably_damaging(1) | TCGA-CM-6162-01 | Colorectum | colon adenocarcinoma | Female | <65 | III/IV | Chemotherapy | oxaliplatin | SD | |
| QTRT1 | SNV | Missense_Mutation | c.319N>A | p.Gly107Ser | p.G107S | Q9BXR0 | protein_coding | deleterious(0.01) | probably_damaging(1) | TCGA-NH-A5IV-01 | Colorectum | colon adenocarcinoma | Female | >=65 | I/II | Unknown | Unknown | SD | |
| QTRT1 | SNV | Missense_Mutation | novel | c.317G>T | p.Ser106Ile | p.S106I | Q9BXR0 | protein_coding | deleterious(0) | probably_damaging(0.999) | TCGA-A5-A0G1-01 | Endometrium | uterine corpus endometrioid carcinoma | Female | >=65 | I/II | Unknown | Unknown | SD |
| QTRT1 | SNV | Missense_Mutation | rs747033265 | c.676G>A | p.Ala226Thr | p.A226T | Q9BXR0 | protein_coding | deleterious(0) | probably_damaging(1) | TCGA-AJ-A3BH-01 | Endometrium | uterine corpus endometrioid carcinoma | Female | Unknown | I/II | Unknown | Unknown | SD |
| QTRT1 | SNV | Missense_Mutation | c.863N>A | p.Arg288His | p.R288H | Q9BXR0 | protein_coding | deleterious(0) | probably_damaging(1) | TCGA-AP-A051-01 | Endometrium | uterine corpus endometrioid carcinoma | Female | >=65 | I/II | Unknown | Unknown | SD | |
| QTRT1 | SNV | Missense_Mutation | rs756496433 | c.1021N>A | p.Ala341Thr | p.A341T | Q9BXR0 | protein_coding | deleterious(0.04) | possibly_damaging(0.756) | TCGA-AP-A051-01 | Endometrium | uterine corpus endometrioid carcinoma | Female | >=65 | I/II | Unknown | Unknown | SD |
| Page: 1 2 3 4 5 |
Top |
Related drugs of malignant transformation related genes |
| Identification of chemicals and drugs interact with genes involved in malignant transfromation |
| (DGIdb 4.0) |
| Entrez ID | Symbol | Category | Interaction Types | Drug Claim Name | Drug Name | PMIDs |
| Page: 1 |

Copyright 2023-Present -The University of Texas Health Science Center at Houston |