
|
|||||
|
 | |
| |
| |
| |
| |
| |
|
Gene: PTPRZ1 |
Gene summary for PTPRZ1 |
| Gene information | Species | Human | Gene symbol | PTPRZ1 | Gene ID | 5803 |
| Gene name | protein tyrosine phosphatase receptor type Z1 | |
| Gene Alias | HPTPZ | |
| Cytomap | 7q31.32 | |
| Gene Type | protein-coding | GO ID | GO:0000902 | UniProtAcc | B4DFE7 |
Top |
Malignant transformation analysis |
| Identification of the aberrant gene expression in precancerous and cancerous lesions by comparing the gene expression of stem-like cells in diseased tissues with normal stem cells |
| Entrez ID | Symbol | Replicates | Species | Organ | Tissue | Adj P-value | Log2FC | Malignancy |
| 5803 | PTPRZ1 | P74T-E | Human | Esophagus | ESCC | 6.32e-30 | 1.13e+00 | 0.1479 |
| 5803 | PTPRZ1 | P75T-E | Human | Esophagus | ESCC | 8.22e-14 | 1.93e-01 | 0.1125 |
| 5803 | PTPRZ1 | P76T-E | Human | Esophagus | ESCC | 1.10e-03 | -1.65e-01 | 0.1207 |
| 5803 | PTPRZ1 | P79T-E | Human | Esophagus | ESCC | 4.39e-02 | -5.44e-02 | 0.1154 |
| 5803 | PTPRZ1 | P83T-E | Human | Esophagus | ESCC | 7.18e-22 | 9.41e-01 | 0.1738 |
| 5803 | PTPRZ1 | P84T-E | Human | Esophagus | ESCC | 1.28e-03 | 6.67e-01 | 0.0933 |
| 5803 | PTPRZ1 | P91T-E | Human | Esophagus | ESCC | 4.67e-15 | 2.25e+00 | 0.1828 |
| 5803 | PTPRZ1 | P127T-E | Human | Esophagus | ESCC | 8.11e-06 | -2.68e-01 | 0.0826 |
| 5803 | PTPRZ1 | P128T-E | Human | Esophagus | ESCC | 2.06e-04 | 2.53e-01 | 0.1241 |
| 5803 | PTPRZ1 | C04 | Human | Oral cavity | OSCC | 2.03e-18 | 9.63e-01 | 0.2633 |
| 5803 | PTPRZ1 | C21 | Human | Oral cavity | OSCC | 4.32e-09 | 5.92e-01 | 0.2678 |
| 5803 | PTPRZ1 | C30 | Human | Oral cavity | OSCC | 4.68e-42 | 1.64e+00 | 0.3055 |
| 5803 | PTPRZ1 | C38 | Human | Oral cavity | OSCC | 1.09e-05 | 6.93e-01 | 0.172 |
| 5803 | PTPRZ1 | C46 | Human | Oral cavity | OSCC | 6.63e-04 | 2.07e-01 | 0.1673 |
| 5803 | PTPRZ1 | C51 | Human | Oral cavity | OSCC | 6.44e-13 | 9.26e-01 | 0.2674 |
| 5803 | PTPRZ1 | C06 | Human | Oral cavity | OSCC | 1.83e-07 | 1.50e+00 | 0.2699 |
| 5803 | PTPRZ1 | C07 | Human | Oral cavity | OSCC | 2.68e-03 | 8.29e-01 | 0.2491 |
| 5803 | PTPRZ1 | C08 | Human | Oral cavity | OSCC | 3.54e-45 | 9.80e-01 | 0.1919 |
| 5803 | PTPRZ1 | LN22 | Human | Oral cavity | OSCC | 8.35e-10 | 1.11e+00 | 0.1733 |
| 5803 | PTPRZ1 | SYSMH1 | Human | Oral cavity | OSCC | 3.38e-39 | 8.79e-01 | 0.1127 |
| Page: 1 2 3 4 |
| Tissue | Expression Dynamics | Abbreviation |
| Esophagus | 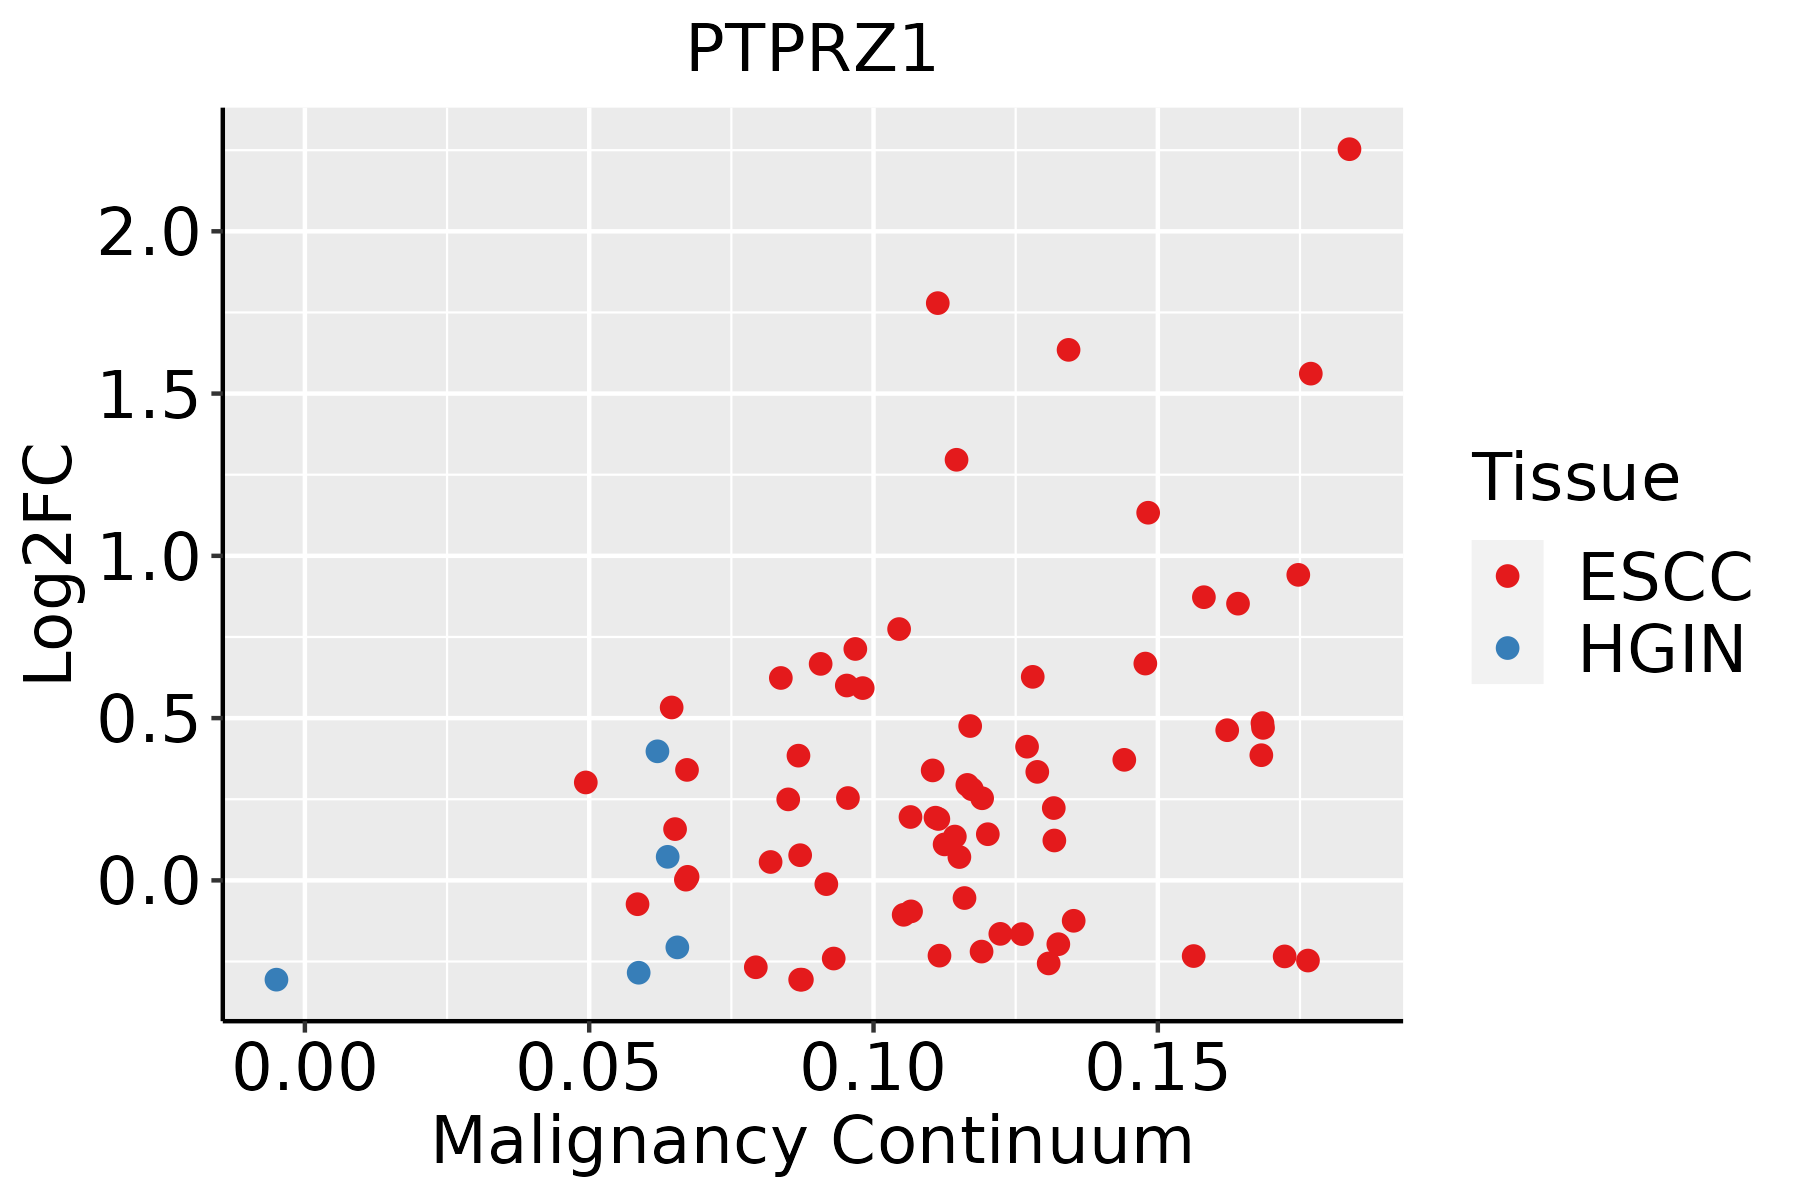 | ESCC: Esophageal squamous cell carcinoma |
| HGIN: High-grade intraepithelial neoplasias | ||
| LGIN: Low-grade intraepithelial neoplasias | ||
| Oral Cavity |  | EOLP: Erosive Oral lichen planus |
| LP: leukoplakia | ||
| NEOLP: Non-erosive oral lichen planus | ||
| OSCC: Oral squamous cell carcinoma | ||
| Skin |  | AK: Actinic keratosis |
| cSCC: Cutaneous squamous cell carcinoma | ||
| SCCIS:squamous cell carcinoma in situ |
| ∗log2FC in expression of this searched gene in stem-like cells from each diseased tissue sample relative to stem-like cells in normal samples in each tissue plotted against the malignancy continuum. Samples are colored based on if they are from different disease stage. |
Top |
Malignant transformation related pathway analysis |
| Find out the enriched GO biological processes and KEGG pathways involved in transition from healthy to precancer to cancer |
| Tissue | Disease Stage | Enriched GO biological Processes |
| Colorectum | AD |  |
| Colorectum | SER |  |
| Colorectum | MSS |  |
| Colorectum | MSI-H |  |
| Colorectum | FAP |  |
| ∗Top 15 enriched GO BP terms are showed in the bar plot of each disease state in each tissue. Each row represents a significant GO biological process which is colored according to the -log10(p.adjust). |
| Page: 1 2 3 4 5 6 7 8 9 |
| GO ID | Tissue | Disease Stage | Description | Gene Ratio | Bg Ratio | pvalue | p.adjust | Count |
| GO:001631110 | Esophagus | ESCC | dephosphorylation | 251/8552 | 417/18723 | 1.26e-09 | 2.99e-08 | 251 |
| GO:000647018 | Esophagus | ESCC | protein dephosphorylation | 177/8552 | 281/18723 | 3.13e-09 | 6.72e-08 | 177 |
| GO:0070997111 | Esophagus | ESCC | neuron death | 216/8552 | 361/18723 | 3.49e-08 | 6.45e-07 | 216 |
| GO:0051402110 | Esophagus | ESCC | neuron apoptotic process | 148/8552 | 246/18723 | 3.08e-06 | 3.47e-05 | 148 |
| GO:1901214111 | Esophagus | ESCC | regulation of neuron death | 186/8552 | 319/18723 | 3.35e-06 | 3.73e-05 | 186 |
| GO:001072010 | Esophagus | ESCC | positive regulation of cell development | 172/8552 | 298/18723 | 1.74e-05 | 1.55e-04 | 172 |
| GO:00425524 | Esophagus | ESCC | myelination | 85/8552 | 134/18723 | 2.51e-05 | 2.13e-04 | 85 |
| GO:00072724 | Esophagus | ESCC | ensheathment of neurons | 86/8552 | 136/18723 | 2.68e-05 | 2.24e-04 | 86 |
| GO:00083664 | Esophagus | ESCC | axon ensheathment | 86/8552 | 136/18723 | 2.68e-05 | 2.24e-04 | 86 |
| GO:00420636 | Esophagus | ESCC | gliogenesis | 172/8552 | 301/18723 | 3.75e-05 | 3.04e-04 | 172 |
| GO:005076710 | Esophagus | ESCC | regulation of neurogenesis | 203/8552 | 364/18723 | 6.10e-05 | 4.68e-04 | 203 |
| GO:00507697 | Esophagus | ESCC | positive regulation of neurogenesis | 131/8552 | 225/18723 | 9.71e-05 | 6.90e-04 | 131 |
| GO:006156415 | Esophagus | ESCC | axon development | 251/8552 | 467/18723 | 2.41e-04 | 1.49e-03 | 251 |
| GO:00100016 | Esophagus | ESCC | glial cell differentiation | 129/8552 | 225/18723 | 2.73e-04 | 1.65e-03 | 129 |
| GO:004352317 | Esophagus | ESCC | regulation of neuron apoptotic process | 122/8552 | 212/18723 | 3.21e-04 | 1.90e-03 | 122 |
| GO:00519606 | Esophagus | ESCC | regulation of nervous system development | 237/8552 | 443/18723 | 5.02e-04 | 2.78e-03 | 237 |
| GO:00519625 | Esophagus | ESCC | positive regulation of nervous system development | 149/8552 | 272/18723 | 1.50e-03 | 7.06e-03 | 149 |
| GO:000740915 | Esophagus | ESCC | axonogenesis | 219/8552 | 418/18723 | 3.14e-03 | 1.31e-02 | 219 |
| GO:190121516 | Esophagus | ESCC | negative regulation of neuron death | 115/8552 | 208/18723 | 3.24e-03 | 1.34e-02 | 115 |
| GO:0031641 | Esophagus | ESCC | regulation of myelination | 31/8552 | 47/18723 | 4.01e-03 | 1.62e-02 | 31 |
| Page: 1 2 3 4 5 |
| Pathway ID | Tissue | Disease Stage | Description | Gene Ratio | Bg Ratio | pvalue | p.adjust | qvalue | Count |
| hsa0512018 | Esophagus | ESCC | Epithelial cell signaling in Helicobacter pylori infection | 52/4205 | 70/8465 | 2.17e-05 | 1.07e-04 | 5.47e-05 | 52 |
| hsa0512019 | Esophagus | ESCC | Epithelial cell signaling in Helicobacter pylori infection | 52/4205 | 70/8465 | 2.17e-05 | 1.07e-04 | 5.47e-05 | 52 |
| hsa0512010 | Oral cavity | OSCC | Epithelial cell signaling in Helicobacter pylori infection | 49/3704 | 70/8465 | 7.57e-06 | 3.59e-05 | 1.83e-05 | 49 |
| hsa0512017 | Oral cavity | OSCC | Epithelial cell signaling in Helicobacter pylori infection | 49/3704 | 70/8465 | 7.57e-06 | 3.59e-05 | 1.83e-05 | 49 |
| Page: 1 |
Top |
Cell-cell communication analysis |
| Identification of potential cell-cell interactions between two cell types and their ligand-receptor pairs for different disease states |
| Ligand | Receptor | LRpair | Pathway | Tissue | Disease Stage |
| MDK | PTPRZ1 | MDK_PTPRZ1 | MK | Cervix | CC |
| PTN | PTPRZ1 | PTN_PTPRZ1 | PTN | Cervix | CC |
| MDK | PTPRZ1 | MDK_PTPRZ1 | MK | CRC | ADJ |
| MDK | PTPRZ1 | MDK_PTPRZ1 | MK | Esophagus | ESCC |
| PTN | PTPRZ1 | PTN_PTPRZ1 | PTN | Esophagus | ESCC |
| MDK | PTPRZ1 | MDK_PTPRZ1 | MK | GC | GC |
| PTN | PTPRZ1 | PTN_PTPRZ1 | PTN | GC | GC |
| MDK | PTPRZ1 | MDK_PTPRZ1 | MK | HNSCC | OSCC |
| PTN | PTPRZ1 | PTN_PTPRZ1 | PTN | HNSCC | OSCC |
| MDK | PTPRZ1 | MDK_PTPRZ1 | MK | HNSCC | Precancer |
| PTN | PTPRZ1 | PTN_PTPRZ1 | PTN | HNSCC | Precancer |
| PTN | PTPRZ1 | PTN_PTPRZ1 | PTN | Prostate | BPH |
| MDK | PTPRZ1 | MDK_PTPRZ1 | MK | Prostate | BPH |
| MDK | PTPRZ1 | MDK_PTPRZ1 | MK | Prostate | Tumor |
| PTN | PTPRZ1 | PTN_PTPRZ1 | PTN | Prostate | Tumor |
| MDK | PTPRZ1 | MDK_PTPRZ1 | MK | Skin | ADJ |
| PTN | PTPRZ1 | PTN_PTPRZ1 | PTN | Skin | ADJ |
| PTN | PTPRZ1 | PTN_PTPRZ1 | PTN | Skin | AK |
| MDK | PTPRZ1 | MDK_PTPRZ1 | MK | Skin | AK |
| Page: 1 |
Top |
Single-cell gene regulatory network inference analysis |
| Find out the significant the regulons (TFs) and the target genes of each regulon across cell types for different disease states |
| TF | Cell Type | Tissue | Disease Stage | Target Gene | RSS | Regulon Activity |
| ∗The dot plots of a searched regulon are shown for all cell subpopulations in each disease state of each tissue based on the regulon specific score inferred using pySCENIC and by calculating the average expression. |
| Page: 1 |
Top |
Somatic mutation of malignant transformation related genes |
| Annotation of somatic variants for genes involved in malignant transformation |
| Hugo Symbol | Variant Class | Variant Classification | dbSNP RS | HGVSc | HGVSp | HGVSp Short | SWISSPROT | BIOTYPE | SIFT | PolyPhen | Tumor Sample Barcode | Tissue | Histology | Sex | Age | Stage | Therapy Types | Drugs | Outcome |
| PTPRZ1 | SNV | Missense_Mutation | rs142021602 | c.2893G>A | p.Gly965Ser | p.G965S | P23471 | protein_coding | tolerated_low_confidence(1) | benign(0) | TCGA-3C-AALI-01 | Breast | breast invasive carcinoma | Female | <65 | I/II | Unspecific | Poly E | Complete Response |
| PTPRZ1 | SNV | Missense_Mutation | novel | c.1114N>A | p.Gly372Ser | p.G372S | P23471 | protein_coding | deleterious(0) | probably_damaging(1) | TCGA-5L-AAT1-01 | Breast | breast invasive carcinoma | Female | <65 | III/IV | Hormone Therapy | letrozol | SD |
| PTPRZ1 | SNV | Missense_Mutation | c.4862N>G | p.His1621Arg | p.H1621R | P23471 | protein_coding | deleterious(0.02) | possibly_damaging(0.794) | TCGA-A2-A1G1-01 | Breast | breast invasive carcinoma | Female | >=65 | I/II | Unknown | Unknown | SD | |
| PTPRZ1 | SNV | Missense_Mutation | novel | c.4908N>T | p.Lys1636Asn | p.K1636N | P23471 | protein_coding | deleterious(0) | probably_damaging(0.918) | TCGA-A2-A25A-01 | Breast | breast invasive carcinoma | Female | <65 | I/II | Unspecific | Cytoxan | SD |
| PTPRZ1 | SNV | Missense_Mutation | rs760236914 | c.2497N>T | p.Arg833Cys | p.R833C | P23471 | protein_coding | deleterious_low_confidence(0) | benign(0.425) | TCGA-A8-A091-01 | Breast | breast invasive carcinoma | Female | <65 | I/II | Chemotherapy | 5-fluorouracil | PD |
| PTPRZ1 | SNV | Missense_Mutation | c.3089N>T | p.Thr1030Ile | p.T1030I | P23471 | protein_coding | tolerated_low_confidence(0.2) | benign(0.109) | TCGA-A8-A09M-01 | Breast | breast invasive carcinoma | Female | >=65 | III/IV | Chemotherapy | paclitaxel | CR | |
| PTPRZ1 | SNV | Missense_Mutation | rs760236914 | c.2497C>T | p.Arg833Cys | p.R833C | P23471 | protein_coding | deleterious_low_confidence(0) | benign(0.425) | TCGA-AN-A046-01 | Breast | breast invasive carcinoma | Female | >=65 | I/II | Unknown | Unknown | SD |
| PTPRZ1 | SNV | Missense_Mutation | rs764298550 | c.6158G>A | p.Arg2053Gln | p.R2053Q | P23471 | protein_coding | deleterious(0) | probably_damaging(0.999) | TCGA-AN-A046-01 | Breast | breast invasive carcinoma | Female | >=65 | I/II | Unknown | Unknown | SD |
| PTPRZ1 | SNV | Missense_Mutation | rs770406556 | c.2498N>A | p.Arg833His | p.R833H | P23471 | protein_coding | tolerated_low_confidence(1) | benign(0) | TCGA-AN-A0AM-01 | Breast | breast invasive carcinoma | Female | <65 | I/II | Unknown | Unknown | SD |
| PTPRZ1 | SNV | Missense_Mutation | c.4877G>T | p.Gly1626Val | p.G1626V | P23471 | protein_coding | deleterious(0) | probably_damaging(1) | TCGA-AN-A0AR-01 | Breast | breast invasive carcinoma | Female | <65 | I/II | Unknown | Unknown | SD |
| Page: 1 2 3 4 5 6 7 8 9 10 11 12 13 14 15 16 17 18 19 20 21 22 23 24 25 26 27 28 29 30 31 32 33 34 35 36 37 38 |
Top |
Related drugs of malignant transformation related genes |
| Identification of chemicals and drugs interact with genes involved in malignant transfromation |
| (DGIdb 4.0) |
| Entrez ID | Symbol | Category | Interaction Types | Drug Claim Name | Drug Name | PMIDs |
| 5803 | PTPRZ1 | PROTEIN PHOSPHATASE, DRUGGABLE GENOME | RETINOIC ACID | 10809755 | ||
| 5803 | PTPRZ1 | PROTEIN PHOSPHATASE, DRUGGABLE GENOME | PMA | 10809755 | ||
| 5803 | PTPRZ1 | PROTEIN PHOSPHATASE, DRUGGABLE GENOME | VITAMIN D | 10809755 |
| Page: 1 |

Copyright 2023-Present -The University of Texas Health Science Center at Houston |