
|
|||||
|
 | |
| |
| |
| |
| |
| |
|
Gene: PTPN18 |
Gene summary for PTPN18 |
| Gene information | Species | Human | Gene symbol | PTPN18 | Gene ID | 26469 |
| Gene name | protein tyrosine phosphatase non-receptor type 18 | |
| Gene Alias | BDP1 | |
| Cytomap | 2q21.1 | |
| Gene Type | protein-coding | GO ID | GO:0001701 | UniProtAcc | Q99952 |
Top |
Malignant transformation analysis |
| Identification of the aberrant gene expression in precancerous and cancerous lesions by comparing the gene expression of stem-like cells in diseased tissues with normal stem cells |
| Entrez ID | Symbol | Replicates | Species | Organ | Tissue | Adj P-value | Log2FC | Malignancy |
| 26469 | PTPN18 | P26T-E | Human | Esophagus | ESCC | 3.95e-21 | 4.27e-02 | 0.1276 |
| 26469 | PTPN18 | P27T-E | Human | Esophagus | ESCC | 2.94e-15 | 9.58e-02 | 0.1055 |
| 26469 | PTPN18 | P28T-E | Human | Esophagus | ESCC | 2.40e-18 | 3.88e-01 | 0.1149 |
| 26469 | PTPN18 | P30T-E | Human | Esophagus | ESCC | 3.78e-07 | 4.85e-01 | 0.137 |
| 26469 | PTPN18 | P31T-E | Human | Esophagus | ESCC | 1.65e-12 | 1.33e-02 | 0.1251 |
| 26469 | PTPN18 | P32T-E | Human | Esophagus | ESCC | 3.45e-27 | 1.95e-01 | 0.1666 |
| 26469 | PTPN18 | P36T-E | Human | Esophagus | ESCC | 1.24e-07 | 1.69e-01 | 0.1187 |
| 26469 | PTPN18 | P37T-E | Human | Esophagus | ESCC | 8.45e-13 | 8.40e-02 | 0.1371 |
| 26469 | PTPN18 | P38T-E | Human | Esophagus | ESCC | 5.44e-13 | 1.86e-01 | 0.127 |
| 26469 | PTPN18 | P39T-E | Human | Esophagus | ESCC | 4.67e-11 | 2.06e-01 | 0.0894 |
| 26469 | PTPN18 | P40T-E | Human | Esophagus | ESCC | 2.58e-09 | 1.07e-01 | 0.109 |
| 26469 | PTPN18 | P42T-E | Human | Esophagus | ESCC | 3.40e-12 | 1.77e-01 | 0.1175 |
| 26469 | PTPN18 | P44T-E | Human | Esophagus | ESCC | 2.51e-04 | 1.68e-01 | 0.1096 |
| 26469 | PTPN18 | P47T-E | Human | Esophagus | ESCC | 1.09e-13 | 1.03e-01 | 0.1067 |
| 26469 | PTPN18 | P48T-E | Human | Esophagus | ESCC | 1.54e-16 | 1.25e-01 | 0.0959 |
| 26469 | PTPN18 | P52T-E | Human | Esophagus | ESCC | 1.97e-21 | 1.56e-01 | 0.1555 |
| 26469 | PTPN18 | P54T-E | Human | Esophagus | ESCC | 5.19e-09 | 4.54e-02 | 0.0975 |
| 26469 | PTPN18 | P56T-E | Human | Esophagus | ESCC | 1.58e-04 | 4.25e-01 | 0.1613 |
| 26469 | PTPN18 | P57T-E | Human | Esophagus | ESCC | 4.13e-23 | 3.64e-01 | 0.0926 |
| 26469 | PTPN18 | P61T-E | Human | Esophagus | ESCC | 9.45e-15 | 2.86e-01 | 0.099 |
| Page: 1 2 3 4 5 |
| Tissue | Expression Dynamics | Abbreviation |
| Colorectum (GSE201348) |  | FAP: Familial adenomatous polyposis |
| CRC: Colorectal cancer | ||
| Colorectum (HTA11) | 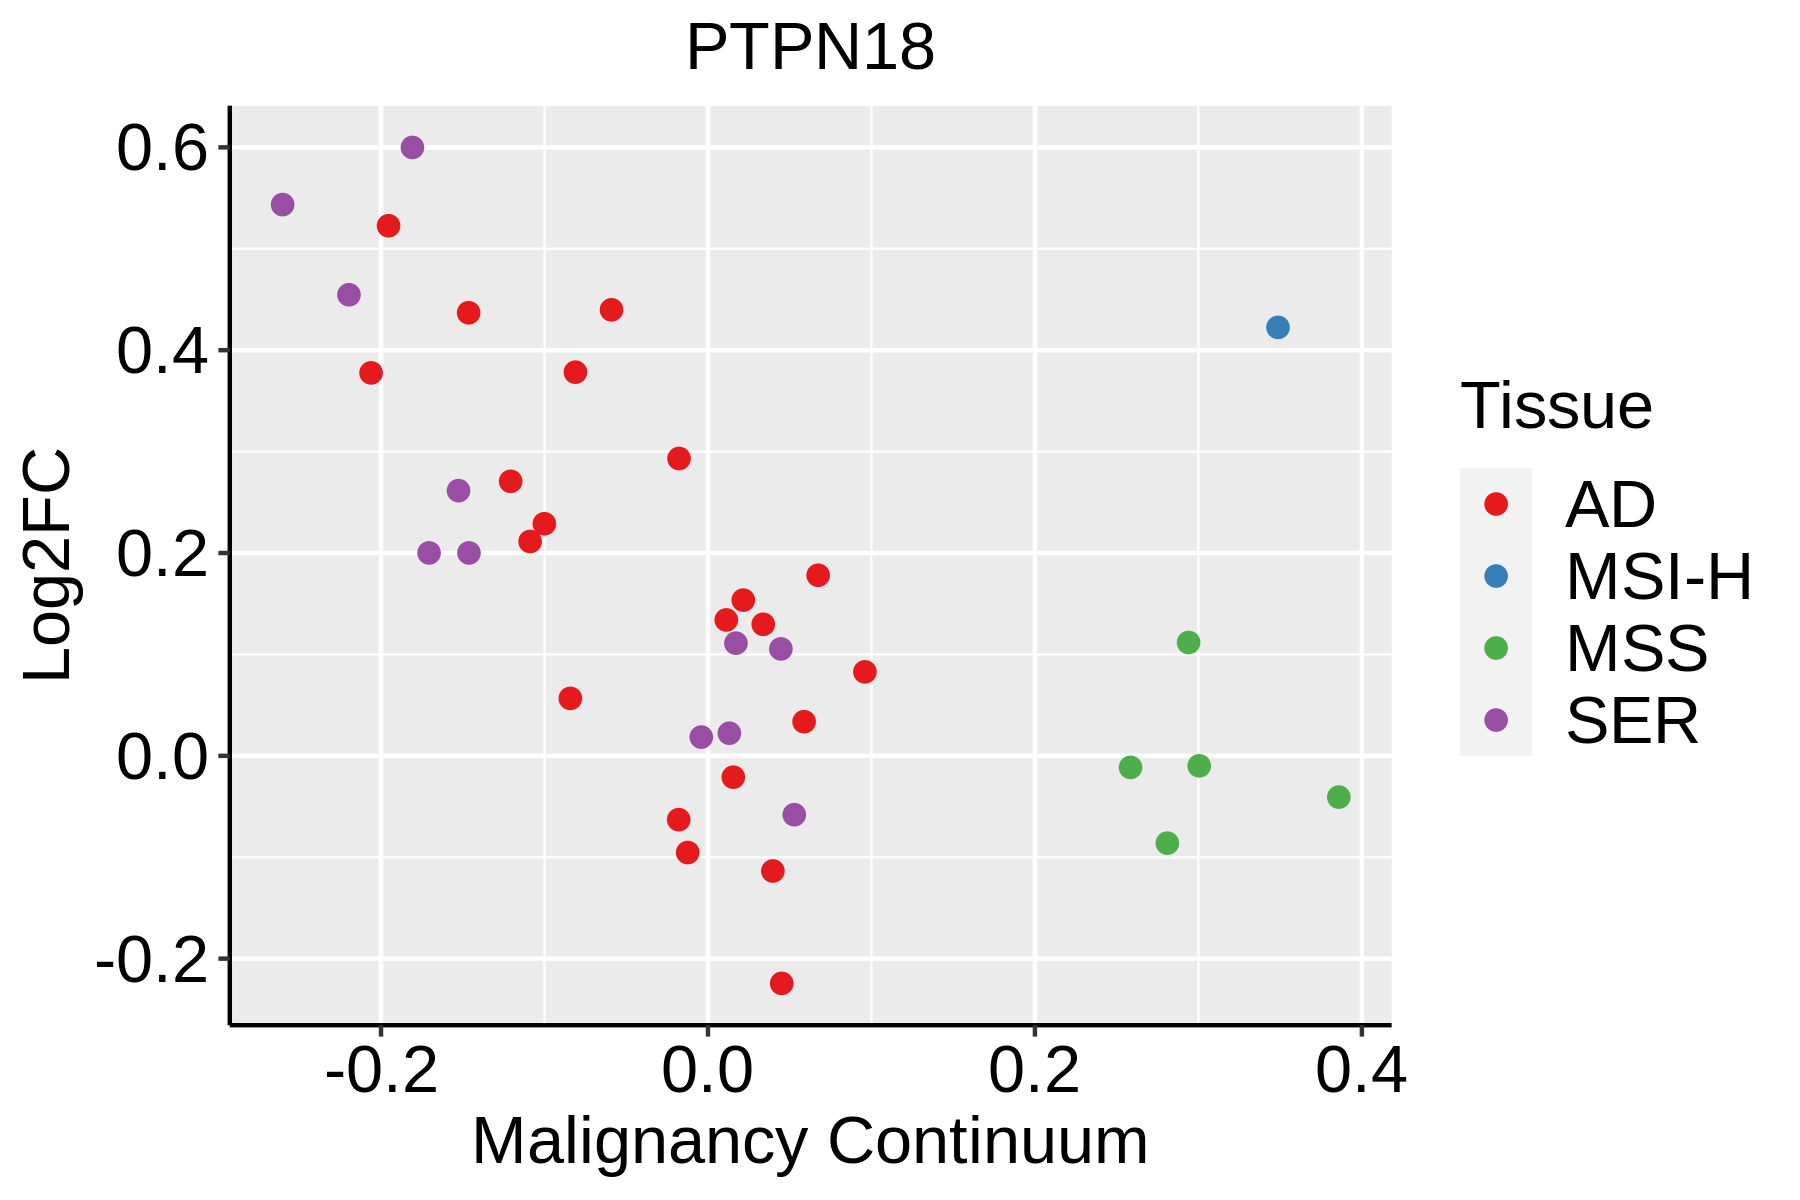 | AD: Adenomas |
| SER: Sessile serrated lesions | ||
| MSI-H: Microsatellite-high colorectal cancer | ||
| MSS: Microsatellite stable colorectal cancer | ||
| Esophagus |  | ESCC: Esophageal squamous cell carcinoma |
| HGIN: High-grade intraepithelial neoplasias | ||
| LGIN: Low-grade intraepithelial neoplasias | ||
| Liver | 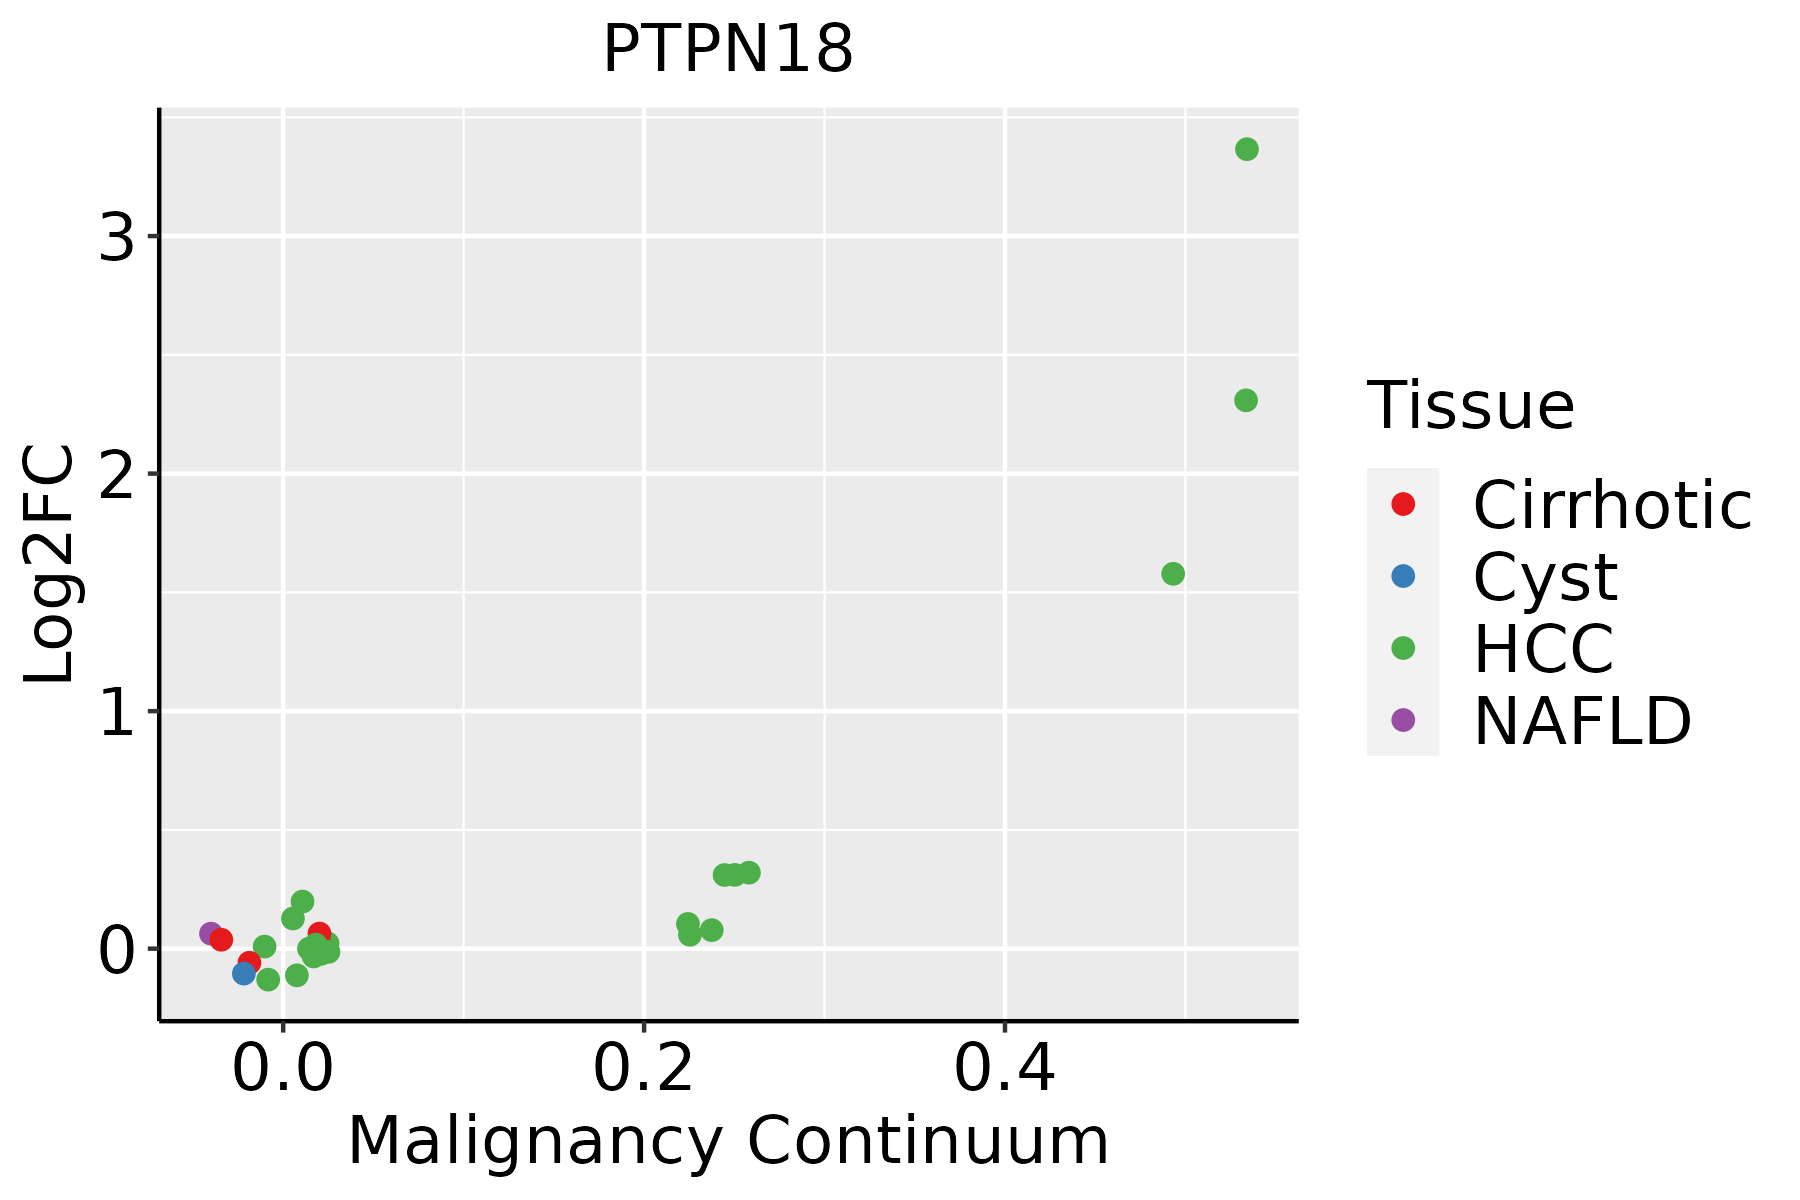 | HCC: Hepatocellular carcinoma |
| NAFLD: Non-alcoholic fatty liver disease | ||
| Oral Cavity |  | EOLP: Erosive Oral lichen planus |
| LP: leukoplakia | ||
| NEOLP: Non-erosive oral lichen planus | ||
| OSCC: Oral squamous cell carcinoma |
| ∗log2FC in expression of this searched gene in stem-like cells from each diseased tissue sample relative to stem-like cells in normal samples in each tissue plotted against the malignancy continuum. Samples are colored based on if they are from different disease stage. |
Top |
Malignant transformation related pathway analysis |
| Find out the enriched GO biological processes and KEGG pathways involved in transition from healthy to precancer to cancer |
| Tissue | Disease Stage | Enriched GO biological Processes |
| Colorectum | AD |  |
| Colorectum | SER |  |
| Colorectum | MSS |  |
| Colorectum | MSI-H |  |
| Colorectum | FAP |  |
| ∗Top 15 enriched GO BP terms are showed in the bar plot of each disease state in each tissue. Each row represents a significant GO biological process which is colored according to the -log10(p.adjust). |
| Page: 1 2 3 4 5 6 7 8 9 |
| GO ID | Tissue | Disease Stage | Description | Gene Ratio | Bg Ratio | pvalue | p.adjust | Count |
| GO:0038127 | Colorectum | AD | ERBB signaling pathway | 55/3918 | 121/18723 | 1.19e-09 | 8.85e-08 | 55 |
| GO:1901185 | Colorectum | AD | negative regulation of ERBB signaling pathway | 19/3918 | 32/18723 | 2.39e-06 | 6.98e-05 | 19 |
| GO:1901184 | Colorectum | AD | regulation of ERBB signaling pathway | 34/3918 | 79/18723 | 7.46e-06 | 1.82e-04 | 34 |
| GO:0016311 | Colorectum | AD | dephosphorylation | 123/3918 | 417/18723 | 1.84e-05 | 3.82e-04 | 123 |
| GO:0001701 | Colorectum | AD | in utero embryonic development | 110/3918 | 367/18723 | 2.36e-05 | 4.62e-04 | 110 |
| GO:0006470 | Colorectum | AD | protein dephosphorylation | 88/3918 | 281/18723 | 2.56e-05 | 4.89e-04 | 88 |
| GO:00381271 | Colorectum | SER | ERBB signaling pathway | 35/2897 | 121/18723 | 1.21e-04 | 2.49e-03 | 35 |
| GO:00064701 | Colorectum | SER | protein dephosphorylation | 65/2897 | 281/18723 | 4.44e-04 | 6.51e-03 | 65 |
| GO:19011851 | Colorectum | SER | negative regulation of ERBB signaling pathway | 12/2897 | 32/18723 | 2.00e-03 | 1.98e-02 | 12 |
| GO:00163111 | Colorectum | SER | dephosphorylation | 86/2897 | 417/18723 | 2.73e-03 | 2.46e-02 | 86 |
| GO:00017011 | Colorectum | SER | in utero embryonic development | 77/2897 | 367/18723 | 2.77e-03 | 2.48e-02 | 77 |
| GO:00381274 | Colorectum | FAP | ERBB signaling pathway | 45/2622 | 121/18723 | 1.64e-10 | 4.38e-08 | 45 |
| GO:00163113 | Colorectum | FAP | dephosphorylation | 95/2622 | 417/18723 | 7.07e-07 | 3.32e-05 | 95 |
| GO:00064704 | Colorectum | FAP | protein dephosphorylation | 69/2622 | 281/18723 | 1.47e-06 | 6.39e-05 | 69 |
| GO:19011842 | Colorectum | FAP | regulation of ERBB signaling pathway | 27/2622 | 79/18723 | 4.77e-06 | 1.57e-04 | 27 |
| GO:19011853 | Colorectum | FAP | negative regulation of ERBB signaling pathway | 15/2622 | 32/18723 | 8.00e-06 | 2.38e-04 | 15 |
| GO:00017013 | Colorectum | FAP | in utero embryonic development | 81/2622 | 367/18723 | 1.58e-05 | 4.10e-04 | 81 |
| GO:0035335 | Colorectum | FAP | peptidyl-tyrosine dephosphorylation | 23/2622 | 97/18723 | 6.95e-03 | 4.26e-02 | 23 |
| GO:000170118 | Esophagus | HGIN | in utero embryonic development | 77/2587 | 367/18723 | 9.56e-05 | 2.05e-03 | 77 |
| GO:000647017 | Esophagus | HGIN | protein dephosphorylation | 61/2587 | 281/18723 | 1.86e-04 | 3.51e-03 | 61 |
| Page: 1 2 3 |
| Pathway ID | Tissue | Disease Stage | Description | Gene Ratio | Bg Ratio | pvalue | p.adjust | qvalue | Count |
| Page: 1 |
Top |
Cell-cell communication analysis |
| Identification of potential cell-cell interactions between two cell types and their ligand-receptor pairs for different disease states |
| Ligand | Receptor | LRpair | Pathway | Tissue | Disease Stage |
| Page: 1 |
Top |
Single-cell gene regulatory network inference analysis |
| Find out the significant the regulons (TFs) and the target genes of each regulon across cell types for different disease states |
| TF | Cell Type | Tissue | Disease Stage | Target Gene | RSS | Regulon Activity |
| ∗The dot plots of a searched regulon are shown for all cell subpopulations in each disease state of each tissue based on the regulon specific score inferred using pySCENIC and by calculating the average expression. |
| Page: 1 |
Top |
Somatic mutation of malignant transformation related genes |
| Annotation of somatic variants for genes involved in malignant transformation |
| Hugo Symbol | Variant Class | Variant Classification | dbSNP RS | HGVSc | HGVSp | HGVSp Short | SWISSPROT | BIOTYPE | SIFT | PolyPhen | Tumor Sample Barcode | Tissue | Histology | Sex | Age | Stage | Therapy Types | Drugs | Outcome |
| PTPN18 | SNV | Missense_Mutation | rs766772512 | c.946N>A | p.Asp316Asn | p.D316N | Q99952 | protein_coding | tolerated(0.26) | benign(0.084) | TCGA-AN-A046-01 | Breast | breast invasive carcinoma | Female | >=65 | I/II | Unknown | Unknown | SD |
| PTPN18 | SNV | Missense_Mutation | novel | c.308C>T | p.Ala103Val | p.A103V | Q99952 | protein_coding | deleterious(0) | probably_damaging(0.988) | TCGA-E2-A573-01 | Breast | breast invasive carcinoma | Female | <65 | I/II | Chemotherapy | taxotere | CR |
| PTPN18 | SNV | Missense_Mutation | novel | c.713T>C | p.Val238Ala | p.V238A | Q99952 | protein_coding | deleterious(0.01) | probably_damaging(0.999) | TCGA-2W-A8YY-01 | Cervix | cervical & endocervical cancer | Female | <65 | I/II | Chemotherapy | cisplatin | CR |
| PTPN18 | SNV | Missense_Mutation | novel | c.340N>C | p.Asp114His | p.D114H | Q99952 | protein_coding | deleterious(0) | probably_damaging(1) | TCGA-C5-A8XH-01 | Cervix | cervical & endocervical cancer | Female | <65 | I/II | Unknown | Unknown | SD |
| PTPN18 | SNV | Missense_Mutation | novel | c.199C>T | p.Pro67Ser | p.P67S | Q99952 | protein_coding | tolerated(0.06) | possibly_damaging(0.499) | TCGA-VS-A8EG-01 | Cervix | cervical & endocervical cancer | Female | <65 | I/II | Unknown | Unknown | SD |
| PTPN18 | SNV | Missense_Mutation | novel | c.784G>C | p.Asp262His | p.D262H | Q99952 | protein_coding | deleterious(0.03) | possibly_damaging(0.588) | TCGA-ZJ-AAXT-01 | Cervix | cervical & endocervical cancer | Female | <65 | III/IV | Unknown | Unknown | SD |
| PTPN18 | SNV | Missense_Mutation | rs772861869 | c.592C>T | p.Arg198Cys | p.R198C | Q99952 | protein_coding | deleterious(0) | possibly_damaging(0.858) | TCGA-AA-A004-01 | Colorectum | colon adenocarcinoma | Male | >=65 | I/II | Unknown | Unknown | SD |
| PTPN18 | SNV | Missense_Mutation | rs745378946 | c.704N>A | p.Arg235Gln | p.R235Q | Q99952 | protein_coding | deleterious(0) | probably_damaging(0.999) | TCGA-AD-6889-01 | Colorectum | colon adenocarcinoma | Male | >=65 | I/II | Chemotherapy | xeloda | PD |
| PTPN18 | SNV | Missense_Mutation | c.218T>C | p.Val73Ala | p.V73A | Q99952 | protein_coding | deleterious(0.03) | benign(0.173) | TCGA-F4-6856-01 | Colorectum | colon adenocarcinoma | Male | <65 | I/II | Ancillary | leucovorin | CR | |
| PTPN18 | SNV | Missense_Mutation | novel | c.729N>A | p.Asp243Glu | p.D243E | Q99952 | protein_coding | tolerated(0.14) | possibly_damaging(0.674) | TCGA-F5-6814-01 | Colorectum | rectum adenocarcinoma | Male | <65 | I/II | Unknown | Unknown | SD |
| Page: 1 2 3 4 |
Top |
Related drugs of malignant transformation related genes |
| Identification of chemicals and drugs interact with genes involved in malignant transfromation |
| (DGIdb 4.0) |
| Entrez ID | Symbol | Category | Interaction Types | Drug Claim Name | Drug Name | PMIDs |
| Page: 1 |

Copyright 2023-Present -The University of Texas Health Science Center at Houston |