
|
|||||
|
 | |
| |
| |
| |
| |
| |
|
Gene: PTK6 |
Gene summary for PTK6 |
| Gene information | Species | Human | Gene symbol | PTK6 | Gene ID | 5753 |
| Gene name | protein tyrosine kinase 6 | |
| Gene Alias | BRK | |
| Cytomap | 20q13.33 | |
| Gene Type | protein-coding | GO ID | GO:0001932 | UniProtAcc | Q13882 |
Top |
Malignant transformation analysis |
| Identification of the aberrant gene expression in precancerous and cancerous lesions by comparing the gene expression of stem-like cells in diseased tissues with normal stem cells |
| Entrez ID | Symbol | Replicates | Species | Organ | Tissue | Adj P-value | Log2FC | Malignancy |
| 5753 | PTK6 | P54T-E | Human | Esophagus | ESCC | 2.80e-14 | 4.13e-01 | 0.0975 |
| 5753 | PTK6 | P57T-E | Human | Esophagus | ESCC | 1.10e-09 | 2.21e-01 | 0.0926 |
| 5753 | PTK6 | P62T-E | Human | Esophagus | ESCC | 1.24e-11 | 3.69e-01 | 0.1302 |
| 5753 | PTK6 | P65T-E | Human | Esophagus | ESCC | 4.79e-03 | 1.76e-01 | 0.0978 |
| 5753 | PTK6 | P74T-E | Human | Esophagus | ESCC | 1.48e-14 | 4.76e-01 | 0.1479 |
| 5753 | PTK6 | P75T-E | Human | Esophagus | ESCC | 1.85e-53 | 1.02e+00 | 0.1125 |
| 5753 | PTK6 | P82T-E | Human | Esophagus | ESCC | 9.75e-19 | 1.22e+00 | 0.1072 |
| 5753 | PTK6 | P89T-E | Human | Esophagus | ESCC | 1.01e-19 | 1.22e+00 | 0.1752 |
| 5753 | PTK6 | P91T-E | Human | Esophagus | ESCC | 8.51e-10 | 1.52e+00 | 0.1828 |
| 5753 | PTK6 | P94T-E | Human | Esophagus | ESCC | 2.29e-06 | 1.09e+00 | 0.0879 |
| 5753 | PTK6 | P104T-E | Human | Esophagus | ESCC | 3.35e-09 | 7.53e-01 | 0.0931 |
| 5753 | PTK6 | P107T-E | Human | Esophagus | ESCC | 3.94e-02 | 5.24e-02 | 0.171 |
| 5753 | PTK6 | P126T-E | Human | Esophagus | ESCC | 3.89e-04 | 4.75e-01 | 0.1125 |
| 5753 | PTK6 | P127T-E | Human | Esophagus | ESCC | 8.70e-15 | 3.00e-01 | 0.0826 |
| 5753 | PTK6 | P128T-E | Human | Esophagus | ESCC | 1.29e-23 | 7.08e-01 | 0.1241 |
| 5753 | PTK6 | P130T-E | Human | Esophagus | ESCC | 6.36e-29 | 5.15e-01 | 0.1676 |
| 5753 | PTK6 | HCC2_Meng | Human | Liver | HCC | 9.75e-32 | 3.07e-01 | 0.0107 |
| 5753 | PTK6 | HCC1 | Human | Liver | HCC | 1.32e-11 | 1.23e+00 | 0.5336 |
| 5753 | PTK6 | HCC2 | Human | Liver | HCC | 7.56e-23 | 1.84e+00 | 0.5341 |
| 5753 | PTK6 | HCC5 | Human | Liver | HCC | 1.01e-41 | 2.43e+00 | 0.4932 |
| Page: 1 2 3 4 |
| Tissue | Expression Dynamics | Abbreviation |
| Colorectum (GSE201348) |  | FAP: Familial adenomatous polyposis |
| CRC: Colorectal cancer | ||
| Colorectum (HTA11) |  | AD: Adenomas |
| SER: Sessile serrated lesions | ||
| MSI-H: Microsatellite-high colorectal cancer | ||
| MSS: Microsatellite stable colorectal cancer | ||
| Esophagus |  | ESCC: Esophageal squamous cell carcinoma |
| HGIN: High-grade intraepithelial neoplasias | ||
| LGIN: Low-grade intraepithelial neoplasias | ||
| Liver | 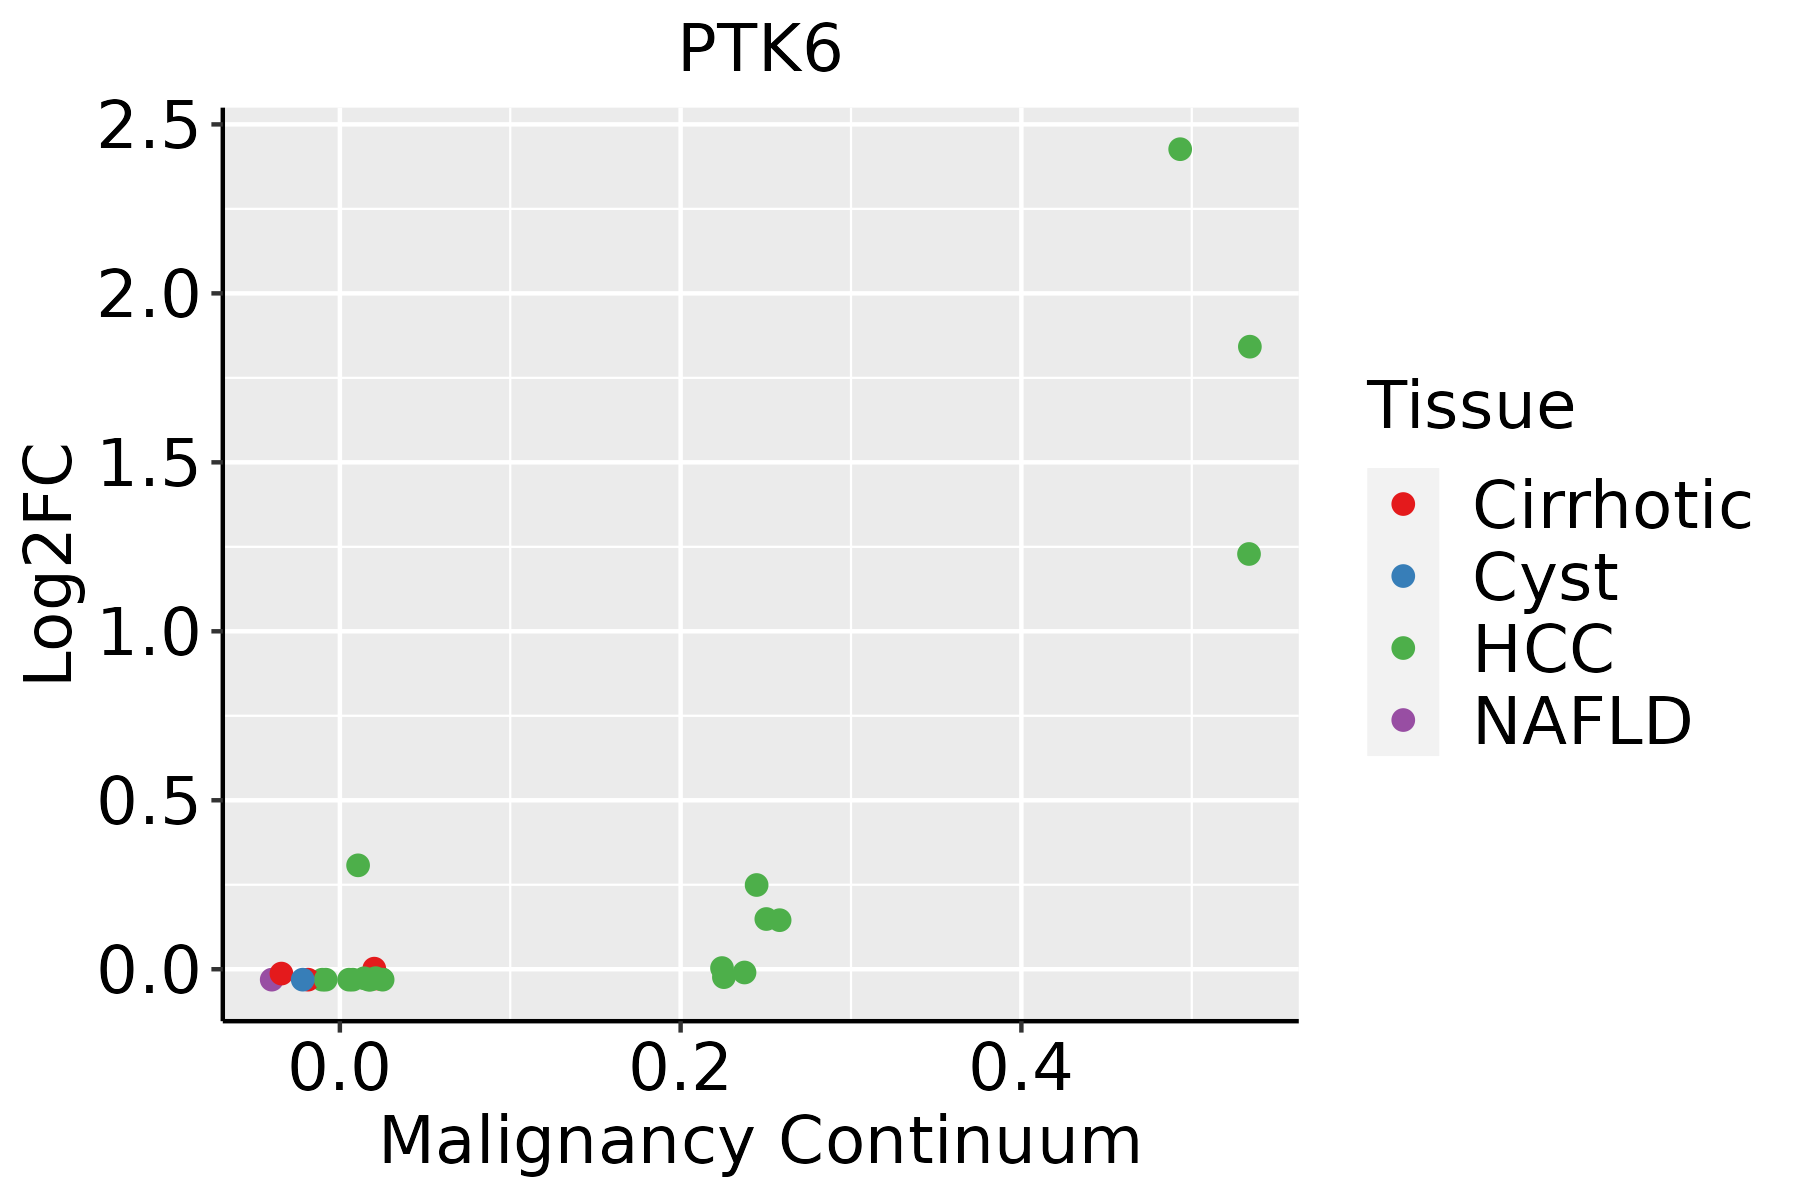 | HCC: Hepatocellular carcinoma |
| NAFLD: Non-alcoholic fatty liver disease | ||
| Oral Cavity |  | EOLP: Erosive Oral lichen planus |
| LP: leukoplakia | ||
| NEOLP: Non-erosive oral lichen planus | ||
| OSCC: Oral squamous cell carcinoma |
| ∗log2FC in expression of this searched gene in stem-like cells from each diseased tissue sample relative to stem-like cells in normal samples in each tissue plotted against the malignancy continuum. Samples are colored based on if they are from different disease stage. |
Top |
Malignant transformation related pathway analysis |
| Find out the enriched GO biological processes and KEGG pathways involved in transition from healthy to precancer to cancer |
| Tissue | Disease Stage | Enriched GO biological Processes |
| Colorectum | AD |  |
| Colorectum | SER |  |
| Colorectum | MSS |  |
| Colorectum | MSI-H |  |
| Colorectum | FAP |  |
| ∗Top 15 enriched GO BP terms are showed in the bar plot of each disease state in each tissue. Each row represents a significant GO biological process which is colored according to the -log10(p.adjust). |
| Page: 1 2 3 4 5 6 7 8 9 |
| GO ID | Tissue | Disease Stage | Description | Gene Ratio | Bg Ratio | pvalue | p.adjust | Count |
| GO:0038127 | Colorectum | AD | ERBB signaling pathway | 55/3918 | 121/18723 | 1.19e-09 | 8.85e-08 | 55 |
| GO:0007173 | Colorectum | AD | epidermal growth factor receptor signaling pathway | 50/3918 | 108/18723 | 3.08e-09 | 2.07e-07 | 50 |
| GO:1901184 | Colorectum | AD | regulation of ERBB signaling pathway | 34/3918 | 79/18723 | 7.46e-06 | 1.82e-04 | 34 |
| GO:0010563 | Colorectum | AD | negative regulation of phosphorus metabolic process | 130/3918 | 442/18723 | 1.26e-05 | 2.76e-04 | 130 |
| GO:0045936 | Colorectum | AD | negative regulation of phosphate metabolic process | 129/3918 | 441/18723 | 1.81e-05 | 3.76e-04 | 129 |
| GO:0051348 | Colorectum | AD | negative regulation of transferase activity | 85/3918 | 268/18723 | 2.07e-05 | 4.19e-04 | 85 |
| GO:0046777 | Colorectum | AD | protein autophosphorylation | 74/3918 | 227/18723 | 2.48e-05 | 4.76e-04 | 74 |
| GO:0042058 | Colorectum | AD | regulation of epidermal growth factor receptor signaling pathway | 31/3918 | 73/18723 | 2.56e-05 | 4.89e-04 | 31 |
| GO:0010975 | Colorectum | AD | regulation of neuron projection development | 129/3918 | 445/18723 | 2.88e-05 | 5.37e-04 | 129 |
| GO:0042326 | Colorectum | AD | negative regulation of phosphorylation | 112/3918 | 385/18723 | 8.02e-05 | 1.27e-03 | 112 |
| GO:0031346 | Colorectum | AD | positive regulation of cell projection organization | 104/3918 | 353/18723 | 8.26e-05 | 1.30e-03 | 104 |
| GO:0001933 | Colorectum | AD | negative regulation of protein phosphorylation | 101/3918 | 342/18723 | 9.39e-05 | 1.42e-03 | 101 |
| GO:0006469 | Colorectum | AD | negative regulation of protein kinase activity | 65/3918 | 212/18723 | 5.21e-04 | 5.62e-03 | 65 |
| GO:0033673 | Colorectum | AD | negative regulation of kinase activity | 71/3918 | 237/18723 | 6.18e-04 | 6.47e-03 | 71 |
| GO:0045926 | Colorectum | AD | negative regulation of growth | 70/3918 | 249/18723 | 4.07e-03 | 2.83e-02 | 70 |
| GO:0045787 | Colorectum | AD | positive regulation of cell cycle | 85/3918 | 313/18723 | 4.76e-03 | 3.22e-02 | 85 |
| GO:0061099 | Colorectum | AD | negative regulation of protein tyrosine kinase activity | 13/3918 | 31/18723 | 6.53e-03 | 4.06e-02 | 13 |
| GO:00513481 | Colorectum | SER | negative regulation of transferase activity | 70/2897 | 268/18723 | 4.27e-06 | 1.62e-04 | 70 |
| GO:00467771 | Colorectum | SER | protein autophosphorylation | 60/2897 | 227/18723 | 1.36e-05 | 4.25e-04 | 60 |
| GO:00105631 | Colorectum | SER | negative regulation of phosphorus metabolic process | 101/2897 | 442/18723 | 2.39e-05 | 6.70e-04 | 101 |
| Page: 1 2 3 4 5 6 7 |
| Pathway ID | Tissue | Disease Stage | Description | Gene Ratio | Bg Ratio | pvalue | p.adjust | qvalue | Count |
| Page: 1 |
Top |
Cell-cell communication analysis |
| Identification of potential cell-cell interactions between two cell types and their ligand-receptor pairs for different disease states |
| Ligand | Receptor | LRpair | Pathway | Tissue | Disease Stage |
| Page: 1 |
Top |
Single-cell gene regulatory network inference analysis |
| Find out the significant the regulons (TFs) and the target genes of each regulon across cell types for different disease states |
| TF | Cell Type | Tissue | Disease Stage | Target Gene | RSS | Regulon Activity |
| ∗The dot plots of a searched regulon are shown for all cell subpopulations in each disease state of each tissue based on the regulon specific score inferred using pySCENIC and by calculating the average expression. |
| Page: 1 |
Top |
Somatic mutation of malignant transformation related genes |
| Annotation of somatic variants for genes involved in malignant transformation |
| Hugo Symbol | Variant Class | Variant Classification | dbSNP RS | HGVSc | HGVSp | HGVSp Short | SWISSPROT | BIOTYPE | SIFT | PolyPhen | Tumor Sample Barcode | Tissue | Histology | Sex | Age | Stage | Therapy Types | Drugs | Outcome |
| PTK6 | SNV | Missense_Mutation | c.119N>C | p.Lys40Thr | p.K40T | Q13882 | protein_coding | tolerated(0.17) | possibly_damaging(0.661) | TCGA-AA-3492-01 | Colorectum | colon adenocarcinoma | Female | >=65 | I/II | Unknown | Unknown | SD | |
| PTK6 | SNV | Missense_Mutation | rs770065818 | c.832N>A | p.Asp278Asn | p.D278N | Q13882 | protein_coding | tolerated(0.43) | benign(0.001) | TCGA-AZ-6601-01 | Colorectum | colon adenocarcinoma | Male | >=65 | I/II | Unknown | Unknown | PD |
| PTK6 | SNV | Missense_Mutation | c.802G>A | p.Ala268Thr | p.A268T | Q13882 | protein_coding | tolerated(0.26) | benign(0.011) | TCGA-CK-5913-01 | Colorectum | colon adenocarcinoma | Female | <65 | I/II | Unknown | Unknown | SD | |
| PTK6 | SNV | Missense_Mutation | c.340T>C | p.Tyr114His | p.Y114H | Q13882 | protein_coding | tolerated(0.06) | benign(0.397) | TCGA-EI-6882-01 | Colorectum | rectum adenocarcinoma | Male | <65 | I/II | Unknown | Unknown | SD | |
| PTK6 | SNV | Missense_Mutation | rs761742593 | c.1313N>A | p.Arg438Gln | p.R438Q | Q13882 | protein_coding | tolerated(1) | benign(0.003) | TCGA-A5-A0G1-01 | Endometrium | uterine corpus endometrioid carcinoma | Female | >=65 | I/II | Unknown | Unknown | SD |
| PTK6 | SNV | Missense_Mutation | rs200723492 | c.619N>A | p.Glu207Lys | p.E207K | Q13882 | protein_coding | tolerated(0.1) | benign(0.135) | TCGA-A5-A2K5-01 | Endometrium | uterine corpus endometrioid carcinoma | Female | >=65 | I/II | Unknown | Unknown | SD |
| PTK6 | SNV | Missense_Mutation | rs757318592 | c.109N>A | p.Val37Met | p.V37M | Q13882 | protein_coding | deleterious(0) | probably_damaging(0.954) | TCGA-AJ-A3OL-01 | Endometrium | uterine corpus endometrioid carcinoma | Female | <65 | III/IV | Chemotherapy | carboplatin | PD |
| PTK6 | SNV | Missense_Mutation | novel | c.638G>A | p.Arg213Gln | p.R213Q | Q13882 | protein_coding | tolerated(0.55) | benign(0.001) | TCGA-AP-A059-01 | Endometrium | uterine corpus endometrioid carcinoma | Female | >=65 | I/II | Unknown | Unknown | SD |
| PTK6 | SNV | Missense_Mutation | novel | c.1137N>T | p.Glu379Asp | p.E379D | Q13882 | protein_coding | deleterious(0) | probably_damaging(0.998) | TCGA-AP-A0LM-01 | Endometrium | uterine corpus endometrioid carcinoma | Female | <65 | III/IV | Chemotherapy | cisplatin | SD |
| PTK6 | SNV | Missense_Mutation | novel | c.1222N>C | p.Cys408Arg | p.C408R | Q13882 | protein_coding | tolerated(0.45) | benign(0.007) | TCGA-AP-A1DK-01 | Endometrium | uterine corpus endometrioid carcinoma | Female | <65 | I/II | Unknown | Unknown | SD |
| Page: 1 2 3 4 |
Top |
Related drugs of malignant transformation related genes |
| Identification of chemicals and drugs interact with genes involved in malignant transfromation |
| (DGIdb 4.0) |
| Entrez ID | Symbol | Category | Interaction Types | Drug Claim Name | Drug Name | PMIDs |
| 5753 | PTK6 | DRUGGABLE GENOME, TRANSCRIPTION FACTOR, KINASE, TYROSINE KINASE, ENZYME | inhibitor | 249565866 | ||
| 5753 | PTK6 | DRUGGABLE GENOME, TRANSCRIPTION FACTOR, KINASE, TYROSINE KINASE, ENZYME | inhibitor | 315661136 | ||
| 5753 | PTK6 | DRUGGABLE GENOME, TRANSCRIPTION FACTOR, KINASE, TYROSINE KINASE, ENZYME | TAE-684 | TAE-684 | ||
| 5753 | PTK6 | DRUGGABLE GENOME, TRANSCRIPTION FACTOR, KINASE, TYROSINE KINASE, ENZYME | OSI-632 | OSI-632 | ||
| 5753 | PTK6 | DRUGGABLE GENOME, TRANSCRIPTION FACTOR, KINASE, TYROSINE KINASE, ENZYME | CEDIRANIB | CEDIRANIB | ||
| 5753 | PTK6 | DRUGGABLE GENOME, TRANSCRIPTION FACTOR, KINASE, TYROSINE KINASE, ENZYME | SB-202190 | SB-202190 | 22951114 | |
| 5753 | PTK6 | DRUGGABLE GENOME, TRANSCRIPTION FACTOR, KINASE, TYROSINE KINASE, ENZYME | inhibitor | CHEMBL24828 | VANDETANIB | |
| 5753 | PTK6 | DRUGGABLE GENOME, TRANSCRIPTION FACTOR, KINASE, TYROSINE KINASE, ENZYME | DASATINIB | DASATINIB | ||
| 5753 | PTK6 | DRUGGABLE GENOME, TRANSCRIPTION FACTOR, KINASE, TYROSINE KINASE, ENZYME | TAMATINIB | R-406 | ||
| 5753 | PTK6 | DRUGGABLE GENOME, TRANSCRIPTION FACTOR, KINASE, TYROSINE KINASE, ENZYME | ISIS-CRP |
| Page: 1 2 |

Copyright 2023-Present -The University of Texas Health Science Center at Houston |