
|
|||||
|
 | |
| |
| |
| |
| |
| |
|
Gene: PTGR1 |
Gene summary for PTGR1 |
| Gene information | Species | Human | Gene symbol | PTGR1 | Gene ID | 22949 |
| Gene name | prostaglandin reductase 1 | |
| Gene Alias | DIG-1 | |
| Cytomap | 9q31.3 | |
| Gene Type | protein-coding | GO ID | GO:0006082 | UniProtAcc | Q14914 |
Top |
Malignant transformation analysis |
| Identification of the aberrant gene expression in precancerous and cancerous lesions by comparing the gene expression of stem-like cells in diseased tissues with normal stem cells |
| Entrez ID | Symbol | Replicates | Species | Organ | Tissue | Adj P-value | Log2FC | Malignancy |
| 22949 | PTGR1 | P22T-E | Human | Esophagus | ESCC | 5.68e-43 | 9.51e-01 | 0.1236 |
| 22949 | PTGR1 | P23T-E | Human | Esophagus | ESCC | 3.68e-16 | 4.87e-01 | 0.108 |
| 22949 | PTGR1 | P24T-E | Human | Esophagus | ESCC | 3.53e-10 | 3.06e-01 | 0.1287 |
| 22949 | PTGR1 | P26T-E | Human | Esophagus | ESCC | 4.42e-11 | 1.65e-01 | 0.1276 |
| 22949 | PTGR1 | P27T-E | Human | Esophagus | ESCC | 1.13e-33 | 8.20e-01 | 0.1055 |
| 22949 | PTGR1 | P28T-E | Human | Esophagus | ESCC | 6.90e-44 | 1.17e+00 | 0.1149 |
| 22949 | PTGR1 | P30T-E | Human | Esophagus | ESCC | 2.85e-57 | 3.69e+00 | 0.137 |
| 22949 | PTGR1 | P31T-E | Human | Esophagus | ESCC | 3.20e-16 | 4.87e-01 | 0.1251 |
| 22949 | PTGR1 | P32T-E | Human | Esophagus | ESCC | 1.01e-61 | 1.81e+00 | 0.1666 |
| 22949 | PTGR1 | P37T-E | Human | Esophagus | ESCC | 1.33e-24 | 6.20e-01 | 0.1371 |
| 22949 | PTGR1 | P38T-E | Human | Esophagus | ESCC | 4.17e-13 | 9.49e-01 | 0.127 |
| 22949 | PTGR1 | P39T-E | Human | Esophagus | ESCC | 5.32e-37 | 1.12e+00 | 0.0894 |
| 22949 | PTGR1 | P40T-E | Human | Esophagus | ESCC | 1.43e-11 | 4.88e-01 | 0.109 |
| 22949 | PTGR1 | P42T-E | Human | Esophagus | ESCC | 5.07e-25 | 1.76e+00 | 0.1175 |
| 22949 | PTGR1 | P44T-E | Human | Esophagus | ESCC | 1.56e-05 | 2.90e-01 | 0.1096 |
| 22949 | PTGR1 | P47T-E | Human | Esophagus | ESCC | 2.30e-20 | 5.30e-01 | 0.1067 |
| 22949 | PTGR1 | P48T-E | Human | Esophagus | ESCC | 1.18e-30 | 1.10e+00 | 0.0959 |
| 22949 | PTGR1 | P49T-E | Human | Esophagus | ESCC | 1.73e-21 | 3.69e+00 | 0.1768 |
| 22949 | PTGR1 | P52T-E | Human | Esophagus | ESCC | 6.73e-43 | 1.19e+00 | 0.1555 |
| 22949 | PTGR1 | P54T-E | Human | Esophagus | ESCC | 1.53e-13 | 3.98e-01 | 0.0975 |
| Page: 1 2 3 4 5 6 7 8 9 |
| Tissue | Expression Dynamics | Abbreviation |
| Endometrium |  | AEH: Atypical endometrial hyperplasia |
| EEC: Endometrioid Cancer | ||
| Esophagus | 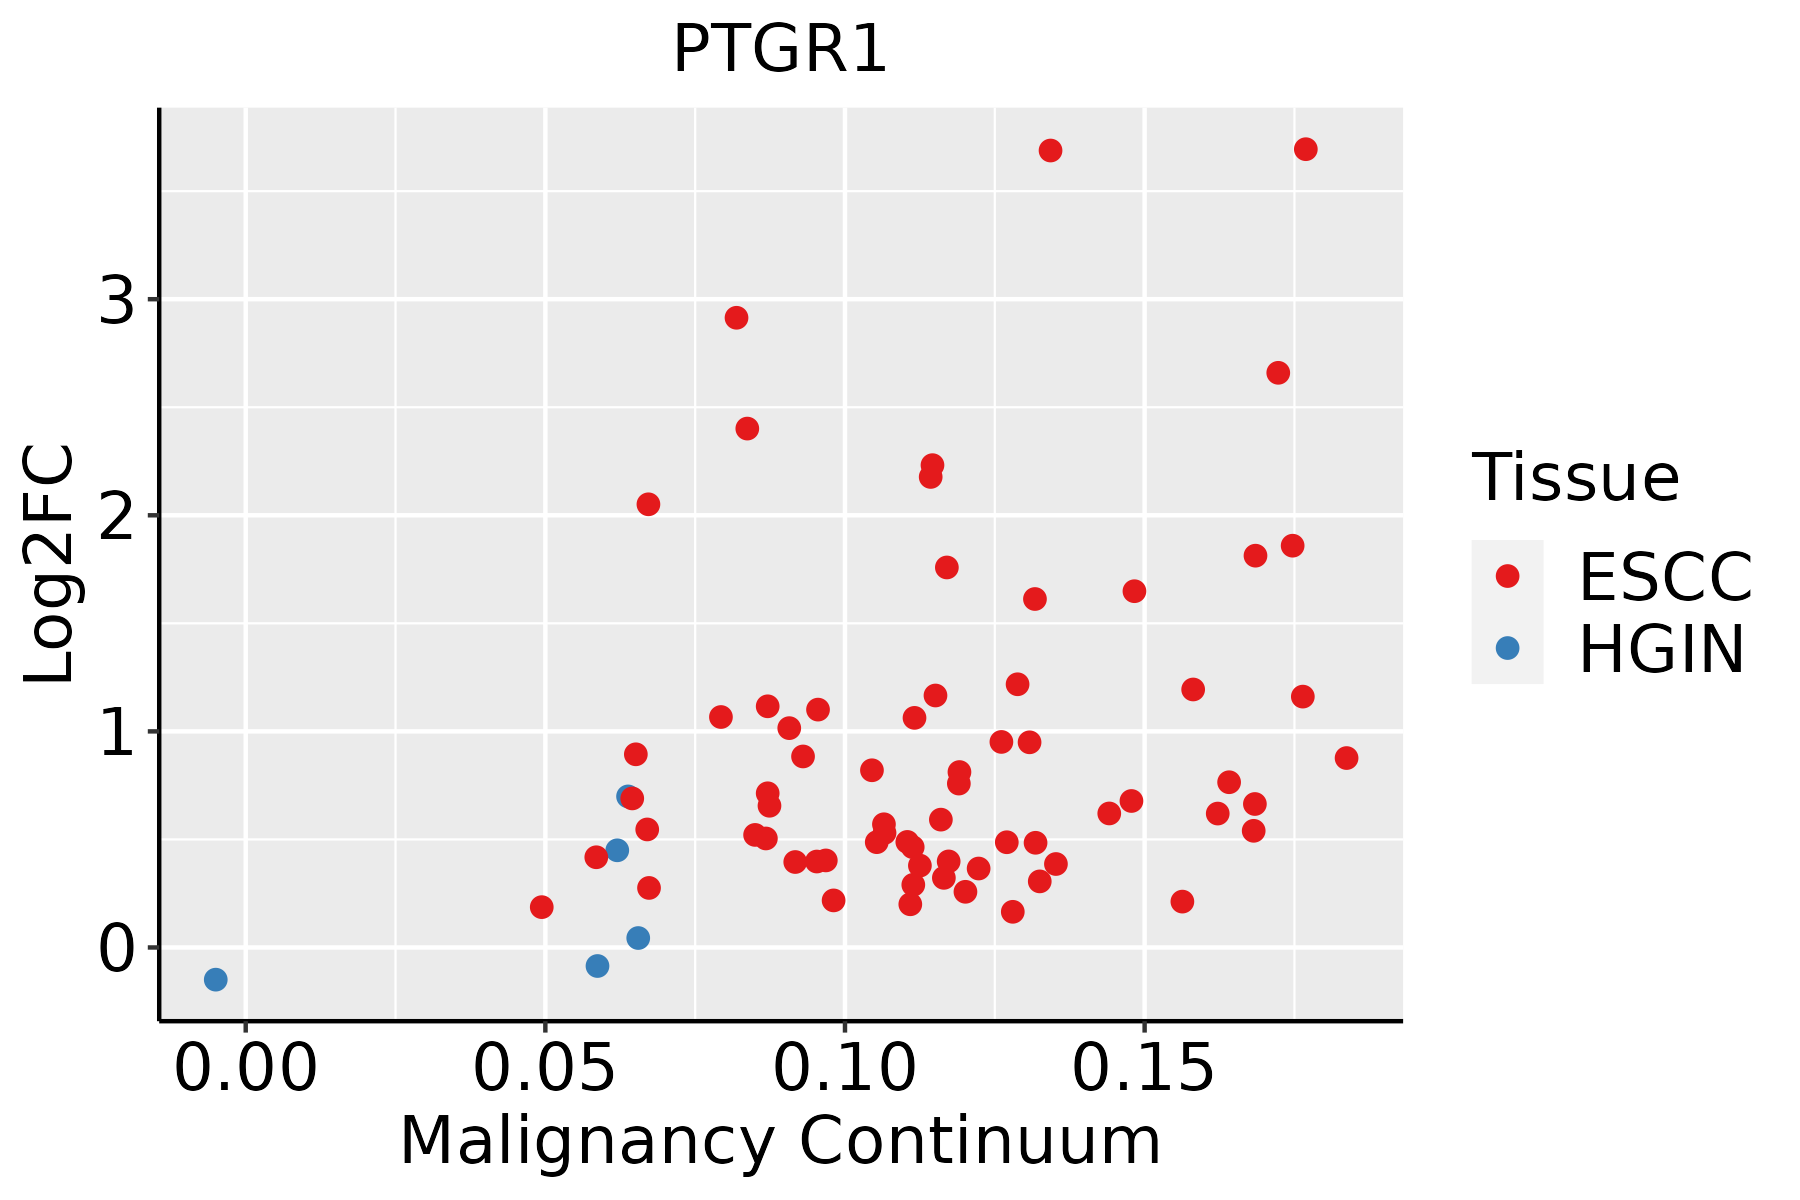 | ESCC: Esophageal squamous cell carcinoma |
| HGIN: High-grade intraepithelial neoplasias | ||
| LGIN: Low-grade intraepithelial neoplasias | ||
| GC | 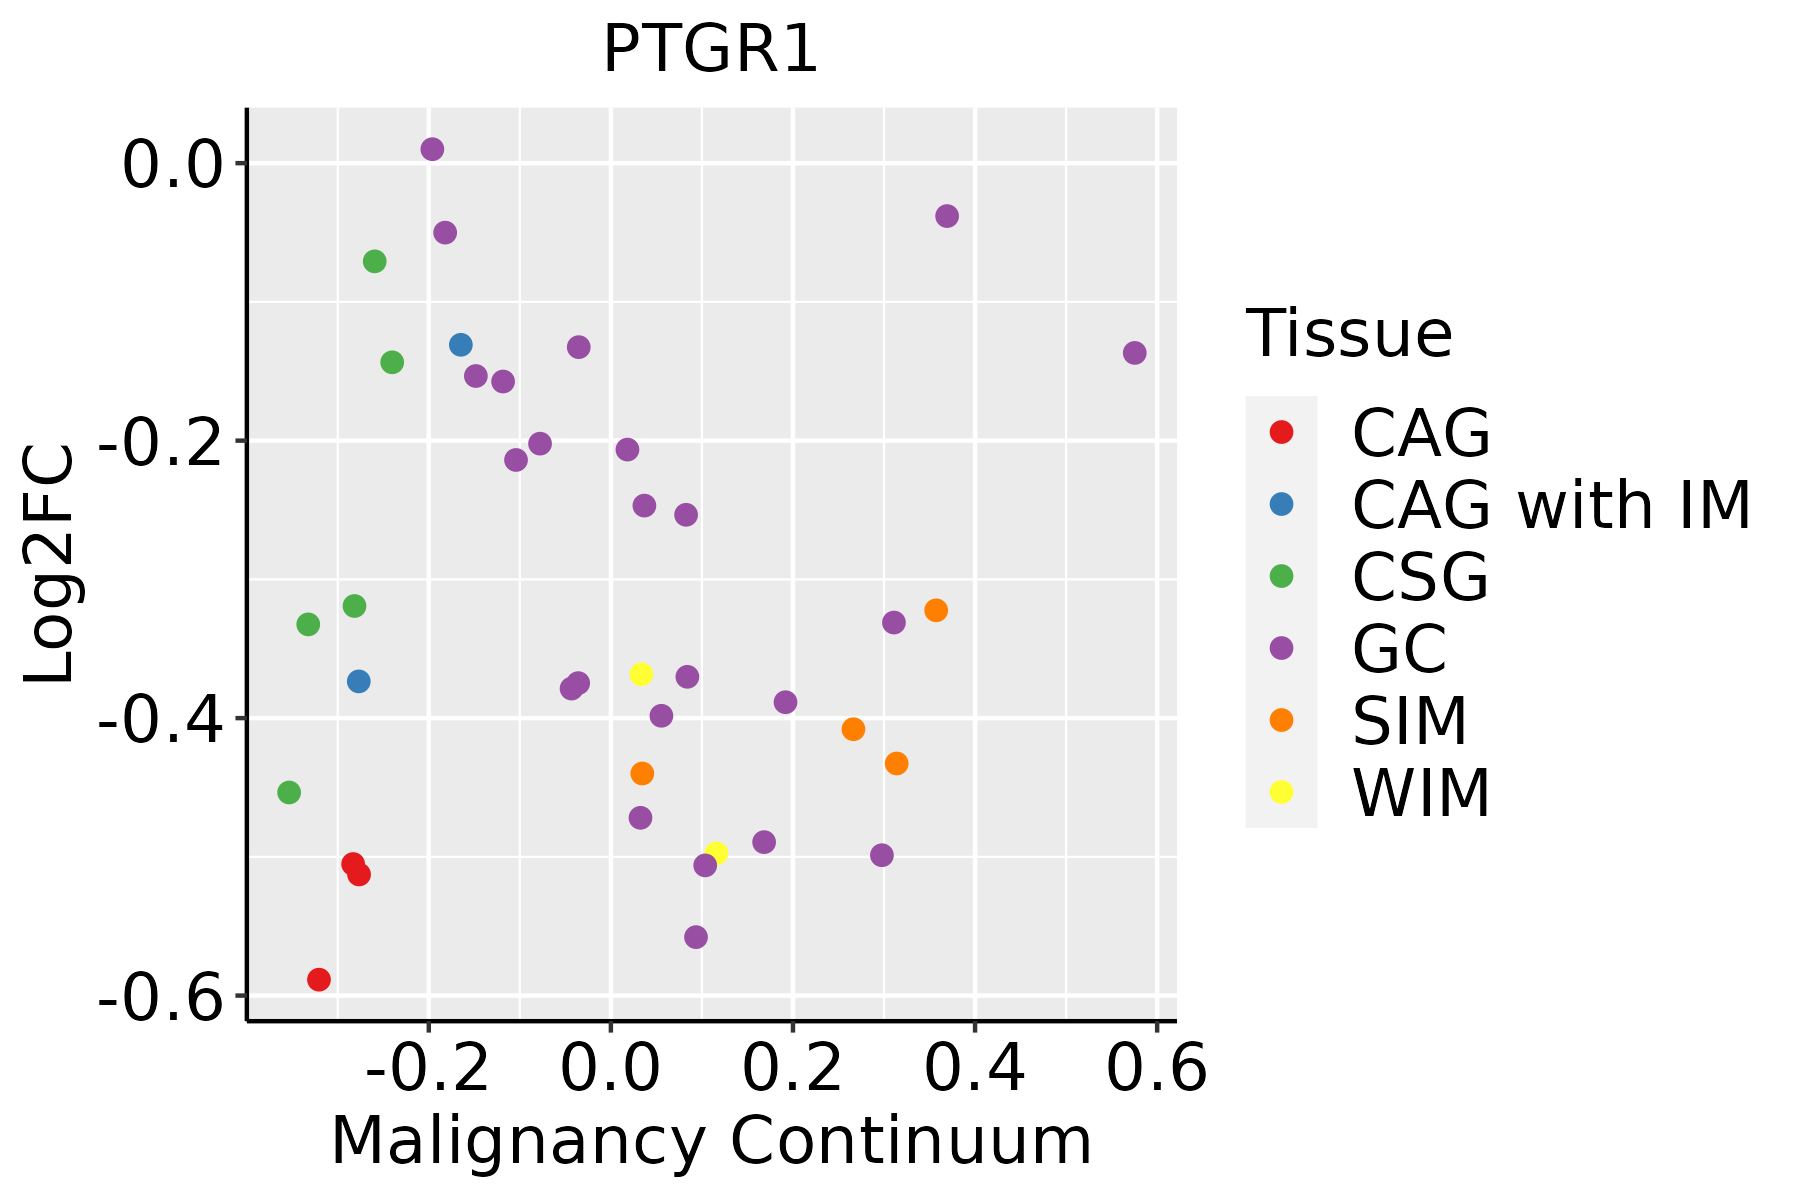 | CAG: Chronic atrophic gastritis |
| CAG with IM: Chronic atrophic gastritis with intestinal metaplasia | ||
| CSG: Chronic superficial gastritis | ||
| GC: Gastric cancer | ||
| SIM: Severe intestinal metaplasia | ||
| WIM: Wild intestinal metaplasia | ||
| Liver |  | HCC: Hepatocellular carcinoma |
| NAFLD: Non-alcoholic fatty liver disease | ||
| Oral Cavity | 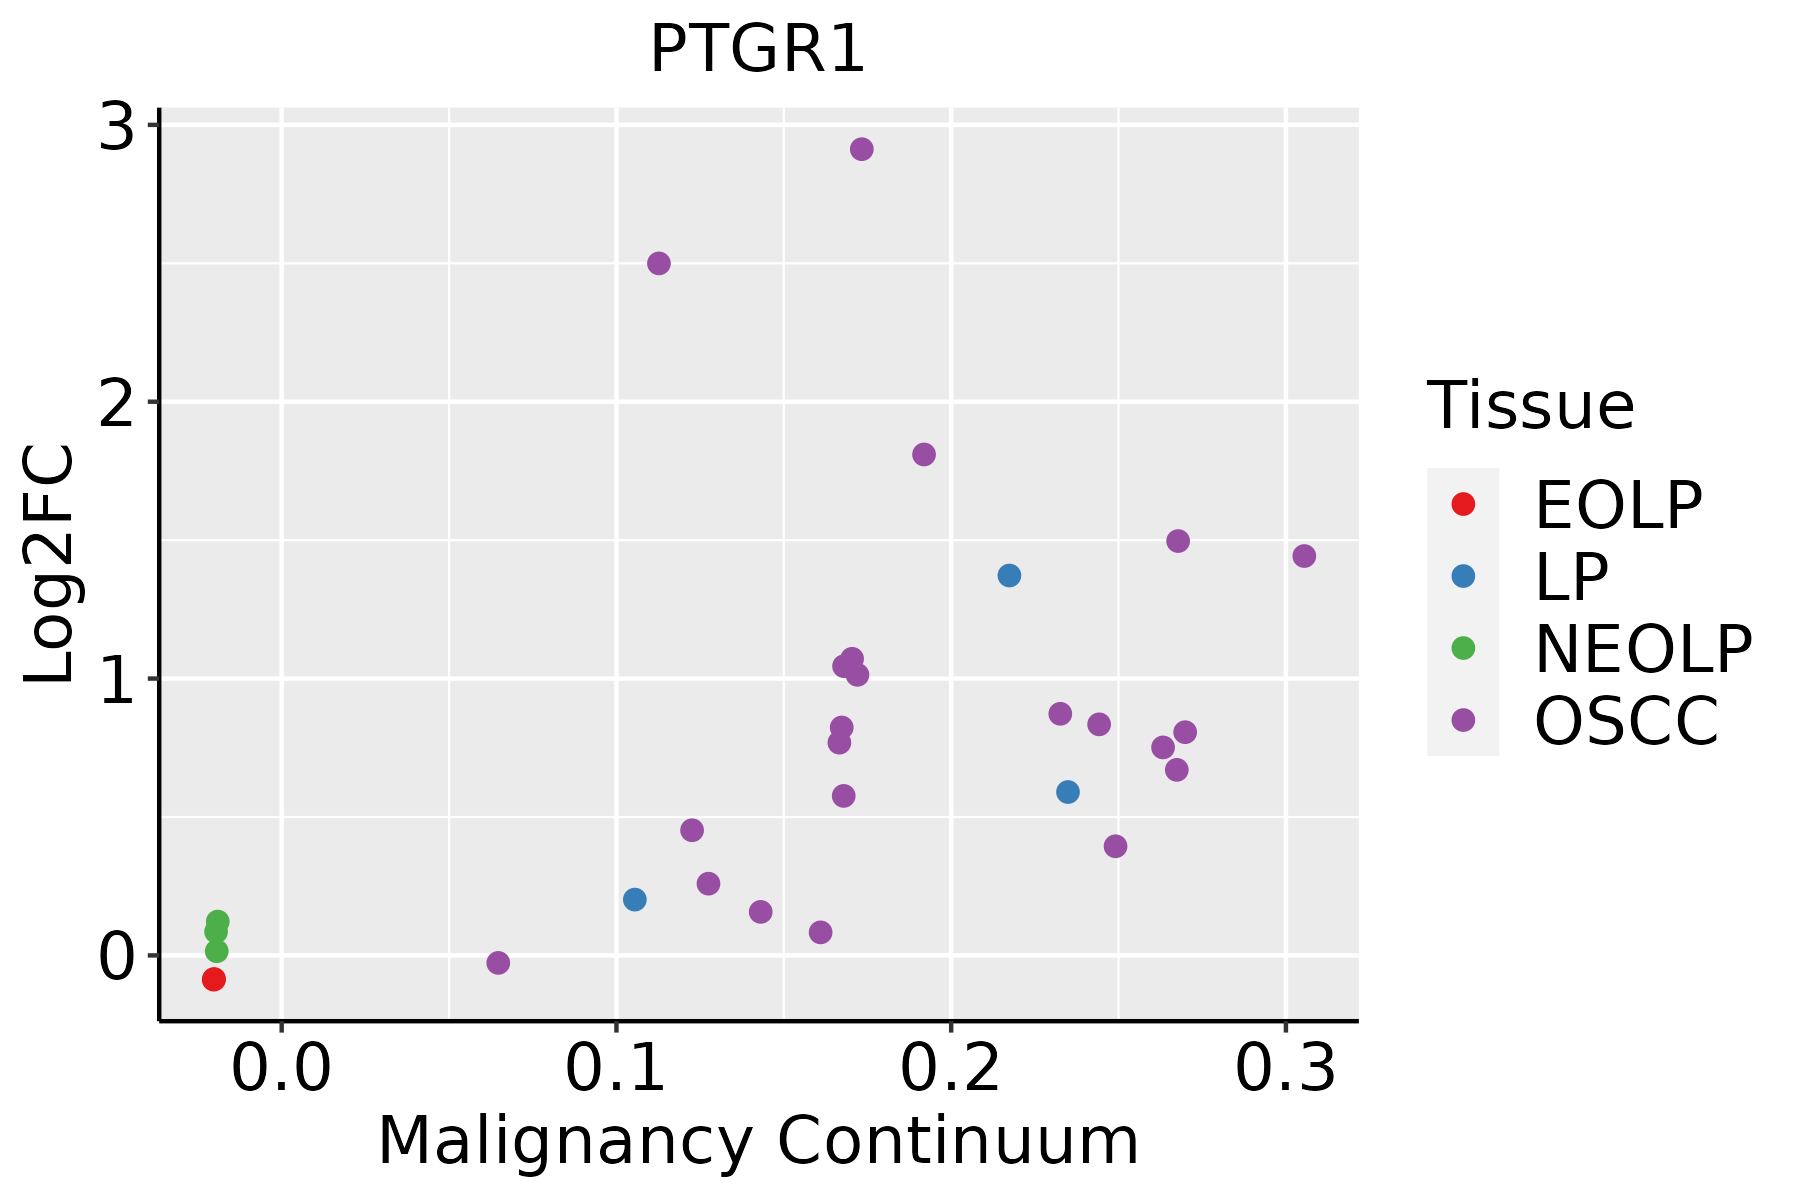 | EOLP: Erosive Oral lichen planus |
| LP: leukoplakia | ||
| NEOLP: Non-erosive oral lichen planus | ||
| OSCC: Oral squamous cell carcinoma | ||
| Prostate |  | BPH: Benign Prostatic Hyperplasia |
| Skin | 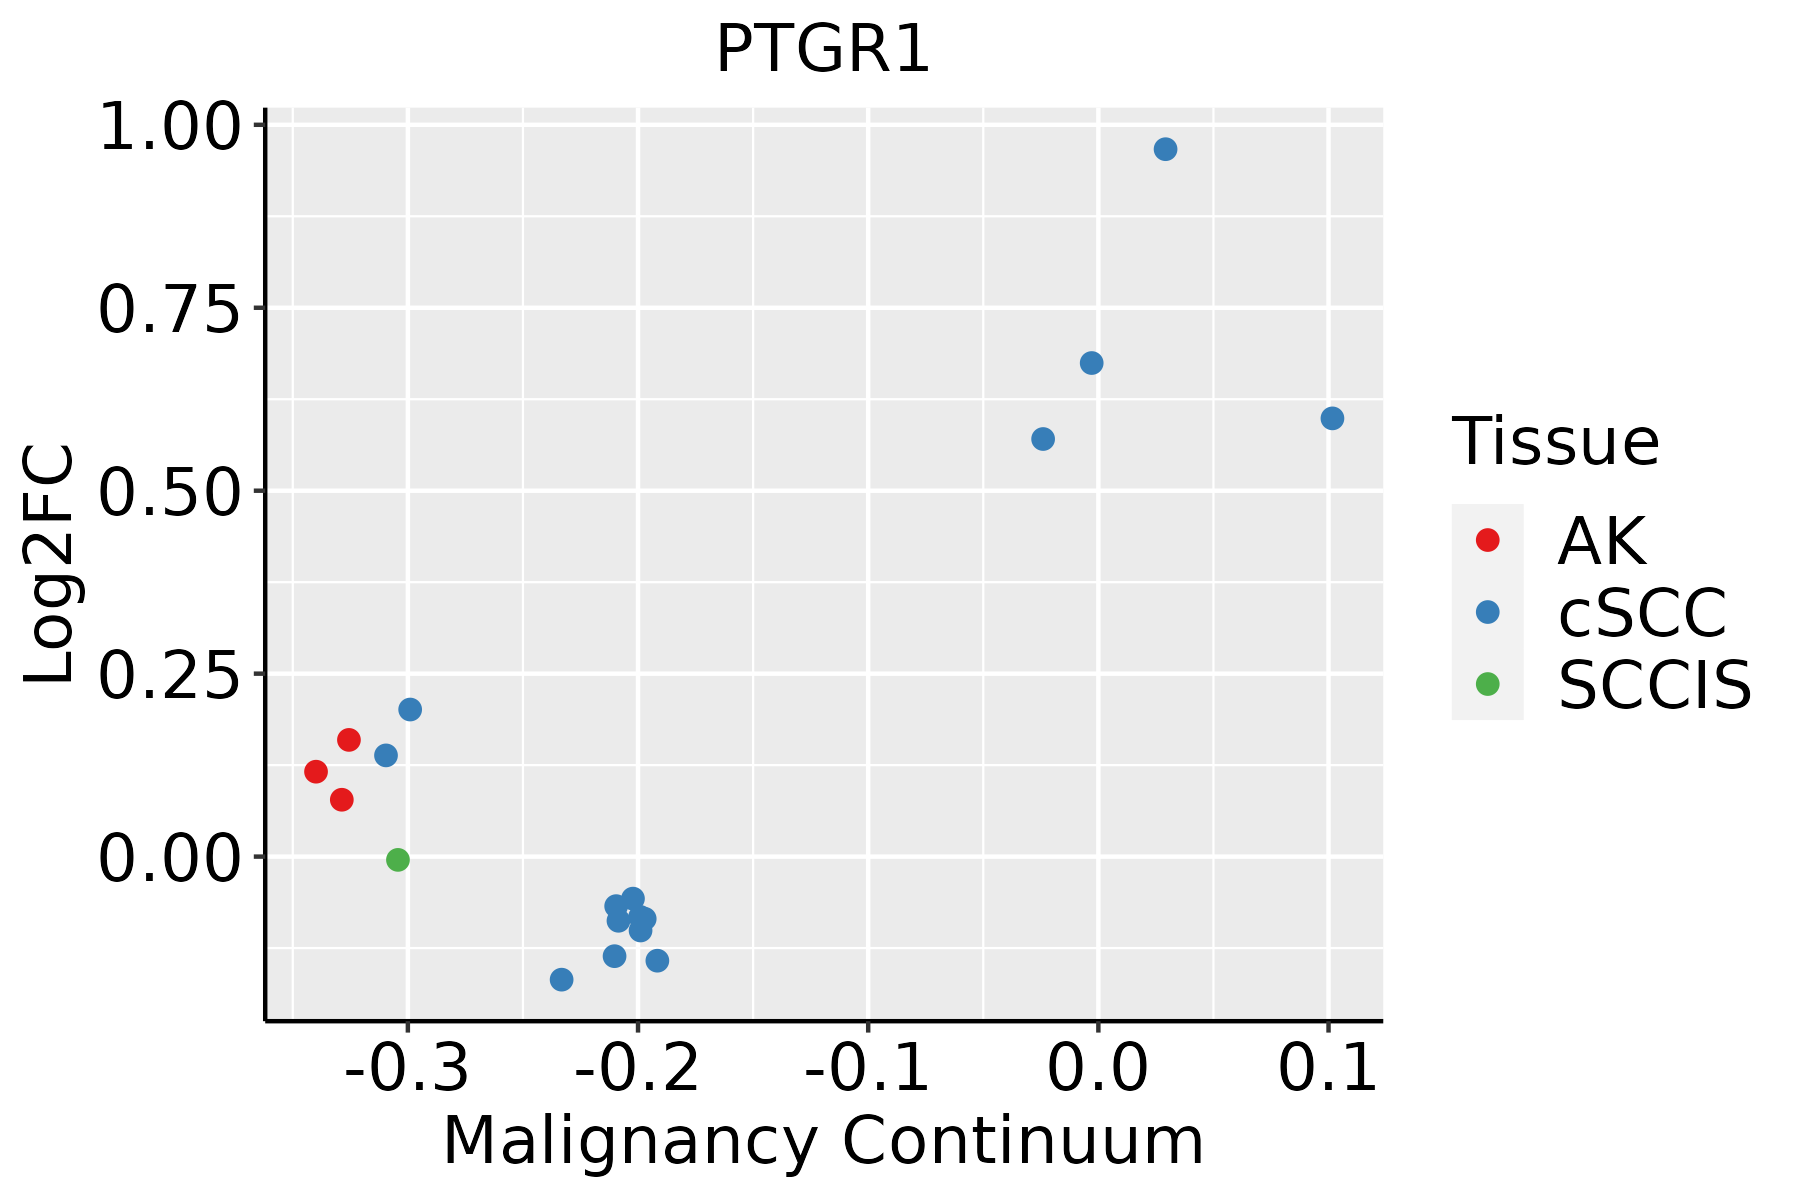 | AK: Actinic keratosis |
| cSCC: Cutaneous squamous cell carcinoma | ||
| SCCIS:squamous cell carcinoma in situ | ||
| Thyroid | 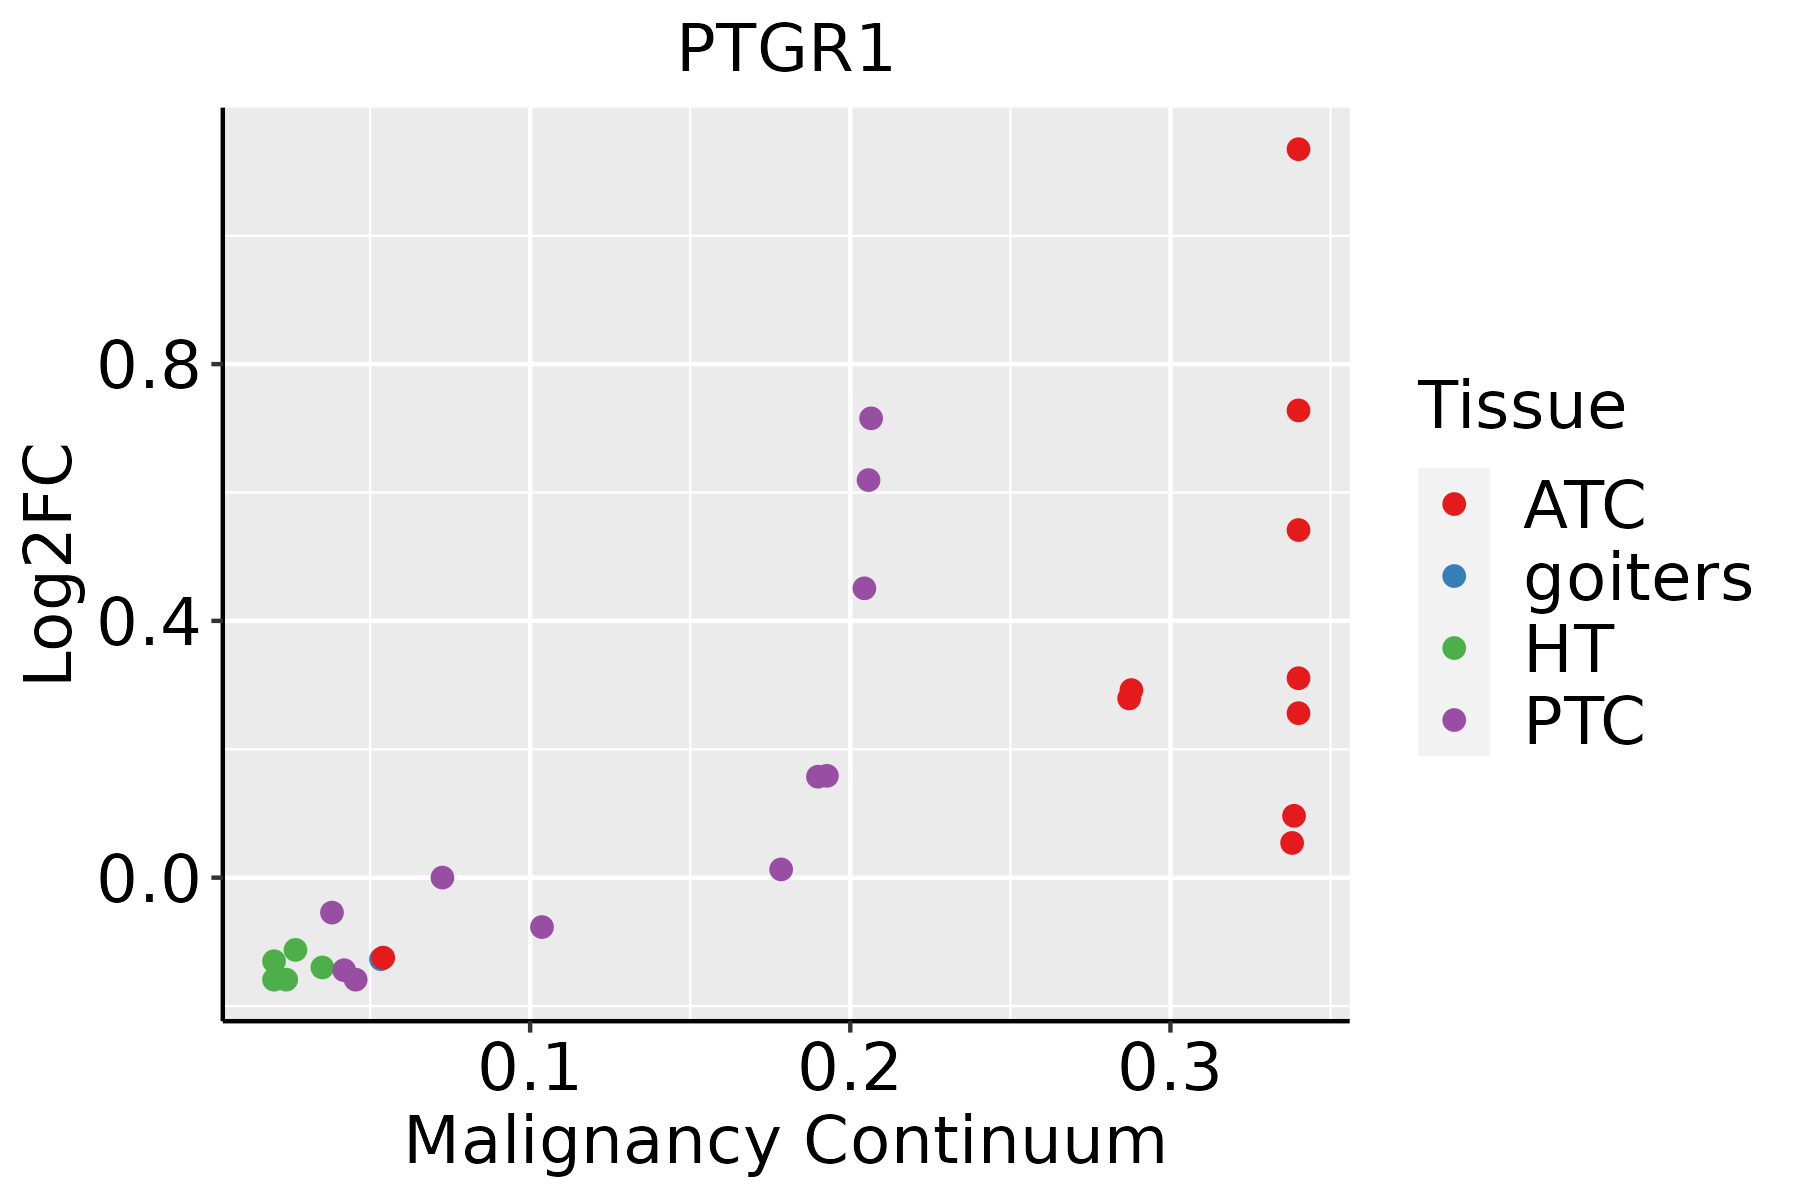 | ATC: Anaplastic thyroid cancer |
| HT: Hashimoto's thyroiditis | ||
| PTC: Papillary thyroid cancer |
| ∗log2FC in expression of this searched gene in stem-like cells from each diseased tissue sample relative to stem-like cells in normal samples in each tissue plotted against the malignancy continuum. Samples are colored based on if they are from different disease stage. |
Top |
Malignant transformation related pathway analysis |
| Find out the enriched GO biological processes and KEGG pathways involved in transition from healthy to precancer to cancer |
| Tissue | Disease Stage | Enriched GO biological Processes |
| Colorectum | AD |  |
| Colorectum | SER |  |
| Colorectum | MSS |  |
| Colorectum | MSI-H |  |
| Colorectum | FAP |  |
| ∗Top 15 enriched GO BP terms are showed in the bar plot of each disease state in each tissue. Each row represents a significant GO biological process which is colored according to the -log10(p.adjust). |
| Page: 1 2 3 4 5 6 7 8 9 |
| GO ID | Tissue | Disease Stage | Description | Gene Ratio | Bg Ratio | pvalue | p.adjust | Count |
| GO:00066318 | Esophagus | ESCC | fatty acid metabolic process | 217/8552 | 390/18723 | 4.21e-05 | 3.39e-04 | 217 |
| GO:000669211 | Esophagus | ESCC | prostanoid metabolic process | 33/8552 | 49/18723 | 1.80e-03 | 8.26e-03 | 33 |
| GO:000669311 | Esophagus | ESCC | prostaglandin metabolic process | 33/8552 | 49/18723 | 1.80e-03 | 8.26e-03 | 33 |
| GO:00066316 | Liver | NAFLD | fatty acid metabolic process | 92/1882 | 390/18723 | 3.38e-15 | 3.29e-12 | 92 |
| GO:00335596 | Liver | NAFLD | unsaturated fatty acid metabolic process | 24/1882 | 116/18723 | 4.64e-04 | 6.74e-03 | 24 |
| GO:00066906 | Liver | NAFLD | icosanoid metabolic process | 22/1882 | 123/18723 | 5.33e-03 | 4.11e-02 | 22 |
| GO:000663112 | Liver | Cirrhotic | fatty acid metabolic process | 165/4634 | 390/18723 | 1.29e-14 | 1.26e-12 | 165 |
| GO:00066926 | Liver | Cirrhotic | prostanoid metabolic process | 22/4634 | 49/18723 | 1.64e-03 | 1.05e-02 | 22 |
| GO:00066936 | Liver | Cirrhotic | prostaglandin metabolic process | 22/4634 | 49/18723 | 1.64e-03 | 1.05e-02 | 22 |
| GO:003355911 | Liver | Cirrhotic | unsaturated fatty acid metabolic process | 43/4634 | 116/18723 | 2.09e-03 | 1.29e-02 | 43 |
| GO:000663122 | Liver | HCC | fatty acid metabolic process | 238/7958 | 390/18723 | 8.24e-14 | 4.84e-12 | 238 |
| GO:1901568 | Liver | HCC | fatty acid derivative metabolic process | 43/7958 | 74/18723 | 4.85e-03 | 2.04e-02 | 43 |
| GO:00066317 | Oral cavity | OSCC | fatty acid metabolic process | 186/7305 | 390/18723 | 2.65e-04 | 1.69e-03 | 186 |
| GO:00066928 | Oral cavity | OSCC | prostanoid metabolic process | 29/7305 | 49/18723 | 3.33e-03 | 1.42e-02 | 29 |
| GO:00066938 | Oral cavity | OSCC | prostaglandin metabolic process | 29/7305 | 49/18723 | 3.33e-03 | 1.42e-02 | 29 |
| GO:00066315 | Stomach | GC | fatty acid metabolic process | 55/1159 | 390/18723 | 8.63e-09 | 8.38e-07 | 55 |
| GO:0033559 | Stomach | GC | unsaturated fatty acid metabolic process | 24/1159 | 116/18723 | 1.43e-07 | 8.35e-06 | 24 |
| GO:0006690 | Stomach | GC | icosanoid metabolic process | 24/1159 | 123/18723 | 4.49e-07 | 2.32e-05 | 24 |
| GO:0006692 | Stomach | GC | prostanoid metabolic process | 13/1159 | 49/18723 | 5.93e-06 | 2.30e-04 | 13 |
| GO:0006693 | Stomach | GC | prostaglandin metabolic process | 13/1159 | 49/18723 | 5.93e-06 | 2.30e-04 | 13 |
| Page: 1 2 3 |
| Pathway ID | Tissue | Disease Stage | Description | Gene Ratio | Bg Ratio | pvalue | p.adjust | qvalue | Count |
| Page: 1 |
Top |
Cell-cell communication analysis |
| Identification of potential cell-cell interactions between two cell types and their ligand-receptor pairs for different disease states |
| Ligand | Receptor | LRpair | Pathway | Tissue | Disease Stage |
| Page: 1 |
Top |
Single-cell gene regulatory network inference analysis |
| Find out the significant the regulons (TFs) and the target genes of each regulon across cell types for different disease states |
| TF | Cell Type | Tissue | Disease Stage | Target Gene | RSS | Regulon Activity |
| ∗The dot plots of a searched regulon are shown for all cell subpopulations in each disease state of each tissue based on the regulon specific score inferred using pySCENIC and by calculating the average expression. |
| Page: 1 |
Top |
Somatic mutation of malignant transformation related genes |
| Annotation of somatic variants for genes involved in malignant transformation |
| Hugo Symbol | Variant Class | Variant Classification | dbSNP RS | HGVSc | HGVSp | HGVSp Short | SWISSPROT | BIOTYPE | SIFT | PolyPhen | Tumor Sample Barcode | Tissue | Histology | Sex | Age | Stage | Therapy Types | Drugs | Outcome |
| PTGR1 | SNV | Missense_Mutation | c.767C>T | p.Pro256Leu | p.P256L | Q14914 | protein_coding | tolerated(0.64) | benign(0.003) | TCGA-A8-A09Z-01 | Breast | breast invasive carcinoma | Female | >=65 | I/II | Unknown | Unknown | SD | |
| PTGR1 | SNV | Missense_Mutation | c.29A>C | p.Lys10Thr | p.K10T | Q14914 | protein_coding | tolerated(0.29) | benign(0.034) | TCGA-FU-A3HZ-01 | Cervix | cervical & endocervical cancer | Female | <65 | I/II | Chemotherapy | cisplatin | CR | |
| PTGR1 | SNV | Missense_Mutation | rs776877398 | c.8N>A | p.Arg3His | p.R3H | Q14914 | protein_coding | tolerated(0.71) | benign(0.001) | TCGA-AA-3510-01 | Colorectum | colon adenocarcinoma | Male | >=65 | I/II | Unknown | Unknown | SD |
| PTGR1 | SNV | Missense_Mutation | c.693G>T | p.Lys231Asn | p.K231N | Q14914 | protein_coding | tolerated(0.58) | benign(0.073) | TCGA-AA-A010-01 | Colorectum | colon adenocarcinoma | Female | <65 | I/II | Chemotherapy | folinic | CR | |
| PTGR1 | SNV | Missense_Mutation | c.127T>C | p.Phe43Leu | p.F43L | Q14914 | protein_coding | deleterious(0) | benign(0.054) | TCGA-AA-A010-01 | Colorectum | colon adenocarcinoma | Female | <65 | I/II | Chemotherapy | folinic | CR | |
| PTGR1 | SNV | Missense_Mutation | c.289T>C | p.Ser97Pro | p.S97P | Q14914 | protein_coding | tolerated(0.13) | benign(0.047) | TCGA-WS-AB45-01 | Colorectum | colon adenocarcinoma | Female | <65 | I/II | Unknown | Unknown | SD | |
| PTGR1 | SNV | Missense_Mutation | novel | c.774N>T | p.Glu258Asp | p.E258D | Q14914 | protein_coding | tolerated(0.33) | benign(0) | TCGA-AG-A002-01 | Colorectum | rectum adenocarcinoma | Male | <65 | I/II | Unknown | Unknown | SD |
| PTGR1 | SNV | Missense_Mutation | novel | c.683N>A | p.Gly228Asp | p.G228D | Q14914 | protein_coding | tolerated(0.6) | benign(0.003) | TCGA-F5-6814-01 | Colorectum | rectum adenocarcinoma | Male | <65 | I/II | Unknown | Unknown | SD |
| PTGR1 | SNV | Missense_Mutation | rs750630020 | c.617N>T | p.Ala206Val | p.A206V | Q14914 | protein_coding | tolerated(0.09) | possibly_damaging(0.777) | TCGA-A5-A0G2-01 | Endometrium | uterine corpus endometrioid carcinoma | Female | <65 | III/IV | Unknown | Unknown | SD |
| PTGR1 | SNV | Missense_Mutation | novel | c.437T>C | p.Met146Thr | p.M146T | Q14914 | protein_coding | deleterious(0) | benign(0.092) | TCGA-AJ-A23O-01 | Endometrium | uterine corpus endometrioid carcinoma | Female | >=65 | I/II | Unknown | Unknown | SD |
| Page: 1 2 3 4 |
Top |
Related drugs of malignant transformation related genes |
| Identification of chemicals and drugs interact with genes involved in malignant transfromation |
| (DGIdb 4.0) |
| Entrez ID | Symbol | Category | Interaction Types | Drug Claim Name | Drug Name | PMIDs |
| Page: 1 |

Copyright 2023-Present -The University of Texas Health Science Center at Houston |