
|
|||||
|
 | |
| |
| |
| |
| |
| |
|
Gene: PSMC4 |
Gene summary for PSMC4 |
| Gene information | Species | Human | Gene symbol | PSMC4 | Gene ID | 5704 |
| Gene name | proteasome 26S subunit, ATPase 4 | |
| Gene Alias | MIP224 | |
| Cytomap | 19q13.2 | |
| Gene Type | protein-coding | GO ID | GO:0001701 | UniProtAcc | A8K2M0 |
Top |
Malignant transformation analysis |
| Identification of the aberrant gene expression in precancerous and cancerous lesions by comparing the gene expression of stem-like cells in diseased tissues with normal stem cells |
| Entrez ID | Symbol | Replicates | Species | Organ | Tissue | Adj P-value | Log2FC | Malignancy |
| 5704 | PSMC4 | P12T-E | Human | Esophagus | ESCC | 1.95e-63 | 1.26e+00 | 0.1122 |
| 5704 | PSMC4 | P15T-E | Human | Esophagus | ESCC | 7.94e-68 | 1.31e+00 | 0.1149 |
| 5704 | PSMC4 | P16T-E | Human | Esophagus | ESCC | 4.35e-33 | 6.18e-01 | 0.1153 |
| 5704 | PSMC4 | P17T-E | Human | Esophagus | ESCC | 3.07e-26 | 1.31e+00 | 0.1278 |
| 5704 | PSMC4 | P19T-E | Human | Esophagus | ESCC | 4.34e-20 | 2.19e+00 | 0.1662 |
| 5704 | PSMC4 | P20T-E | Human | Esophagus | ESCC | 8.83e-54 | 1.23e+00 | 0.1124 |
| 5704 | PSMC4 | P21T-E | Human | Esophagus | ESCC | 3.19e-39 | 7.61e-01 | 0.1617 |
| 5704 | PSMC4 | P22T-E | Human | Esophagus | ESCC | 5.82e-69 | 1.33e+00 | 0.1236 |
| 5704 | PSMC4 | P23T-E | Human | Esophagus | ESCC | 5.28e-58 | 1.75e+00 | 0.108 |
| 5704 | PSMC4 | P24T-E | Human | Esophagus | ESCC | 4.78e-53 | 1.11e+00 | 0.1287 |
| 5704 | PSMC4 | P26T-E | Human | Esophagus | ESCC | 1.52e-63 | 1.30e+00 | 0.1276 |
| 5704 | PSMC4 | P27T-E | Human | Esophagus | ESCC | 8.86e-56 | 1.06e+00 | 0.1055 |
| 5704 | PSMC4 | P28T-E | Human | Esophagus | ESCC | 3.48e-48 | 9.12e-01 | 0.1149 |
| 5704 | PSMC4 | P30T-E | Human | Esophagus | ESCC | 4.23e-40 | 1.68e+00 | 0.137 |
| 5704 | PSMC4 | P31T-E | Human | Esophagus | ESCC | 1.58e-70 | 1.30e+00 | 0.1251 |
| 5704 | PSMC4 | P32T-E | Human | Esophagus | ESCC | 5.96e-93 | 1.92e+00 | 0.1666 |
| 5704 | PSMC4 | P36T-E | Human | Esophagus | ESCC | 6.30e-29 | 8.78e-01 | 0.1187 |
| 5704 | PSMC4 | P37T-E | Human | Esophagus | ESCC | 6.66e-47 | 1.10e+00 | 0.1371 |
| 5704 | PSMC4 | P38T-E | Human | Esophagus | ESCC | 1.24e-24 | 1.54e+00 | 0.127 |
| 5704 | PSMC4 | P39T-E | Human | Esophagus | ESCC | 5.40e-21 | 3.94e-01 | 0.0894 |
| Page: 1 2 3 4 5 6 7 8 9 |
| Tissue | Expression Dynamics | Abbreviation |
| Cervix |  | CC: Cervix cancer |
| HSIL_HPV: HPV-infected high-grade squamous intraepithelial lesions | ||
| N_HPV: HPV-infected normal cervix | ||
| Colorectum (GSE201348) |  | FAP: Familial adenomatous polyposis |
| CRC: Colorectal cancer | ||
| Colorectum (HTA11) |  | AD: Adenomas |
| SER: Sessile serrated lesions | ||
| MSI-H: Microsatellite-high colorectal cancer | ||
| MSS: Microsatellite stable colorectal cancer | ||
| Esophagus |  | ESCC: Esophageal squamous cell carcinoma |
| HGIN: High-grade intraepithelial neoplasias | ||
| LGIN: Low-grade intraepithelial neoplasias | ||
| Liver | 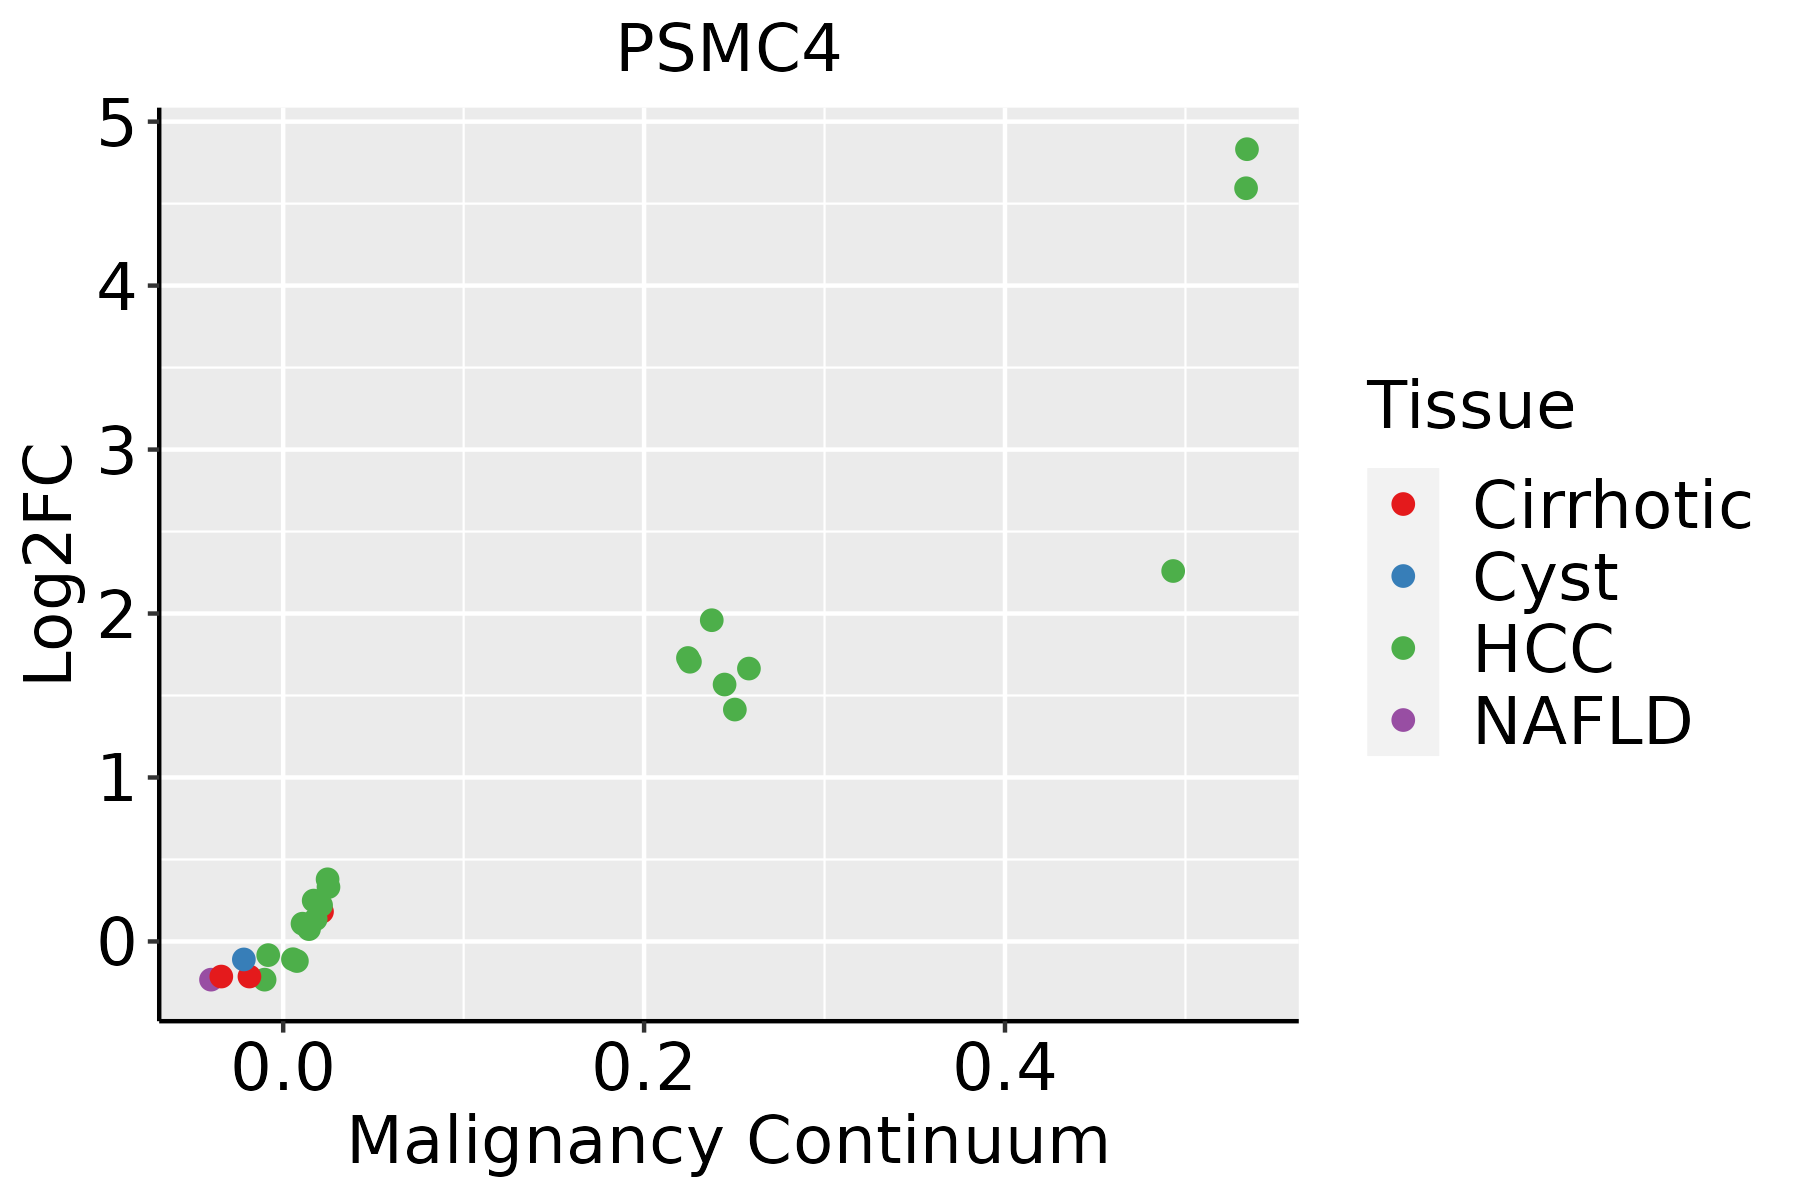 | HCC: Hepatocellular carcinoma |
| NAFLD: Non-alcoholic fatty liver disease | ||
| Oral Cavity | 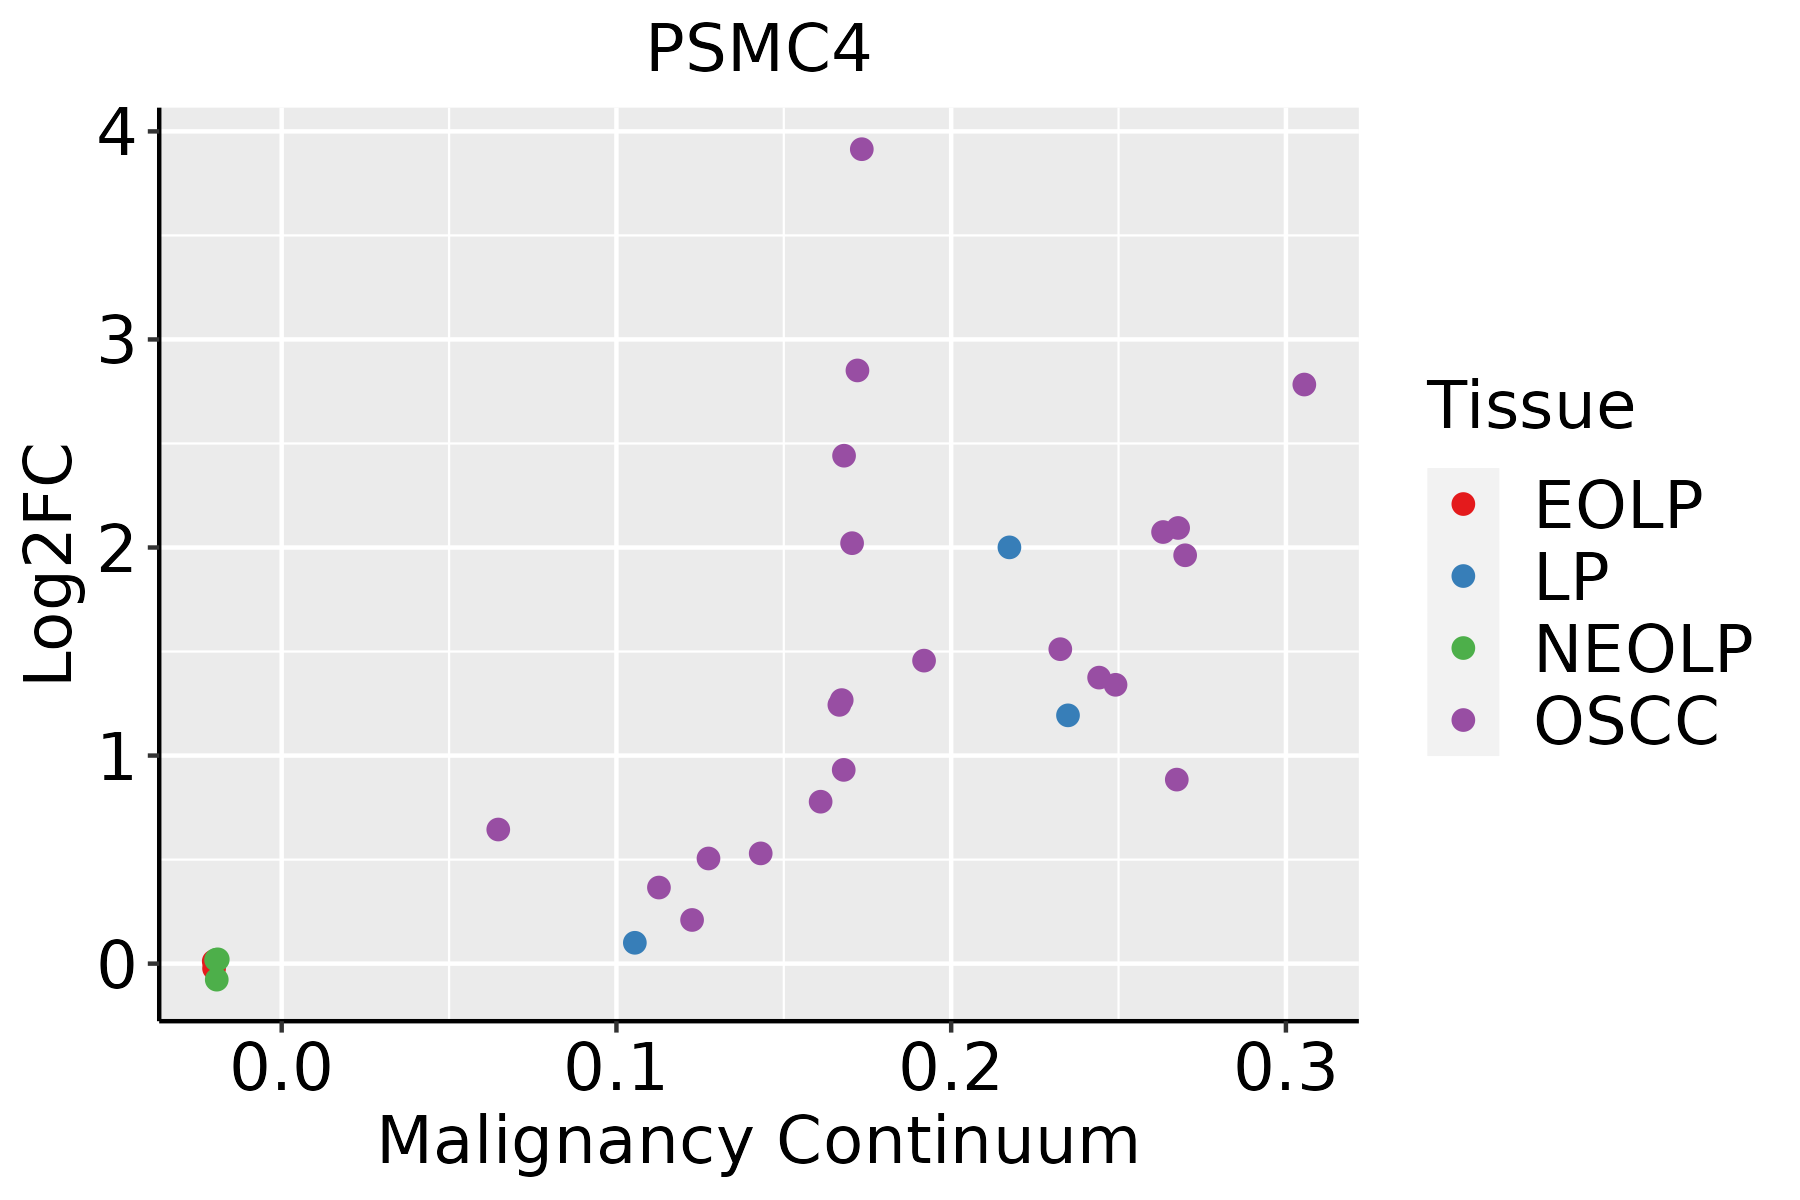 | EOLP: Erosive Oral lichen planus |
| LP: leukoplakia | ||
| NEOLP: Non-erosive oral lichen planus | ||
| OSCC: Oral squamous cell carcinoma | ||
| Prostate | 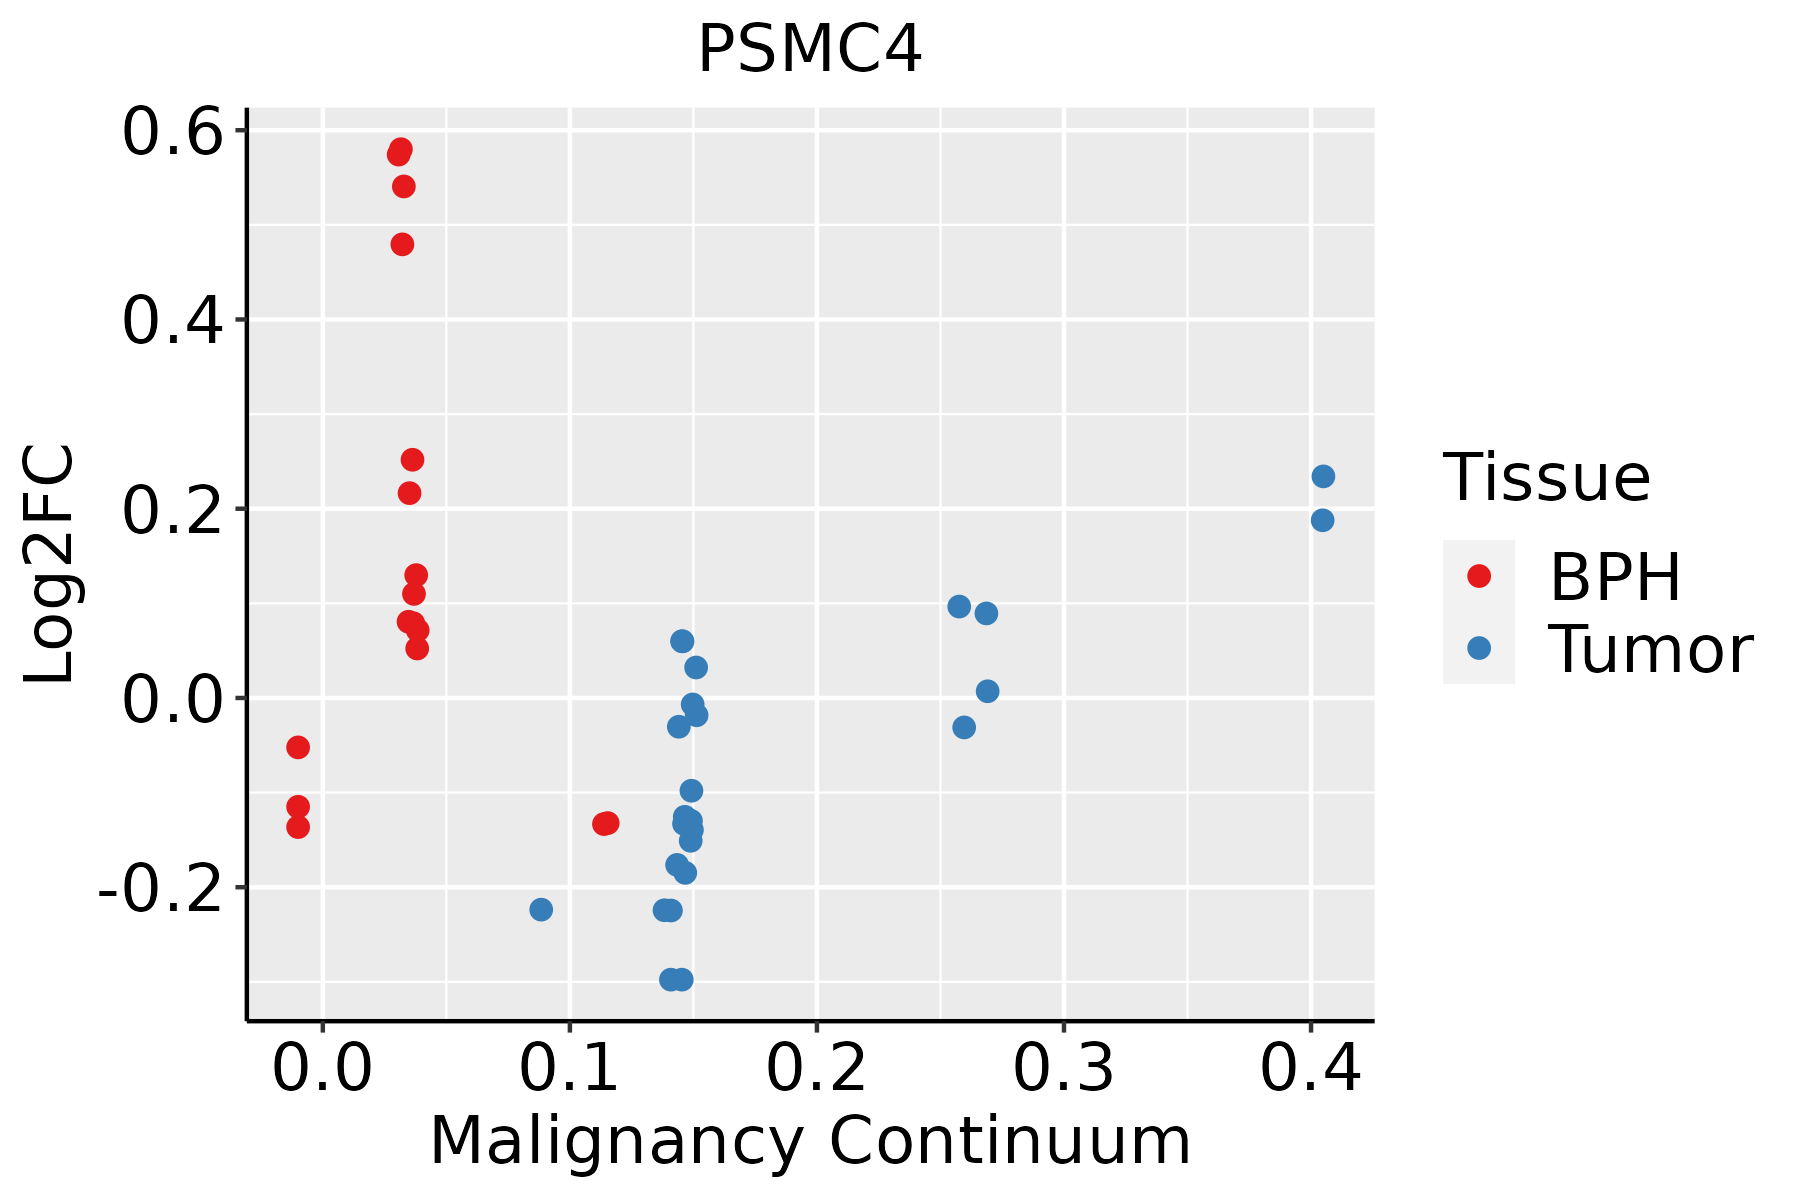 | BPH: Benign Prostatic Hyperplasia |
| Skin | 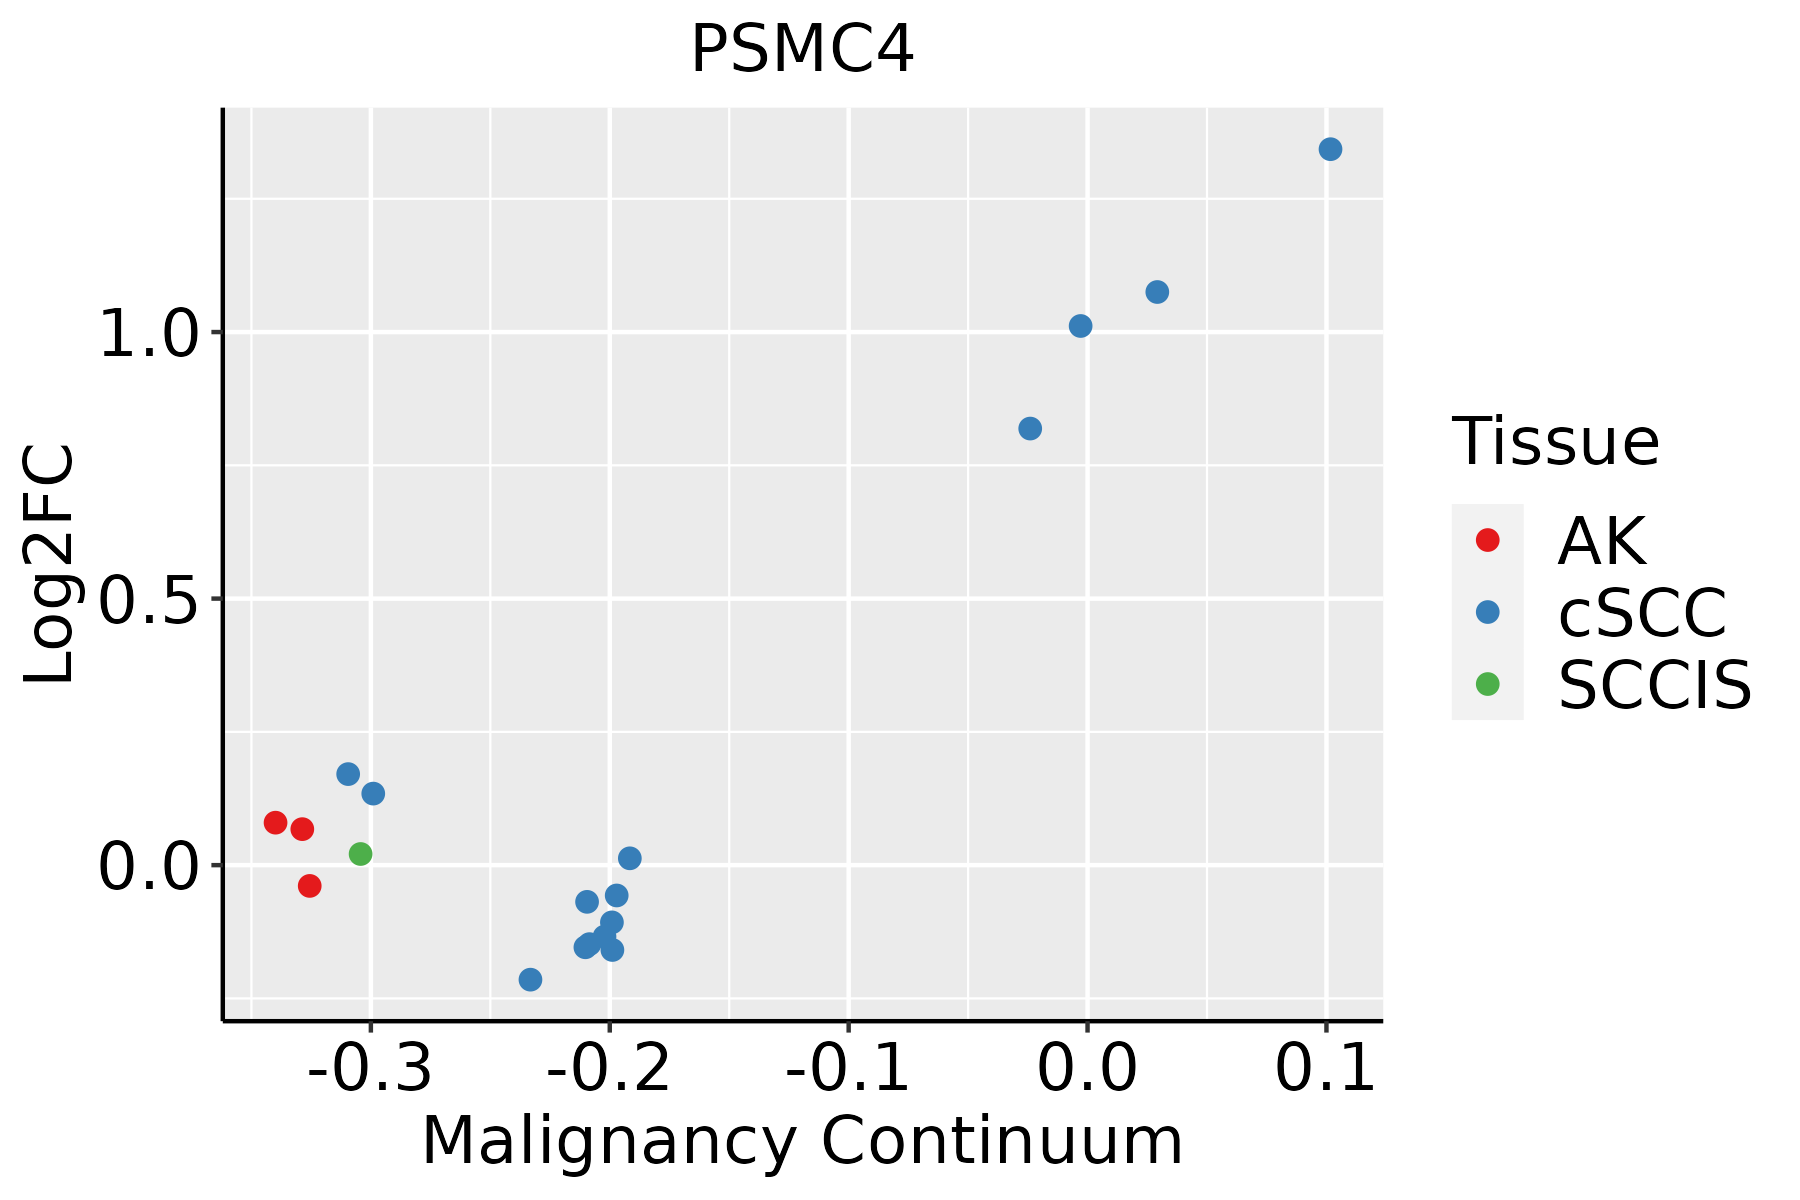 | AK: Actinic keratosis |
| cSCC: Cutaneous squamous cell carcinoma | ||
| SCCIS:squamous cell carcinoma in situ | ||
| Thyroid |  | ATC: Anaplastic thyroid cancer |
| HT: Hashimoto's thyroiditis | ||
| PTC: Papillary thyroid cancer |
| ∗log2FC in expression of this searched gene in stem-like cells from each diseased tissue sample relative to stem-like cells in normal samples in each tissue plotted against the malignancy continuum. Samples are colored based on if they are from different disease stage. |
Top |
Malignant transformation related pathway analysis |
| Find out the enriched GO biological processes and KEGG pathways involved in transition from healthy to precancer to cancer |
| Tissue | Disease Stage | Enriched GO biological Processes |
| Colorectum | AD |  |
| Colorectum | SER |  |
| Colorectum | MSS |  |
| Colorectum | MSI-H |  |
| Colorectum | FAP |  |
| ∗Top 15 enriched GO BP terms are showed in the bar plot of each disease state in each tissue. Each row represents a significant GO biological process which is colored according to the -log10(p.adjust). |
| Page: 1 2 3 4 5 6 7 8 9 |
| GO ID | Tissue | Disease Stage | Description | Gene Ratio | Bg Ratio | pvalue | p.adjust | Count |
| GO:004217610 | Cervix | CC | regulation of protein catabolic process | 104/2311 | 391/18723 | 9.39e-15 | 9.36e-12 | 104 |
| GO:004586210 | Cervix | CC | positive regulation of proteolysis | 95/2311 | 372/18723 | 1.84e-12 | 6.86e-10 | 95 |
| GO:190336210 | Cervix | CC | regulation of cellular protein catabolic process | 72/2311 | 255/18723 | 5.98e-12 | 2.10e-09 | 72 |
| GO:004573210 | Cervix | CC | positive regulation of protein catabolic process | 65/2311 | 231/18723 | 7.44e-11 | 1.39e-08 | 65 |
| GO:001049810 | Cervix | CC | proteasomal protein catabolic process | 111/2311 | 490/18723 | 8.98e-11 | 1.58e-08 | 111 |
| GO:000989610 | Cervix | CC | positive regulation of catabolic process | 109/2311 | 492/18723 | 5.26e-10 | 6.99e-08 | 109 |
| GO:190305010 | Cervix | CC | regulation of proteolysis involved in cellular protein catabolic process | 60/2311 | 221/18723 | 1.82e-09 | 1.98e-07 | 60 |
| GO:004316110 | Cervix | CC | proteasome-mediated ubiquitin-dependent protein catabolic process | 91/2311 | 412/18723 | 1.65e-08 | 1.25e-06 | 91 |
| GO:003133110 | Cervix | CC | positive regulation of cellular catabolic process | 91/2311 | 427/18723 | 9.64e-08 | 5.25e-06 | 91 |
| GO:190336410 | Cervix | CC | positive regulation of cellular protein catabolic process | 43/2311 | 155/18723 | 1.80e-07 | 8.28e-06 | 43 |
| GO:006113610 | Cervix | CC | regulation of proteasomal protein catabolic process | 48/2311 | 187/18723 | 4.63e-07 | 1.77e-05 | 48 |
| GO:19030528 | Cervix | CC | positive regulation of proteolysis involved in cellular protein catabolic process | 34/2311 | 133/18723 | 2.28e-05 | 4.01e-04 | 34 |
| GO:00017018 | Cervix | CC | in utero embryonic development | 71/2311 | 367/18723 | 7.21e-05 | 1.00e-03 | 71 |
| GO:19018008 | Cervix | CC | positive regulation of proteasomal protein catabolic process | 29/2311 | 114/18723 | 9.71e-05 | 1.27e-03 | 29 |
| GO:0042176 | Colorectum | AD | regulation of protein catabolic process | 160/3918 | 391/18723 | 1.06e-19 | 7.34e-17 | 160 |
| GO:0009896 | Colorectum | AD | positive regulation of catabolic process | 180/3918 | 492/18723 | 4.33e-16 | 1.94e-13 | 180 |
| GO:1903362 | Colorectum | AD | regulation of cellular protein catabolic process | 109/3918 | 255/18723 | 2.14e-15 | 6.08e-13 | 109 |
| GO:0010498 | Colorectum | AD | proteasomal protein catabolic process | 174/3918 | 490/18723 | 3.18e-14 | 7.66e-12 | 174 |
| GO:0031331 | Colorectum | AD | positive regulation of cellular catabolic process | 156/3918 | 427/18723 | 4.68e-14 | 1.05e-11 | 156 |
| GO:1903050 | Colorectum | AD | regulation of proteolysis involved in cellular protein catabolic process | 92/3918 | 221/18723 | 2.04e-12 | 3.19e-10 | 92 |
| Page: 1 2 3 4 5 6 7 8 9 10 11 12 |
| Pathway ID | Tissue | Disease Stage | Description | Gene Ratio | Bg Ratio | pvalue | p.adjust | qvalue | Count |
| hsa0501220 | Cervix | CC | Parkinson disease | 102/1267 | 266/8465 | 1.81e-21 | 1.47e-19 | 8.66e-20 | 102 |
| hsa0502018 | Cervix | CC | Prion disease | 98/1267 | 273/8465 | 2.64e-18 | 1.42e-16 | 8.42e-17 | 98 |
| hsa0501018 | Cervix | CC | Alzheimer disease | 113/1267 | 384/8465 | 9.67e-14 | 3.92e-12 | 2.32e-12 | 113 |
| hsa0501618 | Cervix | CC | Huntington disease | 94/1267 | 306/8465 | 8.49e-13 | 3.06e-11 | 1.81e-11 | 94 |
| hsa0502218 | Cervix | CC | Pathways of neurodegeneration - multiple diseases | 128/1267 | 476/8465 | 2.87e-12 | 9.29e-11 | 5.50e-11 | 128 |
| hsa0501418 | Cervix | CC | Amyotrophic lateral sclerosis | 103/1267 | 364/8465 | 1.79e-11 | 4.47e-10 | 2.64e-10 | 103 |
| hsa0516920 | Cervix | CC | Epstein-Barr virus infection | 57/1267 | 202/8465 | 7.30e-07 | 7.39e-06 | 4.37e-06 | 57 |
| hsa0305014 | Cervix | CC | Proteasome | 16/1267 | 46/8465 | 6.69e-04 | 3.09e-03 | 1.83e-03 | 16 |
| hsa0501716 | Cervix | CC | Spinocerebellar ataxia | 35/1267 | 143/8465 | 1.77e-03 | 7.21e-03 | 4.26e-03 | 35 |
| hsa05012110 | Cervix | CC | Parkinson disease | 102/1267 | 266/8465 | 1.81e-21 | 1.47e-19 | 8.66e-20 | 102 |
| hsa0502019 | Cervix | CC | Prion disease | 98/1267 | 273/8465 | 2.64e-18 | 1.42e-16 | 8.42e-17 | 98 |
| hsa0501019 | Cervix | CC | Alzheimer disease | 113/1267 | 384/8465 | 9.67e-14 | 3.92e-12 | 2.32e-12 | 113 |
| hsa0501619 | Cervix | CC | Huntington disease | 94/1267 | 306/8465 | 8.49e-13 | 3.06e-11 | 1.81e-11 | 94 |
| hsa0502219 | Cervix | CC | Pathways of neurodegeneration - multiple diseases | 128/1267 | 476/8465 | 2.87e-12 | 9.29e-11 | 5.50e-11 | 128 |
| hsa0501419 | Cervix | CC | Amyotrophic lateral sclerosis | 103/1267 | 364/8465 | 1.79e-11 | 4.47e-10 | 2.64e-10 | 103 |
| hsa05169110 | Cervix | CC | Epstein-Barr virus infection | 57/1267 | 202/8465 | 7.30e-07 | 7.39e-06 | 4.37e-06 | 57 |
| hsa0305015 | Cervix | CC | Proteasome | 16/1267 | 46/8465 | 6.69e-04 | 3.09e-03 | 1.83e-03 | 16 |
| hsa0501717 | Cervix | CC | Spinocerebellar ataxia | 35/1267 | 143/8465 | 1.77e-03 | 7.21e-03 | 4.26e-03 | 35 |
| hsa05012 | Colorectum | AD | Parkinson disease | 147/2092 | 266/8465 | 2.53e-27 | 8.48e-25 | 5.41e-25 | 147 |
| hsa05010 | Colorectum | AD | Alzheimer disease | 174/2092 | 384/8465 | 1.82e-19 | 9.26e-18 | 5.91e-18 | 174 |
| Page: 1 2 3 4 5 6 7 8 9 10 11 12 |
Top |
Cell-cell communication analysis |
| Identification of potential cell-cell interactions between two cell types and their ligand-receptor pairs for different disease states |
| Ligand | Receptor | LRpair | Pathway | Tissue | Disease Stage |
| Page: 1 |
Top |
Single-cell gene regulatory network inference analysis |
| Find out the significant the regulons (TFs) and the target genes of each regulon across cell types for different disease states |
| TF | Cell Type | Tissue | Disease Stage | Target Gene | RSS | Regulon Activity |
| ∗The dot plots of a searched regulon are shown for all cell subpopulations in each disease state of each tissue based on the regulon specific score inferred using pySCENIC and by calculating the average expression. |
| Page: 1 |
Top |
Somatic mutation of malignant transformation related genes |
| Annotation of somatic variants for genes involved in malignant transformation |
| Hugo Symbol | Variant Class | Variant Classification | dbSNP RS | HGVSc | HGVSp | HGVSp Short | SWISSPROT | BIOTYPE | SIFT | PolyPhen | Tumor Sample Barcode | Tissue | Histology | Sex | Age | Stage | Therapy Types | Drugs | Outcome |
| PSMC4 | SNV | Missense_Mutation | c.481N>C | p.Asp161His | p.D161H | P43686 | protein_coding | deleterious(0.01) | possibly_damaging(0.77) | TCGA-AC-A23H-01 | Breast | breast invasive carcinoma | Female | >=65 | I/II | Unknown | Unknown | PD | |
| PSMC4 | SNV | Missense_Mutation | c.565N>A | p.Glu189Lys | p.E189K | P43686 | protein_coding | deleterious(0.02) | benign(0.098) | TCGA-AN-A046-01 | Breast | breast invasive carcinoma | Female | >=65 | I/II | Unknown | Unknown | SD | |
| PSMC4 | SNV | Missense_Mutation | c.383N>T | p.Ala128Val | p.A128V | P43686 | protein_coding | tolerated(0.18) | benign(0.283) | TCGA-B6-A0I8-01 | Breast | breast invasive carcinoma | Female | <65 | I/II | Unknown | Unknown | PD | |
| PSMC4 | SNV | Missense_Mutation | c.1154T>C | p.Leu385Ser | p.L385S | P43686 | protein_coding | tolerated(0.27) | benign(0.071) | TCGA-D8-A142-01 | Breast | breast invasive carcinoma | Female | >=65 | I/II | Chemotherapy | cyclophosphamid | SD | |
| PSMC4 | SNV | Missense_Mutation | c.646N>A | p.Ala216Thr | p.A216T | P43686 | protein_coding | deleterious(0) | probably_damaging(0.996) | TCGA-E2-A150-01 | Breast | breast invasive carcinoma | Female | <65 | I/II | Chemotherapy | doxorubicin | SD | |
| PSMC4 | SNV | Missense_Mutation | novel | c.970C>T | p.Pro324Ser | p.P324S | P43686 | protein_coding | deleterious(0) | probably_damaging(1) | TCGA-LL-A5YP-01 | Breast | breast invasive carcinoma | Female | <65 | I/II | Chemotherapy | cytoxan | SD |
| PSMC4 | SNV | Missense_Mutation | c.565N>A | p.Glu189Lys | p.E189K | P43686 | protein_coding | deleterious(0.02) | benign(0.098) | TCGA-AA-3846-01 | Colorectum | colon adenocarcinoma | Female | >=65 | I/II | Unknown | Unknown | SD | |
| PSMC4 | SNV | Missense_Mutation | c.617N>T | p.Gly206Val | p.G206V | P43686 | protein_coding | deleterious(0) | probably_damaging(1) | TCGA-F4-6856-01 | Colorectum | colon adenocarcinoma | Male | <65 | I/II | Ancillary | leucovorin | CR | |
| PSMC4 | insertion | Frame_Shift_Ins | rs765768285 | c.598dupC | p.Arg200ProfsTer43 | p.R200Pfs*43 | P43686 | protein_coding | TCGA-G4-6588-01 | Colorectum | colon adenocarcinoma | Female | <65 | I/II | Unknown | Unknown | SD | ||
| PSMC4 | SNV | Missense_Mutation | c.1016G>A | p.Arg339His | p.R339H | P43686 | protein_coding | deleterious(0) | probably_damaging(0.991) | TCGA-A5-A0G2-01 | Endometrium | uterine corpus endometrioid carcinoma | Female | <65 | III/IV | Unknown | Unknown | SD |
| Page: 1 2 3 4 5 6 7 |
Top |
Related drugs of malignant transformation related genes |
| Identification of chemicals and drugs interact with genes involved in malignant transfromation |
| (DGIdb 4.0) |
| Entrez ID | Symbol | Category | Interaction Types | Drug Claim Name | Drug Name | PMIDs |
| 5704 | PSMC4 | NA | CARFILZOMIB | CARFILZOMIB | 24524217 | |
| 5704 | PSMC4 | NA | inhibitor | CARFILZOMIB | CARFILZOMIB | |
| 5704 | PSMC4 | NA | inhibitor | CHEMBL2103884 | OPROZOMIB | |
| 5704 | PSMC4 | NA | inhibitor | BORTEZOMIB | BORTEZOMIB | |
| 5704 | PSMC4 | NA | inhibitor | CHEMBL3545432 | IXAZOMIB CITRATE | |
| 5704 | PSMC4 | NA | BORTEZOMIB | BORTEZOMIB | 24524217 | |
| 5704 | PSMC4 | NA | inhibitor | CHEMBL451887 | CARFILZOMIB | |
| 5704 | PSMC4 | NA | inhibitor | CHEMBL325041 | BORTEZOMIB |
| Page: 1 |

Copyright 2023-Present -The University of Texas Health Science Center at Houston |