
|
|||||
|
 | |
| |
| |
| |
| |
| |
|
Gene: PRRX1 |
Gene summary for PRRX1 |
| Gene information | Species | Human | Gene symbol | PRRX1 | Gene ID | 5396 |
| Gene name | paired related homeobox 1 | |
| Gene Alias | AGOTC | |
| Cytomap | 1q24.2 | |
| Gene Type | protein-coding | GO ID | GO:0000122 | UniProtAcc | P54821 |
Top |
Malignant transformation analysis |
| Identification of the aberrant gene expression in precancerous and cancerous lesions by comparing the gene expression of stem-like cells in diseased tissues with normal stem cells |
| Entrez ID | Symbol | Replicates | Species | Organ | Tissue | Adj P-value | Log2FC | Malignancy |
| 5396 | PRRX1 | LN46 | Human | Oral cavity | OSCC | 6.48e-06 | 4.46e-01 | 0.1666 |
| 5396 | PRRX1 | EOLP-1 | Human | Oral cavity | EOLP | 1.20e-03 | 3.50e-01 | -0.0202 |
| 5396 | PRRX1 | NEOLP-1 | Human | Oral cavity | NEOLP | 6.67e-14 | 5.78e-01 | -0.0194 |
| 5396 | PRRX1 | NEOLP-2 | Human | Oral cavity | NEOLP | 6.68e-16 | 6.04e-01 | -0.0196 |
| 5396 | PRRX1 | NEOLP-3 | Human | Oral cavity | NEOLP | 4.53e-14 | 5.35e-01 | -0.0191 |
| 5396 | PRRX1 | SYSMH1 | Human | Oral cavity | OSCC | 2.80e-09 | -4.07e-01 | 0.1127 |
| 5396 | PRRX1 | SYSMH2 | Human | Oral cavity | OSCC | 8.29e-03 | -3.32e-01 | 0.2326 |
| 5396 | PRRX1 | SYSMH3 | Human | Oral cavity | OSCC | 2.15e-06 | -4.13e-01 | 0.2442 |
| 5396 | PRRX1 | SYSMH4 | Human | Oral cavity | OSCC | 3.99e-05 | -2.89e-01 | 0.1226 |
| 5396 | PRRX1 | SYSMH6 | Human | Oral cavity | OSCC | 2.68e-09 | -3.80e-01 | 0.1275 |
| 5396 | PRRX1 | P1_S1_AK | Human | Skin | AK | 2.68e-23 | -5.59e-01 | -0.3399 |
| 5396 | PRRX1 | P2_S3_AK | Human | Skin | AK | 3.95e-25 | -5.64e-01 | -0.3287 |
| 5396 | PRRX1 | P2_S4_SCCIS | Human | Skin | SCCIS | 1.63e-16 | -5.49e-01 | -0.3043 |
| 5396 | PRRX1 | P3_S6_AK | Human | Skin | AK | 1.17e-26 | -5.64e-01 | -0.3256 |
| 5396 | PRRX1 | P4_S8_cSCC | Human | Skin | cSCC | 1.81e-13 | -5.64e-01 | -0.3095 |
| 5396 | PRRX1 | P5_S10_cSCC | Human | Skin | cSCC | 6.95e-21 | -5.51e-01 | -0.299 |
| 5396 | PRRX1 | P1_cSCC | Human | Skin | cSCC | 4.33e-11 | -5.55e-01 | 0.0292 |
| 5396 | PRRX1 | P2_cSCC | Human | Skin | cSCC | 3.16e-24 | -5.64e-01 | -0.024 |
| 5396 | PRRX1 | P4_cSCC | Human | Skin | cSCC | 2.79e-20 | -5.62e-01 | -0.00290000000000005 |
| 5396 | PRRX1 | P10_cSCC | Human | Skin | cSCC | 1.70e-15 | -5.46e-01 | 0.1017 |
| Page: 1 2 3 4 |
| Tissue | Expression Dynamics | Abbreviation |
| Endometrium | 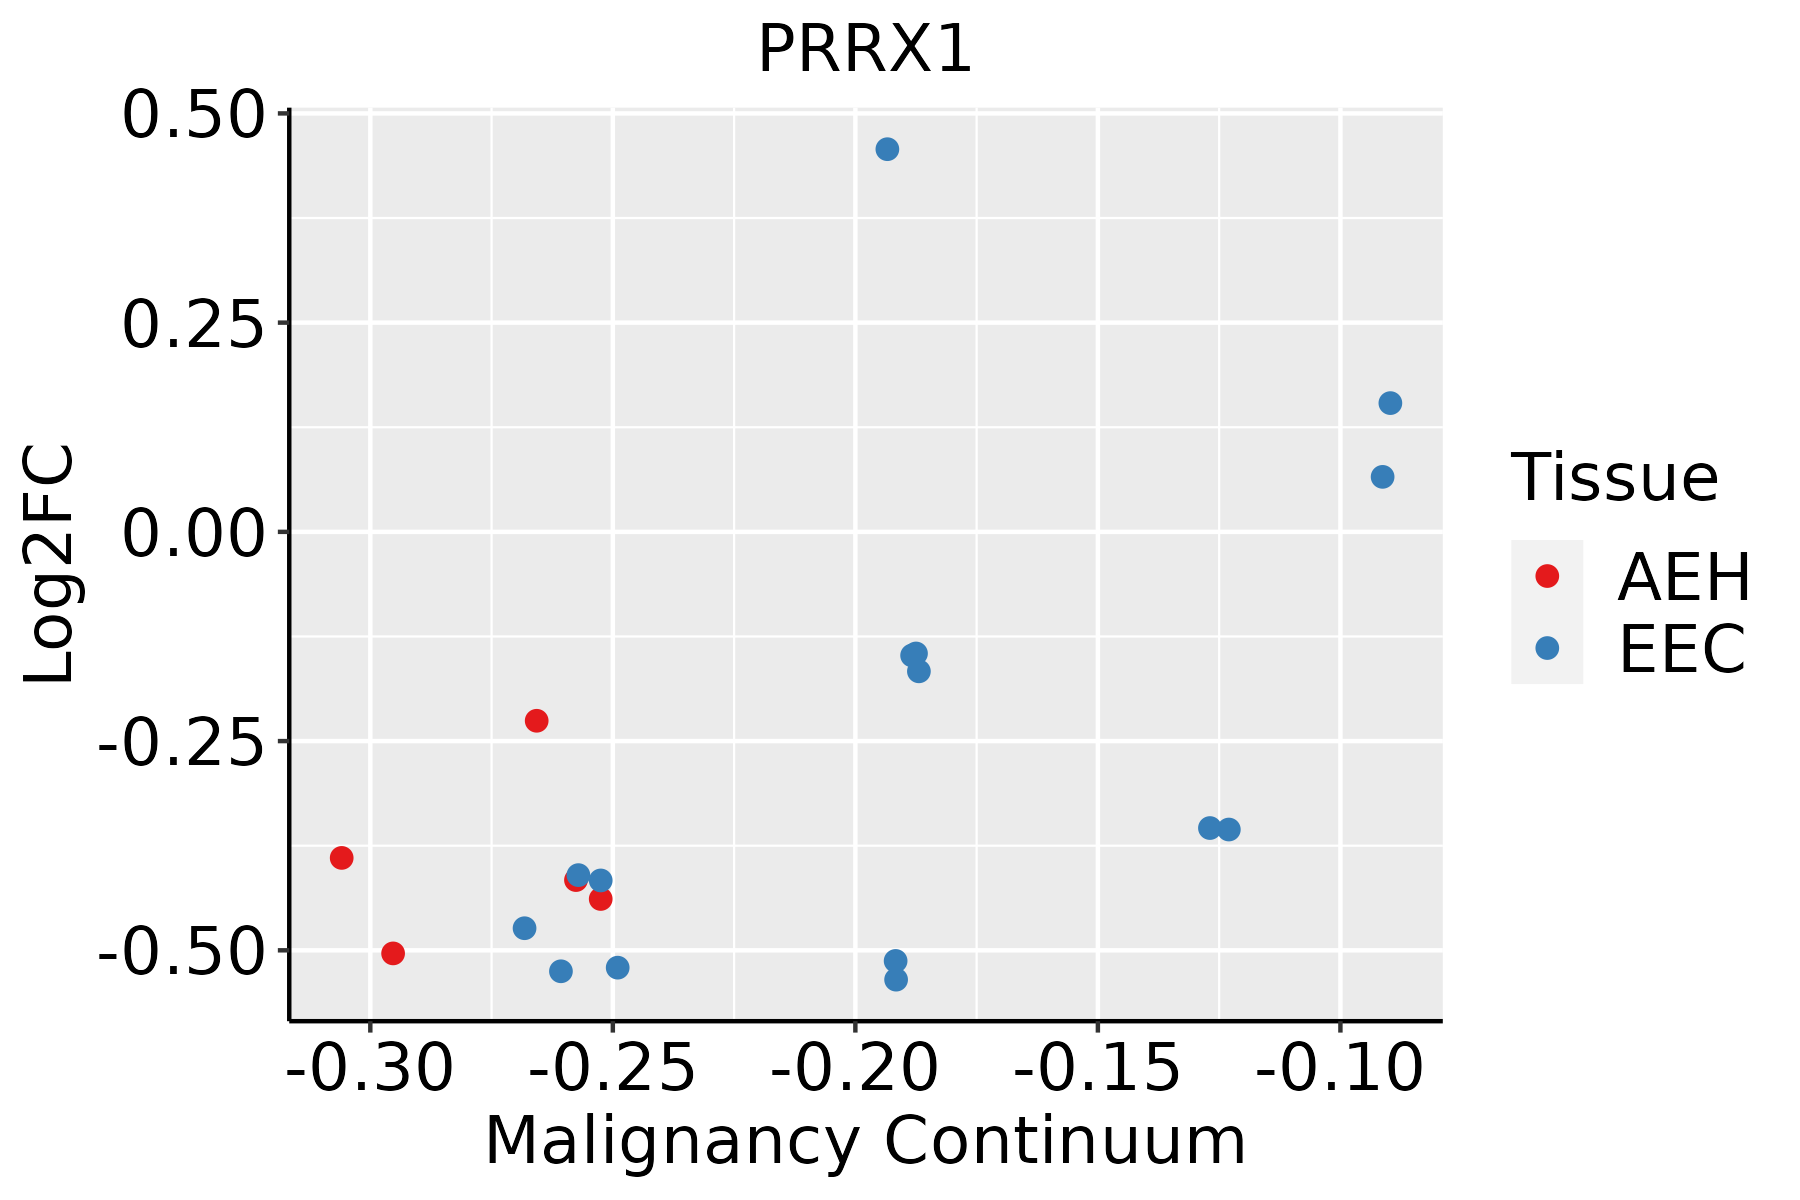 | AEH: Atypical endometrial hyperplasia |
| EEC: Endometrioid Cancer | ||
| Esophagus | 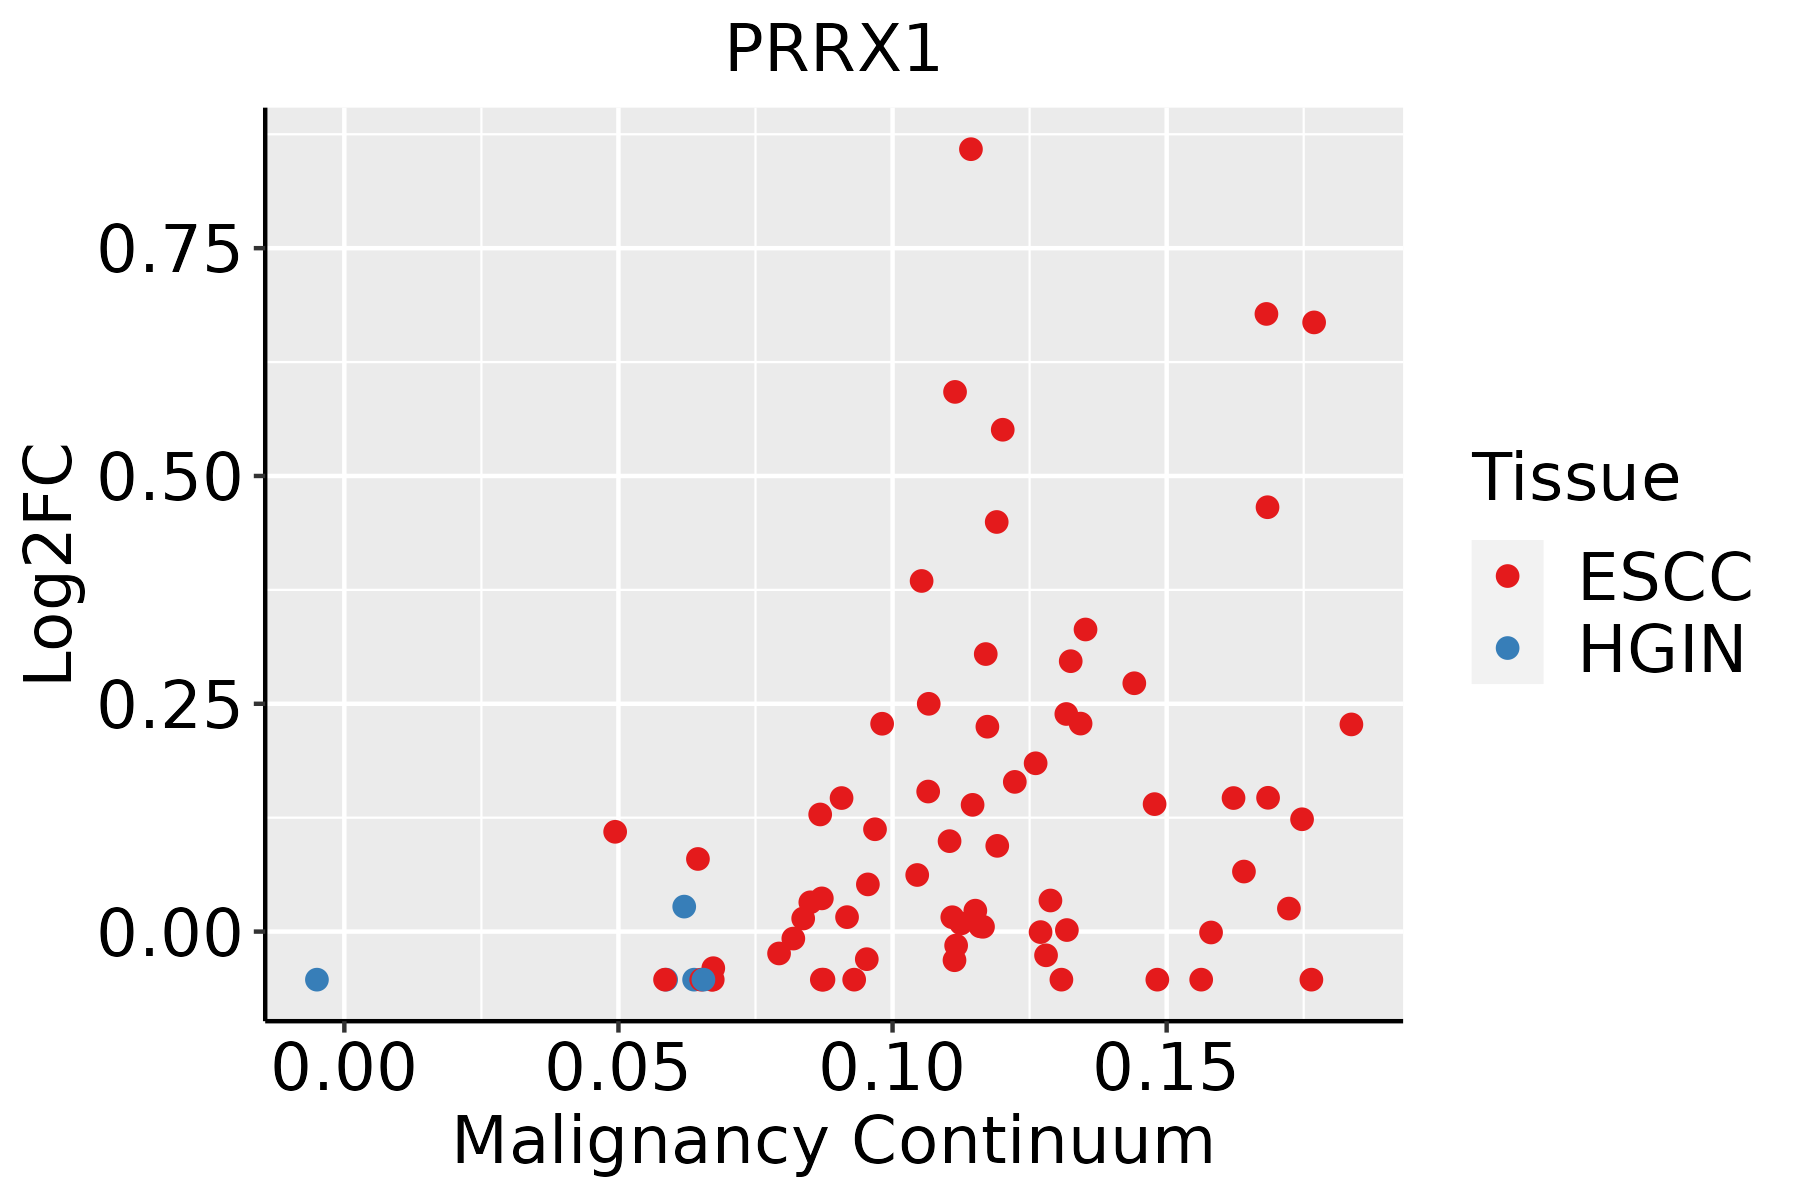 | ESCC: Esophageal squamous cell carcinoma |
| HGIN: High-grade intraepithelial neoplasias | ||
| LGIN: Low-grade intraepithelial neoplasias | ||
| Oral Cavity | 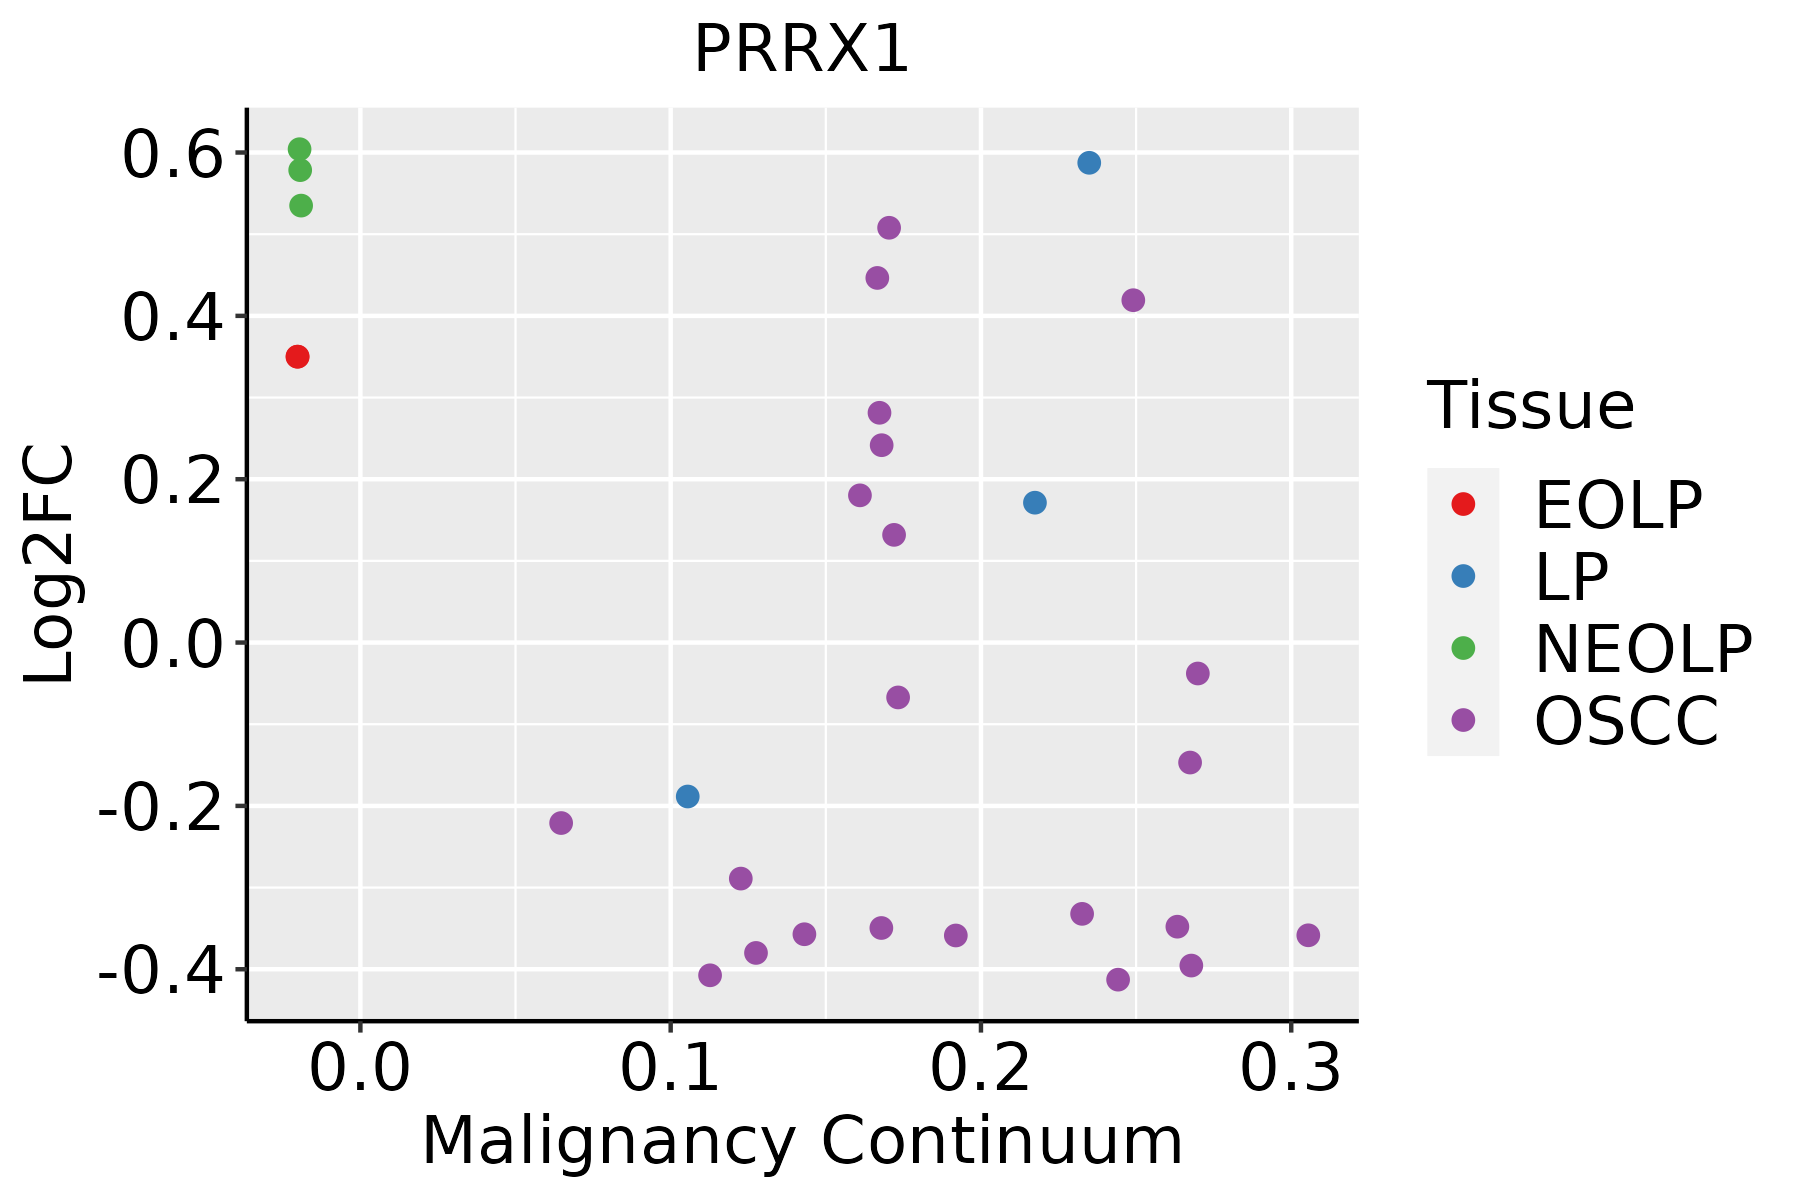 | EOLP: Erosive Oral lichen planus |
| LP: leukoplakia | ||
| NEOLP: Non-erosive oral lichen planus | ||
| OSCC: Oral squamous cell carcinoma | ||
| Skin | 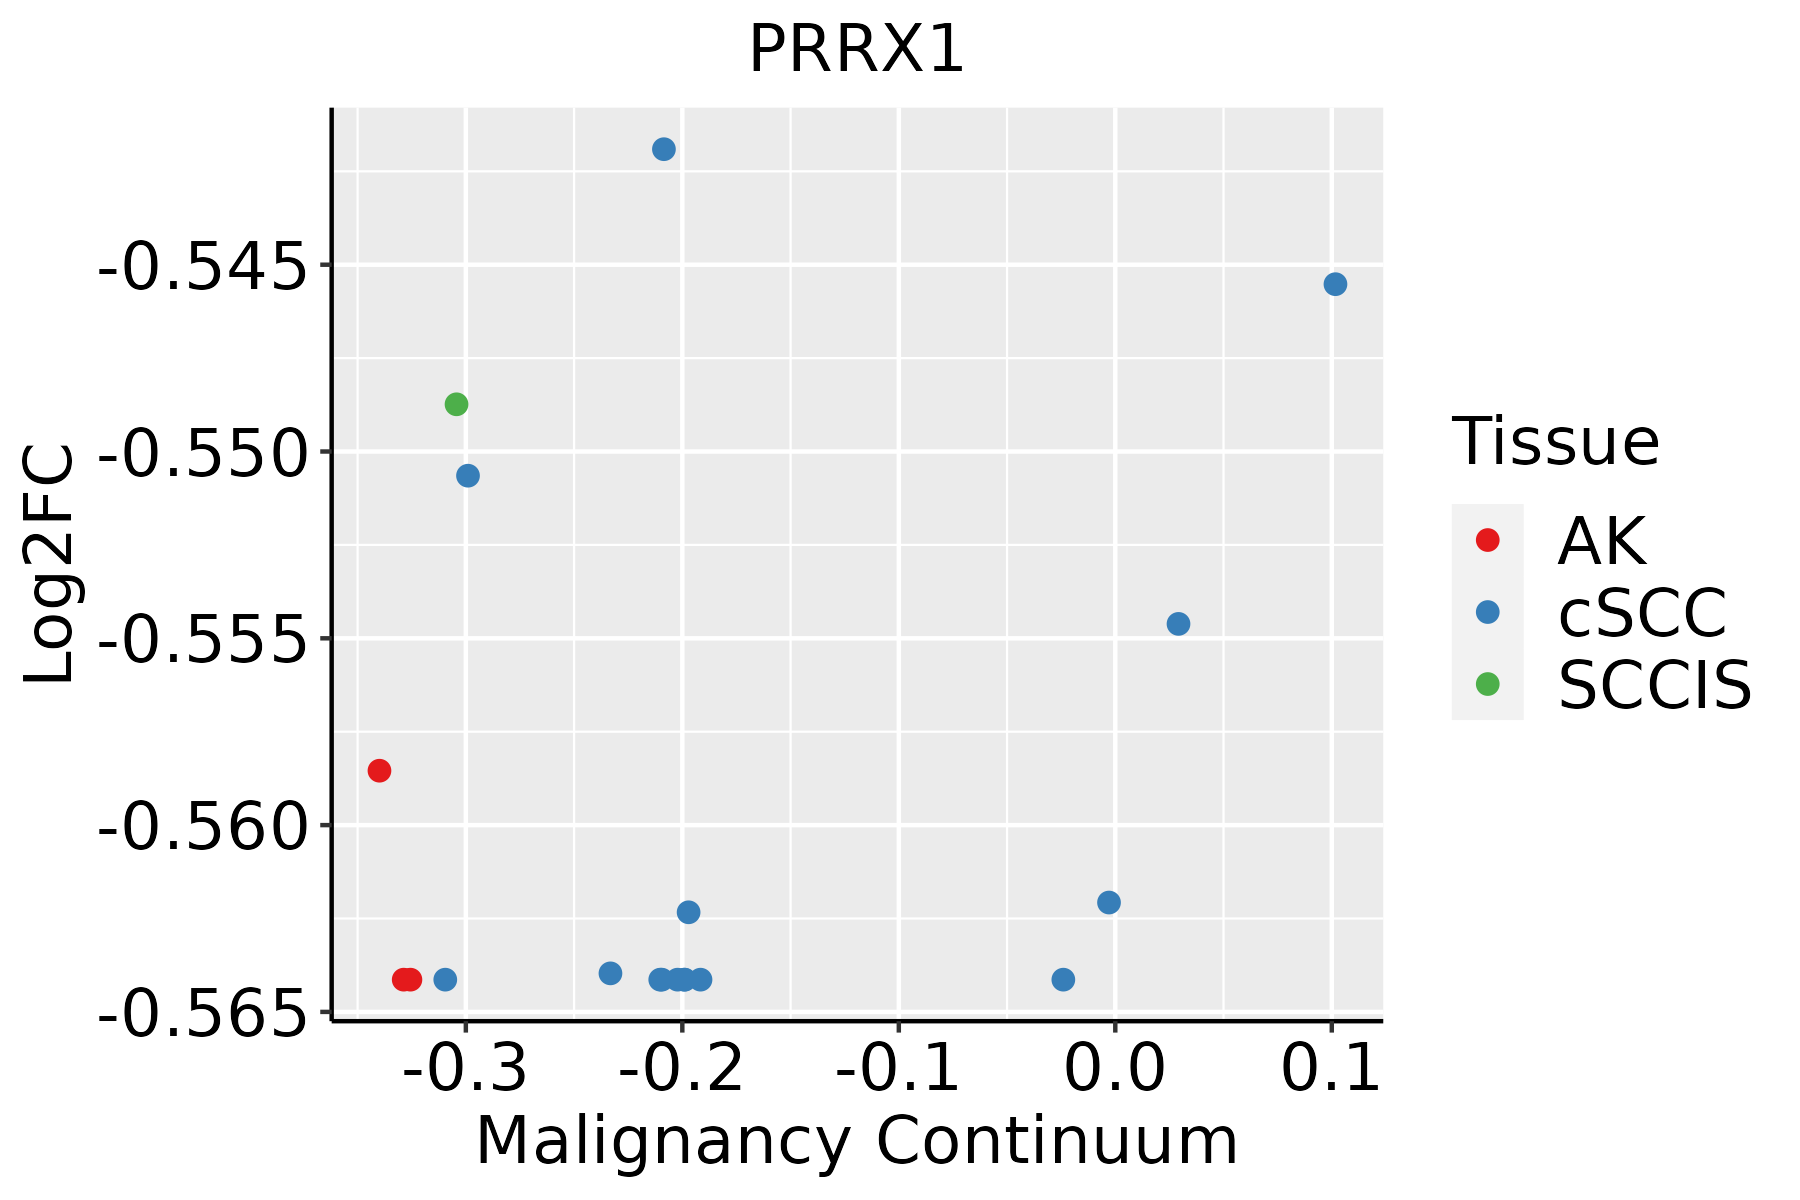 | AK: Actinic keratosis |
| cSCC: Cutaneous squamous cell carcinoma | ||
| SCCIS:squamous cell carcinoma in situ | ||
| Thyroid |  | ATC: Anaplastic thyroid cancer |
| HT: Hashimoto's thyroiditis | ||
| PTC: Papillary thyroid cancer |
| ∗log2FC in expression of this searched gene in stem-like cells from each diseased tissue sample relative to stem-like cells in normal samples in each tissue plotted against the malignancy continuum. Samples are colored based on if they are from different disease stage. |
Top |
Malignant transformation related pathway analysis |
| Find out the enriched GO biological processes and KEGG pathways involved in transition from healthy to precancer to cancer |
| Tissue | Disease Stage | Enriched GO biological Processes |
| Colorectum | AD |  |
| Colorectum | SER |  |
| Colorectum | MSS |  |
| Colorectum | MSI-H |  |
| Colorectum | FAP |  |
| ∗Top 15 enriched GO BP terms are showed in the bar plot of each disease state in each tissue. Each row represents a significant GO biological process which is colored according to the -log10(p.adjust). |
| Page: 1 2 3 4 5 6 7 8 9 |
| GO ID | Tissue | Disease Stage | Description | Gene Ratio | Bg Ratio | pvalue | p.adjust | Count |
| GO:00310997 | Endometrium | AEH | regeneration | 41/2100 | 198/18723 | 7.29e-05 | 1.11e-03 | 41 |
| GO:00109758 | Endometrium | AEH | regulation of neuron projection development | 75/2100 | 445/18723 | 2.01e-04 | 2.54e-03 | 75 |
| GO:00351073 | Endometrium | AEH | appendage morphogenesis | 29/2100 | 138/18723 | 6.06e-04 | 5.94e-03 | 29 |
| GO:00351083 | Endometrium | AEH | limb morphogenesis | 29/2100 | 138/18723 | 6.06e-04 | 5.94e-03 | 29 |
| GO:00487366 | Endometrium | AEH | appendage development | 33/2100 | 172/18723 | 1.41e-03 | 1.18e-02 | 33 |
| GO:00601736 | Endometrium | AEH | limb development | 33/2100 | 172/18723 | 1.41e-03 | 1.18e-02 | 33 |
| GO:0061448 | Endometrium | AEH | connective tissue development | 44/2100 | 252/18723 | 1.92e-03 | 1.51e-02 | 44 |
| GO:0030326 | Endometrium | AEH | embryonic limb morphogenesis | 23/2100 | 116/18723 | 4.58e-03 | 2.95e-02 | 23 |
| GO:0035113 | Endometrium | AEH | embryonic appendage morphogenesis | 23/2100 | 116/18723 | 4.58e-03 | 2.95e-02 | 23 |
| GO:003109914 | Endometrium | EEC | regeneration | 45/2168 | 198/18723 | 6.19e-06 | 1.49e-04 | 45 |
| GO:001097513 | Endometrium | EEC | regulation of neuron projection development | 79/2168 | 445/18723 | 6.80e-05 | 1.01e-03 | 79 |
| GO:003510711 | Endometrium | EEC | appendage morphogenesis | 29/2168 | 138/18723 | 1.01e-03 | 8.89e-03 | 29 |
| GO:003510811 | Endometrium | EEC | limb morphogenesis | 29/2168 | 138/18723 | 1.01e-03 | 8.89e-03 | 29 |
| GO:004873611 | Endometrium | EEC | appendage development | 33/2168 | 172/18723 | 2.38e-03 | 1.75e-02 | 33 |
| GO:006017311 | Endometrium | EEC | limb development | 33/2168 | 172/18723 | 2.38e-03 | 1.75e-02 | 33 |
| GO:0031102 | Endometrium | EEC | neuron projection regeneration | 15/2168 | 60/18723 | 2.88e-03 | 2.03e-02 | 15 |
| GO:00614481 | Endometrium | EEC | connective tissue development | 44/2168 | 252/18723 | 3.51e-03 | 2.36e-02 | 44 |
| GO:00303261 | Endometrium | EEC | embryonic limb morphogenesis | 23/2168 | 116/18723 | 6.73e-03 | 3.93e-02 | 23 |
| GO:00351131 | Endometrium | EEC | embryonic appendage morphogenesis | 23/2168 | 116/18723 | 6.73e-03 | 3.93e-02 | 23 |
| GO:009872714 | Esophagus | ESCC | maintenance of cell number | 90/8552 | 134/18723 | 3.94e-07 | 5.43e-06 | 90 |
| Page: 1 2 3 4 5 |
| Pathway ID | Tissue | Disease Stage | Description | Gene Ratio | Bg Ratio | pvalue | p.adjust | qvalue | Count |
| Page: 1 |
Top |
Cell-cell communication analysis |
| Identification of potential cell-cell interactions between two cell types and their ligand-receptor pairs for different disease states |
| Ligand | Receptor | LRpair | Pathway | Tissue | Disease Stage |
| Page: 1 |
Top |
Single-cell gene regulatory network inference analysis |
| Find out the significant the regulons (TFs) and the target genes of each regulon across cell types for different disease states |
| TF | Cell Type | Tissue | Disease Stage | Target Gene | RSS | Regulon Activity |
| PRRX1 | INCAF | Cervix | N_HPV | SERPING1,AEBP1,COL6A2, etc. | 7.94e-01 |  |
| PRRX1 | HSC | Liver | Cirrhotic | CD44,CYTOR,KCNJ8, etc. | 4.17e-01 |  |
| PRRX1 | PERI | Liver | HCC | CD44,CYTOR,KCNJ8, etc. | 3.26e-01 |  |
| PRRX1 | CAF | Liver | HCC | CD44,CYTOR,KCNJ8, etc. | 4.55e-02 | |
| PRRX1 | MEGA | Liver | Healthy | CD44,CYTOR,KCNJ8, etc. | 9.61e-03 |  |
| PRRX1 | HSC | Liver | NAFLD | CD44,CYTOR,KCNJ8, etc. | 4.08e-02 |  |
| PRRX1 | CAF | Oral cavity | ADJ | COL14A1,VCAN,SOD3, etc. | 3.30e-02 |  |
| PRRX1 | INCAF | Oral cavity | Healthy | COL14A1,VCAN,SOD3, etc. | 4.90e-01 |  |
| PRRX1 | INCAF | Oral cavity | NEOLP | COL14A1,VCAN,SOD3, etc. | 7.97e-01 |  |
| PRRX1 | ICAF | Pancreas | ADJ | COL6A2,COL6A3,COL1A2, etc. | 6.21e-01 |  |
| ∗The dot plots of a searched regulon are shown for all cell subpopulations in each disease state of each tissue based on the regulon specific score inferred using pySCENIC and by calculating the average expression. |
| Page: 1 2 |
Top |
Somatic mutation of malignant transformation related genes |
| Annotation of somatic variants for genes involved in malignant transformation |
| Hugo Symbol | Variant Class | Variant Classification | dbSNP RS | HGVSc | HGVSp | HGVSp Short | SWISSPROT | BIOTYPE | SIFT | PolyPhen | Tumor Sample Barcode | Tissue | Histology | Sex | Age | Stage | Therapy Types | Drugs | Outcome |
| PRRX1 | SNV | Missense_Mutation | c.587N>T | p.Ala196Val | p.A196V | P54821 | protein_coding | tolerated(0.06) | benign(0.142) | TCGA-A8-A096-01 | Breast | breast invasive carcinoma | Female | >=65 | I/II | Unknown | Unknown | SD | |
| PRRX1 | SNV | Missense_Mutation | c.96G>T | p.Lys32Asn | p.K32N | P54821 | protein_coding | deleterious(0.01) | probably_damaging(0.981) | TCGA-AN-A046-01 | Breast | breast invasive carcinoma | Female | >=65 | I/II | Unknown | Unknown | SD | |
| PRRX1 | SNV | Missense_Mutation | c.284N>A | p.Arg95Gln | p.R95Q | P54821 | protein_coding | deleterious(0.01) | probably_damaging(0.988) | TCGA-BH-A18F-01 | Breast | breast invasive carcinoma | Female | <65 | I/II | Chemotherapy | taxotere | CR | |
| PRRX1 | SNV | Missense_Mutation | c.526G>C | p.Glu176Gln | p.E176Q | P54821 | protein_coding | deleterious(0) | probably_damaging(0.932) | TCGA-E2-A10C-01 | Breast | breast invasive carcinoma | Female | <65 | I/II | Chemotherapy | cytoxan | SD | |
| PRRX1 | SNV | Missense_Mutation | novel | c.434N>A | p.Arg145Gln | p.R145Q | P54821 | protein_coding | deleterious(0) | probably_damaging(0.988) | TCGA-E2-A154-01 | Breast | breast invasive carcinoma | Female | >=65 | I/II | Hormone Therapy | arimidex | SD |
| PRRX1 | SNV | Missense_Mutation | rs761253714 | c.484N>A | p.Ala162Thr | p.A162T | P54821 | protein_coding | tolerated(0.07) | benign(0.236) | TCGA-E2-A1LH-01 | Breast | breast invasive carcinoma | Female | <65 | I/II | Chemotherapy | adriamycin | SD |
| PRRX1 | SNV | Missense_Mutation | c.587C>T | p.Ala196Val | p.A196V | P54821 | protein_coding | tolerated(0.06) | benign(0.142) | TCGA-E9-A1RE-01 | Breast | breast invasive carcinoma | Female | >=65 | III/IV | Hormone Therapy | tamoxiphen | SD | |
| PRRX1 | SNV | Missense_Mutation | c.257N>T | p.Ser86Leu | p.S86L | P54821 | protein_coding | tolerated(0.08) | benign(0.011) | TCGA-C5-A7CL-01 | Cervix | cervical & endocervical cancer | Female | <65 | III/IV | Chemotherapy | cisplatin | PD | |
| PRRX1 | SNV | Missense_Mutation | novel | c.434N>A | p.Arg145Gln | p.R145Q | P54821 | protein_coding | deleterious(0) | probably_damaging(0.988) | TCGA-EA-A3HS-01 | Cervix | cervical & endocervical cancer | Female | <65 | I/II | Unknown | Unknown | SD |
| PRRX1 | SNV | Missense_Mutation | novel | c.445T>C | p.Phe149Leu | p.F149L | P54821 | protein_coding | deleterious(0) | possibly_damaging(0.757) | TCGA-AA-3510-01 | Colorectum | colon adenocarcinoma | Male | >=65 | I/II | Unknown | Unknown | SD |
| Page: 1 2 3 4 5 |
Top |
Related drugs of malignant transformation related genes |
| Identification of chemicals and drugs interact with genes involved in malignant transfromation |
| (DGIdb 4.0) |
| Entrez ID | Symbol | Category | Interaction Types | Drug Claim Name | Drug Name | PMIDs |
| Page: 1 |

Copyright 2023-Present -The University of Texas Health Science Center at Houston |