
|
|||||
|
 | |
| |
| |
| |
| |
| |
|
Gene: PRICKLE3 |
Gene summary for PRICKLE3 |
| Gene information | Species | Human | Gene symbol | PRICKLE3 | Gene ID | 4007 |
| Gene name | prickle planar cell polarity protein 3 | |
| Gene Alias | LMO6 | |
| Cytomap | Xp11.23 | |
| Gene Type | protein-coding | GO ID | GO:0008150 | UniProtAcc | B7Z5U0 |
Top |
Malignant transformation analysis |
| Identification of the aberrant gene expression in precancerous and cancerous lesions by comparing the gene expression of stem-like cells in diseased tissues with normal stem cells |
| Entrez ID | Symbol | Replicates | Species | Organ | Tissue | Adj P-value | Log2FC | Malignancy |
| 4007 | PRICKLE3 | P48T-E | Human | Esophagus | ESCC | 3.89e-12 | 2.23e-01 | 0.0959 |
| 4007 | PRICKLE3 | P49T-E | Human | Esophagus | ESCC | 5.23e-14 | 8.32e-01 | 0.1768 |
| 4007 | PRICKLE3 | P52T-E | Human | Esophagus | ESCC | 3.02e-26 | 4.89e-01 | 0.1555 |
| 4007 | PRICKLE3 | P54T-E | Human | Esophagus | ESCC | 9.95e-16 | 3.33e-01 | 0.0975 |
| 4007 | PRICKLE3 | P56T-E | Human | Esophagus | ESCC | 2.17e-07 | 5.28e-01 | 0.1613 |
| 4007 | PRICKLE3 | P57T-E | Human | Esophagus | ESCC | 1.96e-05 | 1.32e-01 | 0.0926 |
| 4007 | PRICKLE3 | P61T-E | Human | Esophagus | ESCC | 1.78e-24 | 4.64e-01 | 0.099 |
| 4007 | PRICKLE3 | P62T-E | Human | Esophagus | ESCC | 1.63e-39 | 6.63e-01 | 0.1302 |
| 4007 | PRICKLE3 | P65T-E | Human | Esophagus | ESCC | 1.75e-04 | 1.23e-01 | 0.0978 |
| 4007 | PRICKLE3 | P74T-E | Human | Esophagus | ESCC | 6.89e-16 | 3.90e-01 | 0.1479 |
| 4007 | PRICKLE3 | P75T-E | Human | Esophagus | ESCC | 1.47e-14 | 2.94e-01 | 0.1125 |
| 4007 | PRICKLE3 | P76T-E | Human | Esophagus | ESCC | 2.03e-09 | 1.96e-01 | 0.1207 |
| 4007 | PRICKLE3 | P79T-E | Human | Esophagus | ESCC | 2.28e-35 | 5.70e-01 | 0.1154 |
| 4007 | PRICKLE3 | P80T-E | Human | Esophagus | ESCC | 4.08e-29 | 6.31e-01 | 0.155 |
| 4007 | PRICKLE3 | P82T-E | Human | Esophagus | ESCC | 2.06e-06 | 3.85e-01 | 0.1072 |
| 4007 | PRICKLE3 | P83T-E | Human | Esophagus | ESCC | 1.14e-30 | 6.65e-01 | 0.1738 |
| 4007 | PRICKLE3 | P84T-E | Human | Esophagus | ESCC | 2.46e-07 | 3.72e-01 | 0.0933 |
| 4007 | PRICKLE3 | P89T-E | Human | Esophagus | ESCC | 5.84e-12 | 5.21e-01 | 0.1752 |
| 4007 | PRICKLE3 | P91T-E | Human | Esophagus | ESCC | 2.29e-12 | 8.05e-01 | 0.1828 |
| 4007 | PRICKLE3 | P107T-E | Human | Esophagus | ESCC | 2.28e-44 | 8.87e-01 | 0.171 |
| Page: 1 2 3 4 |
| Tissue | Expression Dynamics | Abbreviation |
| Esophagus | 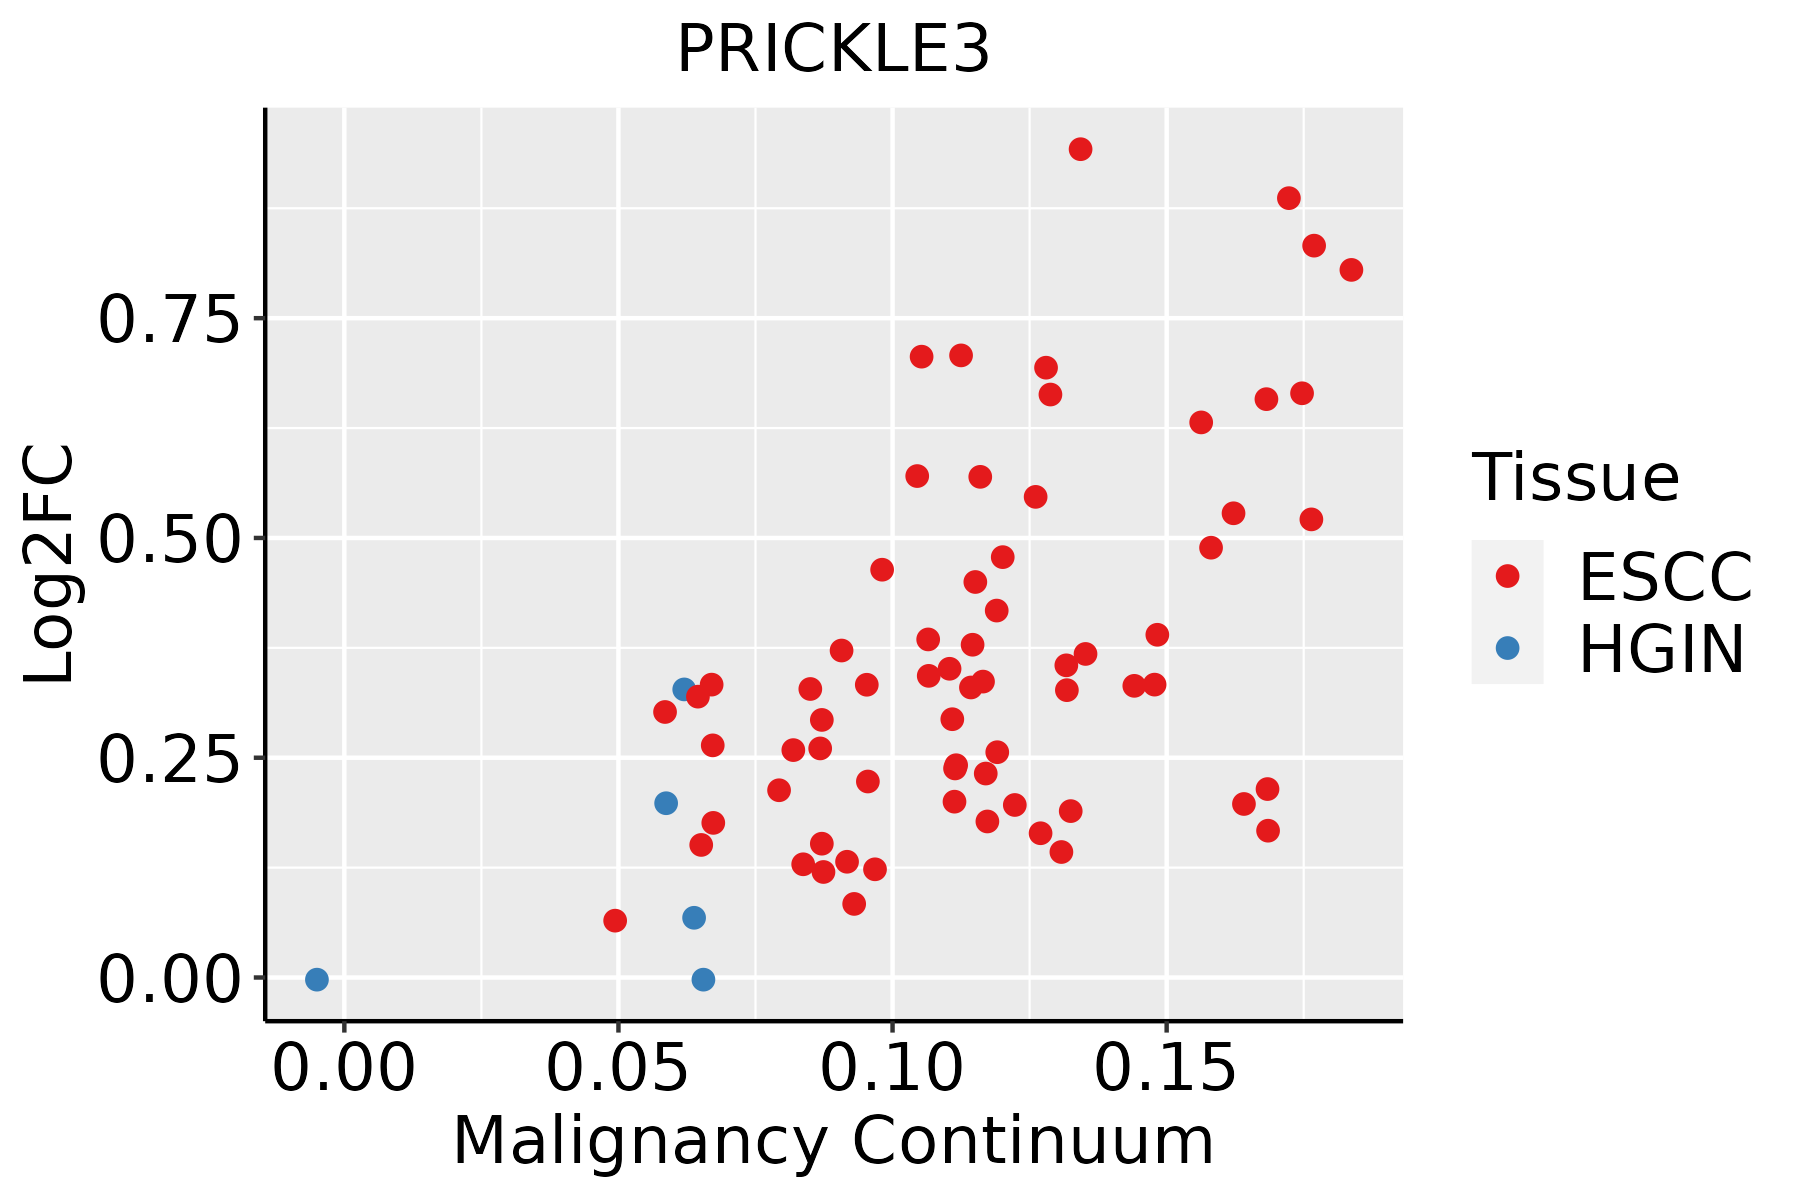 | ESCC: Esophageal squamous cell carcinoma |
| HGIN: High-grade intraepithelial neoplasias | ||
| LGIN: Low-grade intraepithelial neoplasias |
| ∗log2FC in expression of this searched gene in stem-like cells from each diseased tissue sample relative to stem-like cells in normal samples in each tissue plotted against the malignancy continuum. Samples are colored based on if they are from different disease stage. |
Top |
Malignant transformation related pathway analysis |
| Find out the enriched GO biological processes and KEGG pathways involved in transition from healthy to precancer to cancer |
| Tissue | Disease Stage | Enriched GO biological Processes |
| Colorectum | AD |  |
| Colorectum | SER |  |
| Colorectum | MSS |  |
| Colorectum | MSI-H |  |
| Colorectum | FAP |  |
| ∗Top 15 enriched GO BP terms are showed in the bar plot of each disease state in each tissue. Each row represents a significant GO biological process which is colored according to the -log10(p.adjust). |
| Page: 1 2 3 4 5 6 7 8 9 |
| GO ID | Tissue | Disease Stage | Description | Gene Ratio | Bg Ratio | pvalue | p.adjust | Count |
| Page: 1 |
| Pathway ID | Tissue | Disease Stage | Description | Gene Ratio | Bg Ratio | pvalue | p.adjust | qvalue | Count |
| Page: 1 |
Top |
Cell-cell communication analysis |
| Identification of potential cell-cell interactions between two cell types and their ligand-receptor pairs for different disease states |
| Ligand | Receptor | LRpair | Pathway | Tissue | Disease Stage |
| Page: 1 |
Top |
Single-cell gene regulatory network inference analysis |
| Find out the significant the regulons (TFs) and the target genes of each regulon across cell types for different disease states |
| TF | Cell Type | Tissue | Disease Stage | Target Gene | RSS | Regulon Activity |
| ∗The dot plots of a searched regulon are shown for all cell subpopulations in each disease state of each tissue based on the regulon specific score inferred using pySCENIC and by calculating the average expression. |
| Page: 1 |
Top |
Somatic mutation of malignant transformation related genes |
| Annotation of somatic variants for genes involved in malignant transformation |
| Hugo Symbol | Variant Class | Variant Classification | dbSNP RS | HGVSc | HGVSp | HGVSp Short | SWISSPROT | BIOTYPE | SIFT | PolyPhen | Tumor Sample Barcode | Tissue | Histology | Sex | Age | Stage | Therapy Types | Drugs | Outcome |
| PRICKLE3 | SNV | Missense_Mutation | c.1603N>A | p.Asp535Asn | p.D535N | O43900 | protein_coding | tolerated_low_confidence(0.3) | benign(0) | TCGA-B6-A0I2-01 | Breast | breast invasive carcinoma | Female | <65 | I/II | Unknown | Unknown | SD | |
| PRICKLE3 | SNV | Missense_Mutation | rs200820390 | c.1529G>A | p.Arg510His | p.R510H | O43900 | protein_coding | tolerated_low_confidence(0.29) | benign(0) | TCGA-B6-A0I9-01 | Breast | breast invasive carcinoma | Female | <65 | III/IV | Unknown | Unknown | PD |
| PRICKLE3 | SNV | Missense_Mutation | rs782748548 | c.865N>T | p.Arg289Cys | p.R289C | O43900 | protein_coding | deleterious(0) | probably_damaging(0.996) | TCGA-C8-A26X-01 | Breast | breast invasive carcinoma | Female | <65 | I/II | Chemotherapy | 5-fluorouracil | CR |
| PRICKLE3 | insertion | Frame_Shift_Ins | novel | c.1590_1591insTGCTCAGGACACTGCAATGGAGACCTTCAACTCCCCATCTTTAT | p.His531CysfsTer49 | p.H531Cfs*49 | O43900 | protein_coding | TCGA-A2-A0CX-01 | Breast | breast invasive carcinoma | Female | <65 | I/II | Chemotherapy | adriamycin | SD | ||
| PRICKLE3 | deletion | Frame_Shift_Del | novel | c.1310_1316delNNNNNNN | p.Ser437TrpfsTer52 | p.S437Wfs*52 | O43900 | protein_coding | TCGA-B6-A0IE-01 | Breast | breast invasive carcinoma | Female | <65 | III/IV | Unknown | Unknown | PD | ||
| PRICKLE3 | SNV | Missense_Mutation | novel | c.1051N>T | p.Arg351Cys | p.R351C | O43900 | protein_coding | tolerated(0.13) | benign(0.026) | TCGA-2W-A8YY-01 | Cervix | cervical & endocervical cancer | Female | <65 | I/II | Chemotherapy | cisplatin | CR |
| PRICKLE3 | SNV | Missense_Mutation | rs144390456 | c.1663N>A | p.Glu555Lys | p.E555K | O43900 | protein_coding | deleterious_low_confidence(0.03) | possibly_damaging(0.522) | TCGA-C5-A1BI-01 | Cervix | cervical & endocervical cancer | Female | <65 | III/IV | Chemotherapy | cisplatin | SD |
| PRICKLE3 | SNV | Missense_Mutation | novel | c.1241N>A | p.Thr414Lys | p.T414K | O43900 | protein_coding | tolerated(0.16) | benign(0.045) | TCGA-C5-A8ZZ-01 | Cervix | cervical & endocervical cancer | Female | <65 | I/II | Unspecific | Cisplatin | SD |
| PRICKLE3 | SNV | Missense_Mutation | c.679N>C | p.Asp227His | p.D227H | O43900 | protein_coding | deleterious(0) | probably_damaging(0.993) | TCGA-IR-A3LK-01 | Cervix | cervical & endocervical cancer | Female | >=65 | I/II | Chemotherapy | cisplatin | PD | |
| PRICKLE3 | SNV | Missense_Mutation | novel | c.442G>A | p.Ala148Thr | p.A148T | O43900 | protein_coding | tolerated(0.09) | benign(0.055) | TCGA-ZJ-AAXA-01 | Cervix | cervical & endocervical cancer | Female | <65 | I/II | Unknown | Unknown | SD |
| Page: 1 2 3 4 5 6 7 8 |
Top |
Related drugs of malignant transformation related genes |
| Identification of chemicals and drugs interact with genes involved in malignant transfromation |
| (DGIdb 4.0) |
| Entrez ID | Symbol | Category | Interaction Types | Drug Claim Name | Drug Name | PMIDs |
| Page: 1 |

Copyright 2023-Present -The University of Texas Health Science Center at Houston |