
|
|||||
|
 | |
| |
| |
| |
| |
| |
|
Gene: PQLC3 |
Gene summary for PQLC3 |
| Gene information | Species | Human | Gene symbol | PQLC3 | Gene ID | 130814 |
| Gene name | solute carrier family 66 member 3 | |
| Gene Alias | C2orf22 | |
| Cytomap | 2p25.1 | |
| Gene Type | protein-coding | GO ID | GO:0005575 | UniProtAcc | Q8N755 |
Top |
Malignant transformation analysis |
| Identification of the aberrant gene expression in precancerous and cancerous lesions by comparing the gene expression of stem-like cells in diseased tissues with normal stem cells |
| Entrez ID | Symbol | Replicates | Species | Organ | Tissue | Adj P-value | Log2FC | Malignancy |
| 130814 | PQLC3 | P75T-E | Human | Esophagus | ESCC | 1.53e-19 | 3.99e-01 | 0.1125 |
| 130814 | PQLC3 | P76T-E | Human | Esophagus | ESCC | 4.75e-10 | 2.52e-01 | 0.1207 |
| 130814 | PQLC3 | P79T-E | Human | Esophagus | ESCC | 3.92e-16 | 3.45e-01 | 0.1154 |
| 130814 | PQLC3 | P80T-E | Human | Esophagus | ESCC | 1.56e-40 | 1.19e+00 | 0.155 |
| 130814 | PQLC3 | P82T-E | Human | Esophagus | ESCC | 2.45e-13 | 7.56e-01 | 0.1072 |
| 130814 | PQLC3 | P83T-E | Human | Esophagus | ESCC | 1.39e-21 | 6.25e-01 | 0.1738 |
| 130814 | PQLC3 | P84T-E | Human | Esophagus | ESCC | 9.09e-06 | 3.58e-01 | 0.0933 |
| 130814 | PQLC3 | P89T-E | Human | Esophagus | ESCC | 2.27e-06 | 6.91e-01 | 0.1752 |
| 130814 | PQLC3 | P91T-E | Human | Esophagus | ESCC | 3.27e-06 | 7.77e-01 | 0.1828 |
| 130814 | PQLC3 | P107T-E | Human | Esophagus | ESCC | 3.07e-21 | 5.04e-01 | 0.171 |
| 130814 | PQLC3 | P127T-E | Human | Esophagus | ESCC | 5.06e-08 | 2.08e-01 | 0.0826 |
| 130814 | PQLC3 | P128T-E | Human | Esophagus | ESCC | 1.23e-12 | 5.11e-01 | 0.1241 |
| 130814 | PQLC3 | P130T-E | Human | Esophagus | ESCC | 1.03e-57 | 1.17e+00 | 0.1676 |
| 130814 | PQLC3 | S43 | Human | Liver | Cirrhotic | 9.14e-03 | -1.29e-01 | -0.0187 |
| 130814 | PQLC3 | HCC1_Meng | Human | Liver | HCC | 5.54e-29 | -3.59e-02 | 0.0246 |
| 130814 | PQLC3 | HCC2_Meng | Human | Liver | HCC | 3.70e-29 | 9.57e-02 | 0.0107 |
| 130814 | PQLC3 | cirrhotic1 | Human | Liver | Cirrhotic | 1.47e-03 | 5.48e-02 | 0.0202 |
| 130814 | PQLC3 | cirrhotic2 | Human | Liver | Cirrhotic | 4.63e-03 | 9.23e-02 | 0.0201 |
| 130814 | PQLC3 | HCC1 | Human | Liver | HCC | 1.97e-04 | 1.18e+00 | 0.5336 |
| 130814 | PQLC3 | Pt13.b | Human | Liver | HCC | 2.84e-02 | 3.22e-02 | 0.0251 |
| Page: 1 2 3 4 5 |
| Tissue | Expression Dynamics | Abbreviation |
| Esophagus | 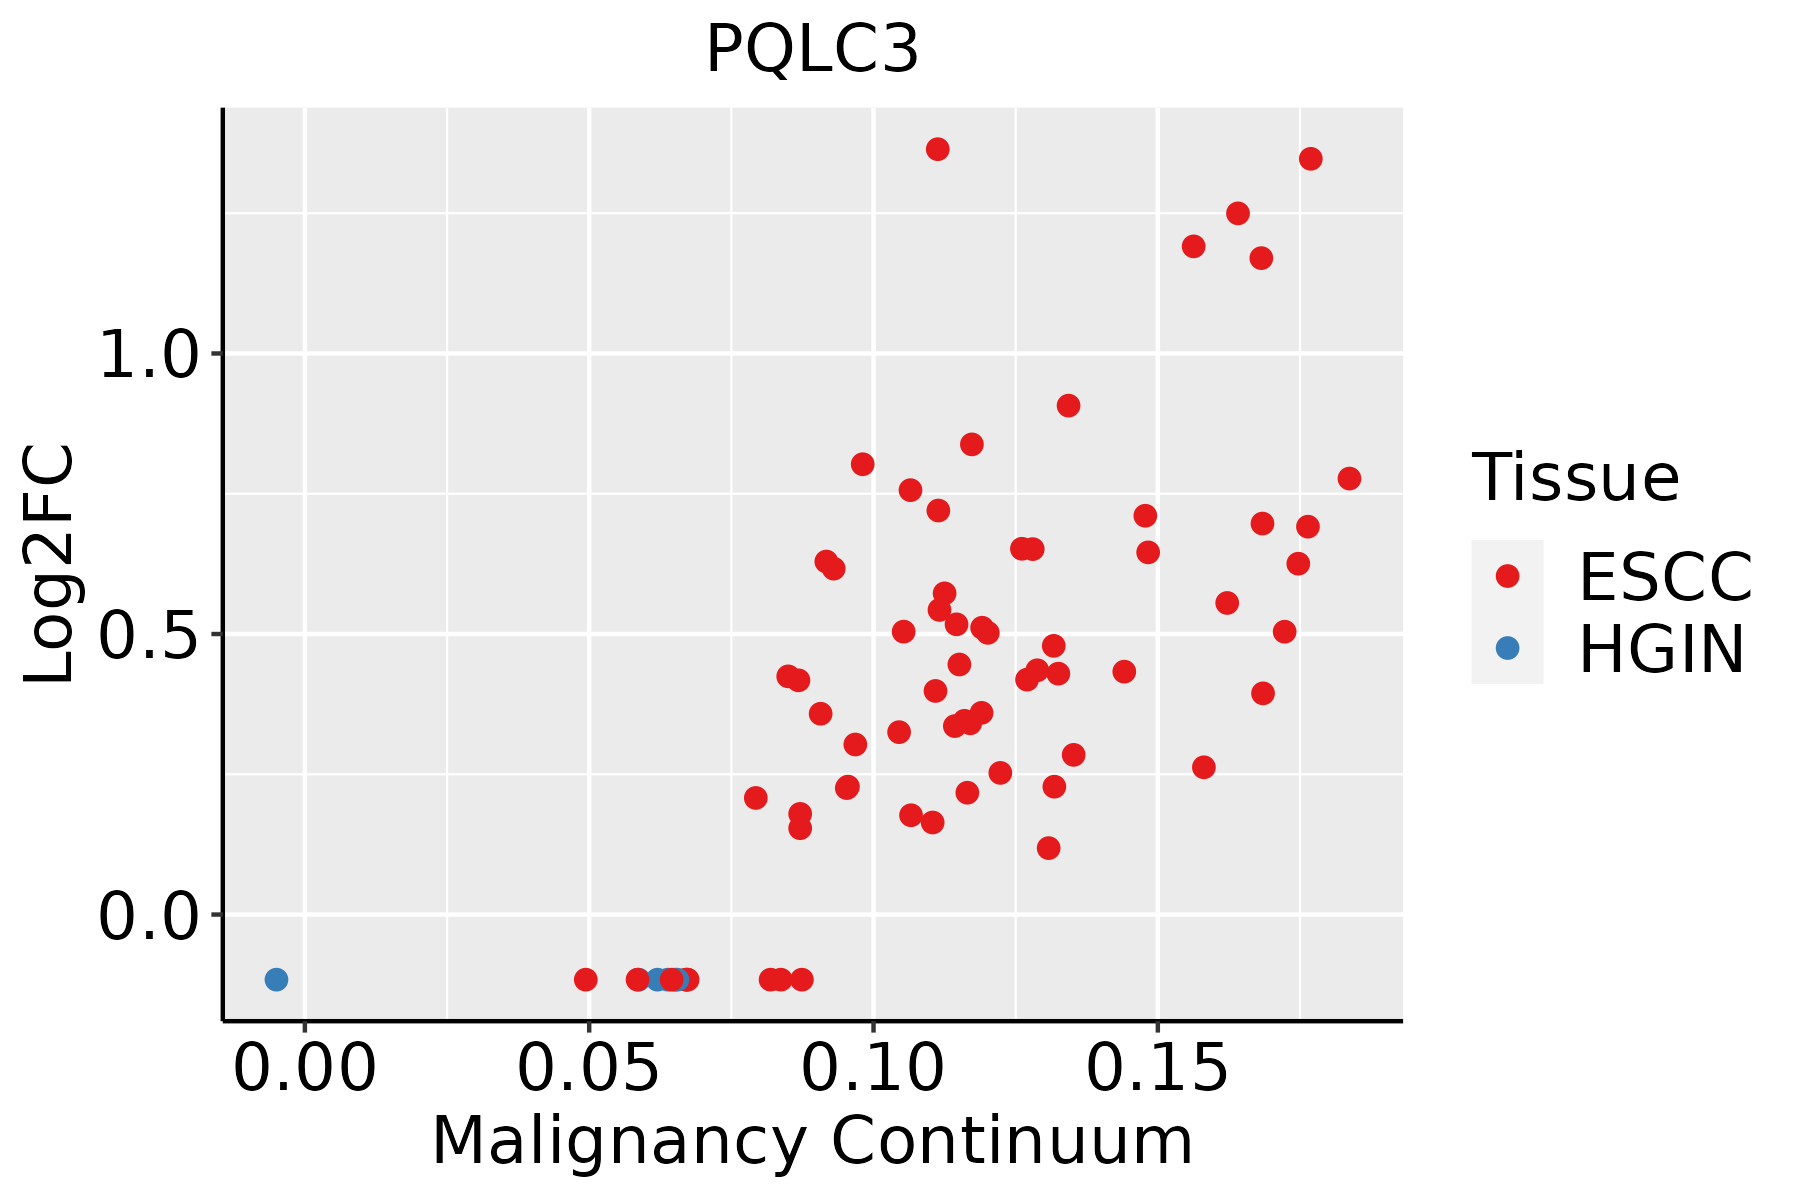 | ESCC: Esophageal squamous cell carcinoma |
| HGIN: High-grade intraepithelial neoplasias | ||
| LGIN: Low-grade intraepithelial neoplasias | ||
| Liver | 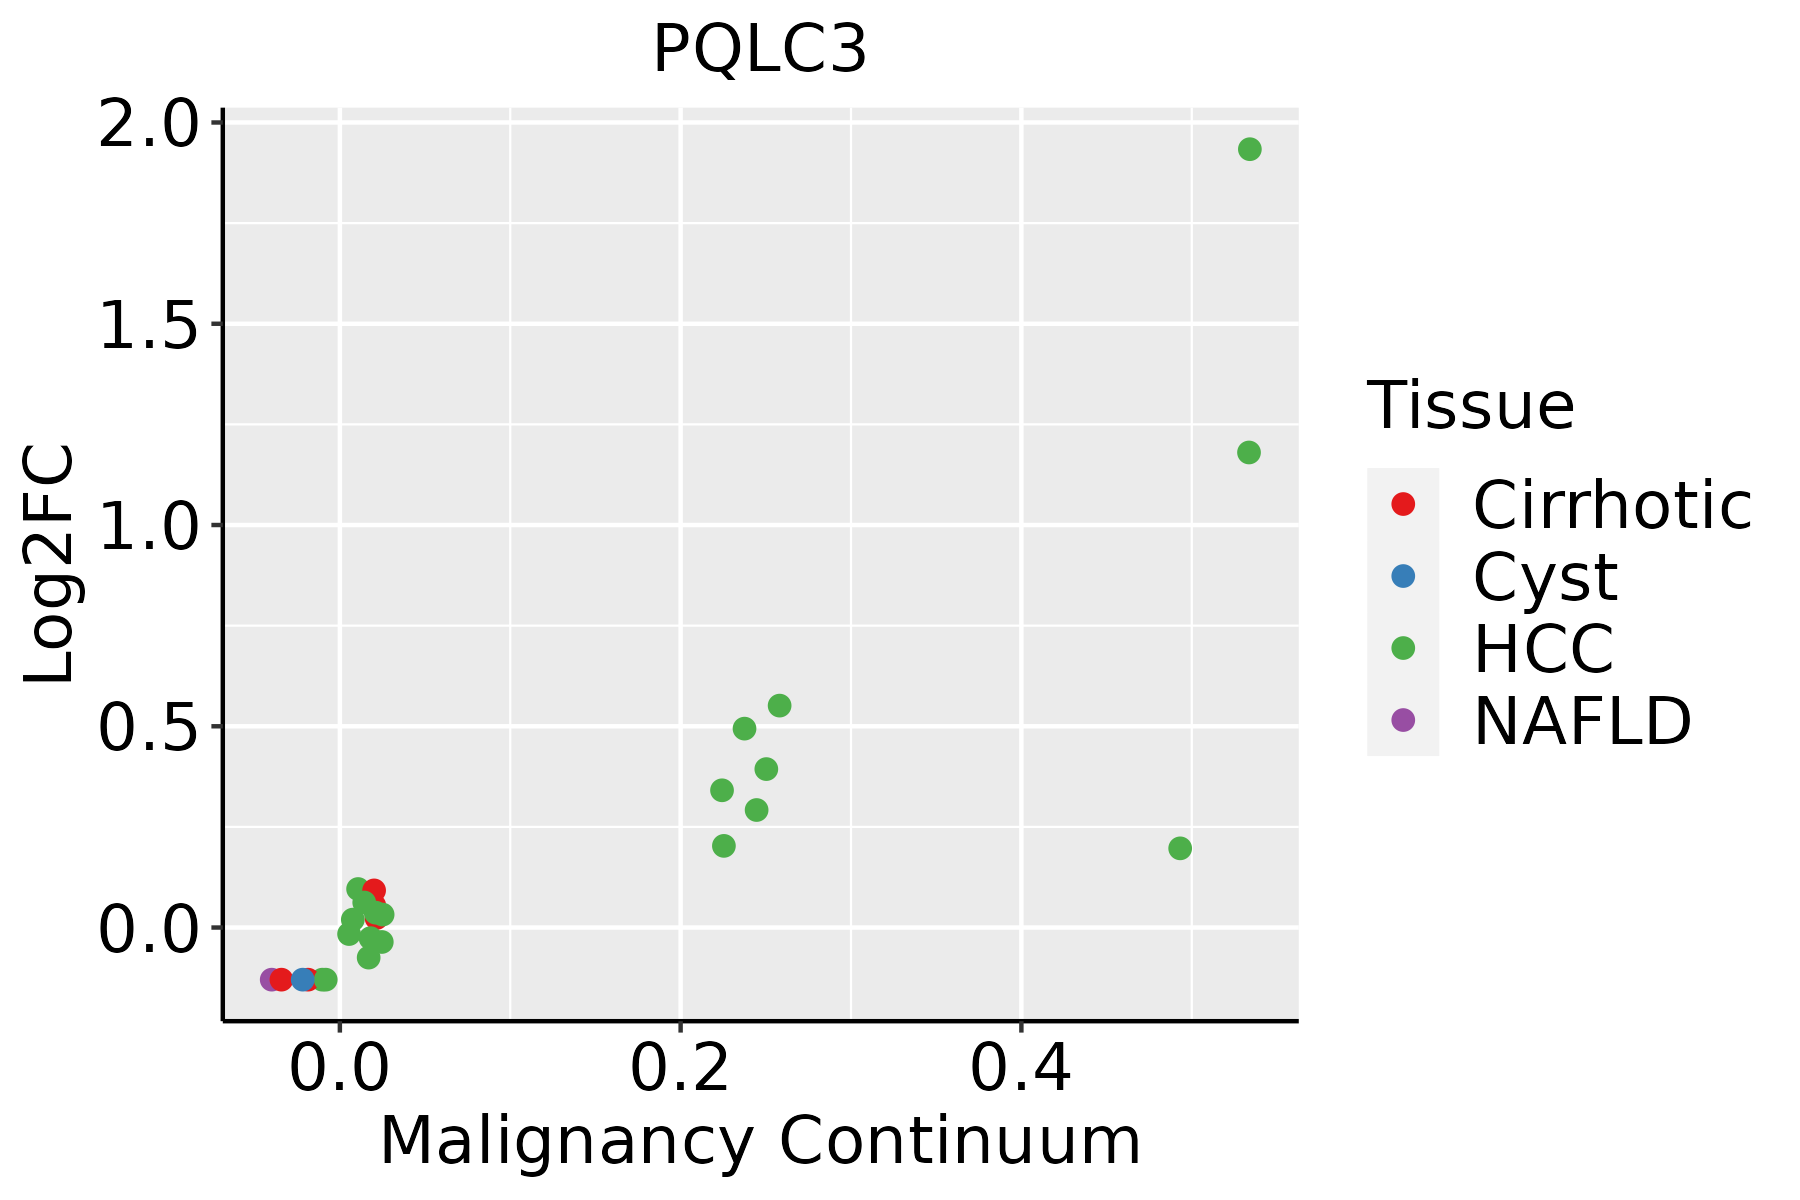 | HCC: Hepatocellular carcinoma |
| NAFLD: Non-alcoholic fatty liver disease | ||
| Oral Cavity |  | EOLP: Erosive Oral lichen planus |
| LP: leukoplakia | ||
| NEOLP: Non-erosive oral lichen planus | ||
| OSCC: Oral squamous cell carcinoma |
| ∗log2FC in expression of this searched gene in stem-like cells from each diseased tissue sample relative to stem-like cells in normal samples in each tissue plotted against the malignancy continuum. Samples are colored based on if they are from different disease stage. |
Top |
Malignant transformation related pathway analysis |
| Find out the enriched GO biological processes and KEGG pathways involved in transition from healthy to precancer to cancer |
| Tissue | Disease Stage | Enriched GO biological Processes |
| Colorectum | AD |  |
| Colorectum | SER |  |
| Colorectum | MSS |  |
| Colorectum | MSI-H |  |
| Colorectum | FAP |  |
| ∗Top 15 enriched GO BP terms are showed in the bar plot of each disease state in each tissue. Each row represents a significant GO biological process which is colored according to the -log10(p.adjust). |
| Page: 1 2 3 4 5 6 7 8 9 |
| GO ID | Tissue | Disease Stage | Description | Gene Ratio | Bg Ratio | pvalue | p.adjust | Count |
| Page: 1 |
| Pathway ID | Tissue | Disease Stage | Description | Gene Ratio | Bg Ratio | pvalue | p.adjust | qvalue | Count |
| Page: 1 |
Top |
Cell-cell communication analysis |
| Identification of potential cell-cell interactions between two cell types and their ligand-receptor pairs for different disease states |
| Ligand | Receptor | LRpair | Pathway | Tissue | Disease Stage |
| Page: 1 |
Top |
Single-cell gene regulatory network inference analysis |
| Find out the significant the regulons (TFs) and the target genes of each regulon across cell types for different disease states |
| TF | Cell Type | Tissue | Disease Stage | Target Gene | RSS | Regulon Activity |
| ∗The dot plots of a searched regulon are shown for all cell subpopulations in each disease state of each tissue based on the regulon specific score inferred using pySCENIC and by calculating the average expression. |
| Page: 1 |
Top |
Somatic mutation of malignant transformation related genes |
| Annotation of somatic variants for genes involved in malignant transformation |
| Hugo Symbol | Variant Class | Variant Classification | dbSNP RS | HGVSc | HGVSp | HGVSp Short | SWISSPROT | BIOTYPE | SIFT | PolyPhen | Tumor Sample Barcode | Tissue | Histology | Sex | Age | Stage | Therapy Types | Drugs | Outcome |
| PQLC3 | SNV | Missense_Mutation | rs772145693 | c.316A>G | p.Ile106Val | p.I106V | Q8N755 | protein_coding | tolerated(0.91) | benign(0) | TCGA-AA-3949-01 | Colorectum | colon adenocarcinoma | Female | >=65 | III/IV | Unknown | Unknown | SD |
| PQLC3 | SNV | Missense_Mutation | rs761512561 | c.337N>G | p.Ile113Val | p.I113V | Q8N755 | protein_coding | tolerated(0.22) | benign(0.007) | TCGA-AA-3952-01 | Colorectum | colon adenocarcinoma | Male | >=65 | III/IV | Unknown | Unknown | PD |
| PQLC3 | SNV | Missense_Mutation | novel | c.520C>A | p.Leu174Ile | p.L174I | Q8N755 | protein_coding | deleterious(0.02) | benign(0.189) | TCGA-AA-A00N-01 | Colorectum | colon adenocarcinoma | Male | >=65 | I/II | Unknown | Unknown | PD |
| PQLC3 | SNV | Missense_Mutation | novel | c.350N>G | p.Ala117Gly | p.A117G | Q8N755 | protein_coding | tolerated(0.07) | benign(0.354) | TCGA-AG-3896-01 | Colorectum | rectum adenocarcinoma | Female | >=65 | I/II | Unknown | Unknown | SD |
| PQLC3 | SNV | Missense_Mutation | novel | c.343N>T | p.Asp115Tyr | p.D115Y | Q8N755 | protein_coding | deleterious(0) | probably_damaging(0.999) | TCGA-AG-A002-01 | Colorectum | rectum adenocarcinoma | Male | <65 | I/II | Unknown | Unknown | SD |
| PQLC3 | SNV | Missense_Mutation | c.369C>A | p.Phe123Leu | p.F123L | Q8N755 | protein_coding | tolerated(1) | benign(0) | TCGA-EI-6917-01 | Colorectum | rectum adenocarcinoma | Male | <65 | III/IV | Chemotherapy | 5fluorouracil+oxaciplatina+l-folinian | SD | |
| PQLC3 | SNV | Missense_Mutation | rs140598852 | c.160N>T | p.Arg54Trp | p.R54W | Q8N755 | protein_coding | deleterious(0.02) | probably_damaging(0.988) | TCGA-A5-A0G2-01 | Endometrium | uterine corpus endometrioid carcinoma | Female | <65 | III/IV | Unknown | Unknown | SD |
| PQLC3 | SNV | Missense_Mutation | novel | c.436A>G | p.Ser146Gly | p.S146G | Q8N755 | protein_coding | deleterious(0) | probably_damaging(0.989) | TCGA-B5-A0JU-01 | Endometrium | uterine corpus endometrioid carcinoma | Female | <65 | I/II | Unknown | Unknown | SD |
| PQLC3 | SNV | Missense_Mutation | novel | c.308C>A | p.Ser103Tyr | p.S103Y | Q8N755 | protein_coding | deleterious(0.01) | possibly_damaging(0.541) | TCGA-D1-A17Q-01 | Endometrium | uterine corpus endometrioid carcinoma | Female | <65 | I/II | Unknown | Unknown | SD |
| PQLC3 | SNV | Missense_Mutation | rs138558048 | c.577C>T | p.Arg193Cys | p.R193C | Q8N755 | protein_coding | tolerated(0.1) | possibly_damaging(0.549) | TCGA-D1-A17Q-01 | Endometrium | uterine corpus endometrioid carcinoma | Female | <65 | I/II | Unknown | Unknown | SD |
| Page: 1 2 3 |
Top |
Related drugs of malignant transformation related genes |
| Identification of chemicals and drugs interact with genes involved in malignant transfromation |
| (DGIdb 4.0) |
| Entrez ID | Symbol | Category | Interaction Types | Drug Claim Name | Drug Name | PMIDs |
| Page: 1 |

Copyright 2023-Present -The University of Texas Health Science Center at Houston |