
|
|||||
|
 | |
| |
| |
| |
| |
| |
|
Gene: PPP1R16A |
Gene summary for PPP1R16A |
| Gene information | Species | Human | Gene symbol | PPP1R16A | Gene ID | 84988 |
| Gene name | protein phosphatase 1 regulatory subunit 16A | |
| Gene Alias | MYPT3 | |
| Cytomap | 8q24.3 | |
| Gene Type | protein-coding | GO ID | GO:0006464 | UniProtAcc | Q96I34 |
Top |
Malignant transformation analysis |
| Identification of the aberrant gene expression in precancerous and cancerous lesions by comparing the gene expression of stem-like cells in diseased tissues with normal stem cells |
| Entrez ID | Symbol | Replicates | Species | Organ | Tissue | Adj P-value | Log2FC | Malignancy |
| 84988 | PPP1R16A | P32T-E | Human | Esophagus | ESCC | 3.92e-12 | 3.23e-01 | 0.1666 |
| 84988 | PPP1R16A | P36T-E | Human | Esophagus | ESCC | 6.01e-04 | 2.12e-01 | 0.1187 |
| 84988 | PPP1R16A | P37T-E | Human | Esophagus | ESCC | 1.14e-09 | 2.44e-01 | 0.1371 |
| 84988 | PPP1R16A | P38T-E | Human | Esophagus | ESCC | 2.64e-08 | 3.57e-01 | 0.127 |
| 84988 | PPP1R16A | P39T-E | Human | Esophagus | ESCC | 7.21e-10 | 2.14e-01 | 0.0894 |
| 84988 | PPP1R16A | P40T-E | Human | Esophagus | ESCC | 1.87e-08 | 4.53e-01 | 0.109 |
| 84988 | PPP1R16A | P42T-E | Human | Esophagus | ESCC | 1.08e-21 | 4.96e-01 | 0.1175 |
| 84988 | PPP1R16A | P44T-E | Human | Esophagus | ESCC | 7.97e-23 | 5.22e-01 | 0.1096 |
| 84988 | PPP1R16A | P47T-E | Human | Esophagus | ESCC | 3.60e-17 | 3.89e-01 | 0.1067 |
| 84988 | PPP1R16A | P48T-E | Human | Esophagus | ESCC | 2.86e-20 | 5.13e-01 | 0.0959 |
| 84988 | PPP1R16A | P49T-E | Human | Esophagus | ESCC | 2.12e-10 | 9.03e-01 | 0.1768 |
| 84988 | PPP1R16A | P52T-E | Human | Esophagus | ESCC | 1.19e-25 | 7.08e-01 | 0.1555 |
| 84988 | PPP1R16A | P54T-E | Human | Esophagus | ESCC | 1.68e-39 | 1.01e+00 | 0.0975 |
| 84988 | PPP1R16A | P56T-E | Human | Esophagus | ESCC | 2.21e-05 | 9.36e-01 | 0.1613 |
| 84988 | PPP1R16A | P57T-E | Human | Esophagus | ESCC | 7.19e-31 | 7.24e-01 | 0.0926 |
| 84988 | PPP1R16A | P61T-E | Human | Esophagus | ESCC | 1.58e-13 | 2.35e-01 | 0.099 |
| 84988 | PPP1R16A | P62T-E | Human | Esophagus | ESCC | 1.78e-45 | 8.73e-01 | 0.1302 |
| 84988 | PPP1R16A | P65T-E | Human | Esophagus | ESCC | 1.12e-20 | 4.76e-01 | 0.0978 |
| 84988 | PPP1R16A | P74T-E | Human | Esophagus | ESCC | 1.89e-60 | 1.43e+00 | 0.1479 |
| 84988 | PPP1R16A | P75T-E | Human | Esophagus | ESCC | 5.48e-44 | 8.34e-01 | 0.1125 |
| Page: 1 2 3 4 5 6 7 8 9 |
| Tissue | Expression Dynamics | Abbreviation |
| Colorectum (GSE201348) | 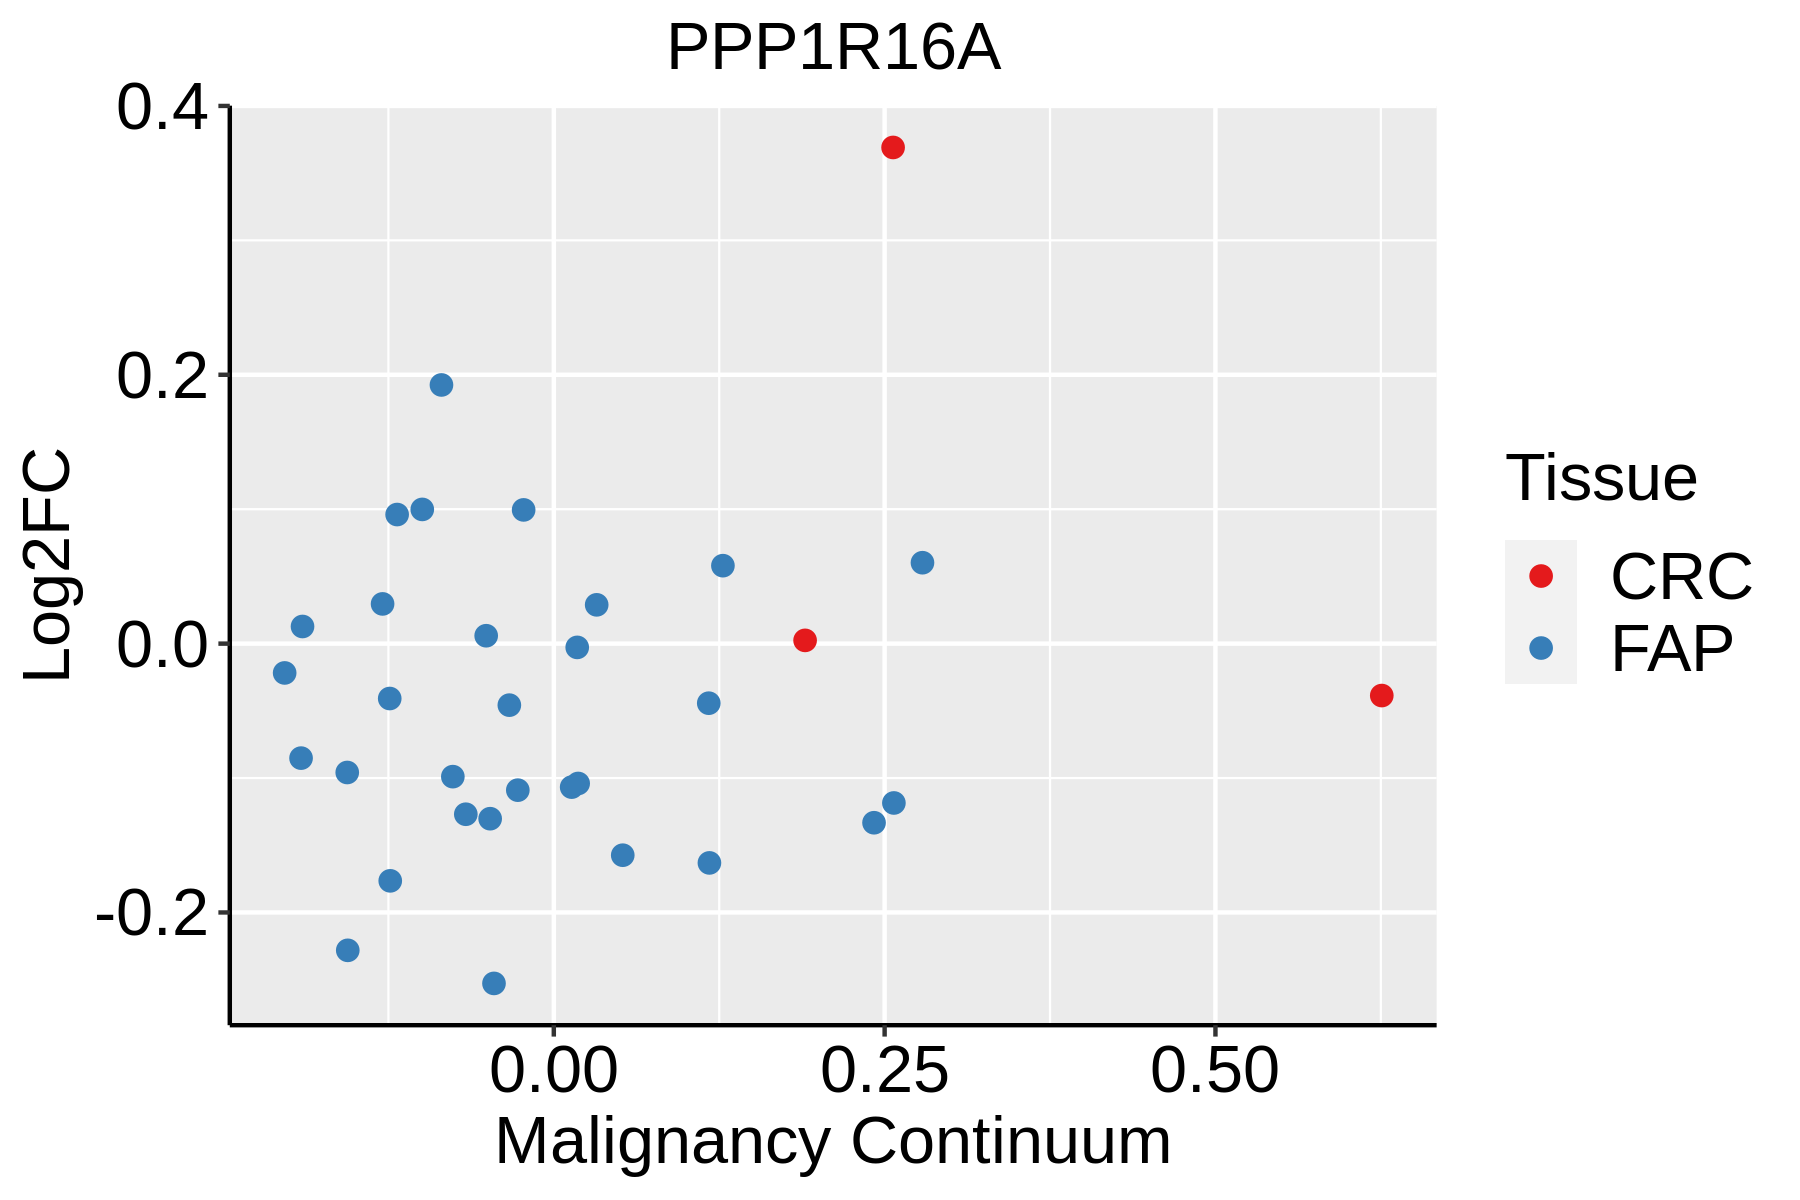 | FAP: Familial adenomatous polyposis |
| CRC: Colorectal cancer | ||
| Colorectum (HTA11) |  | AD: Adenomas |
| SER: Sessile serrated lesions | ||
| MSI-H: Microsatellite-high colorectal cancer | ||
| MSS: Microsatellite stable colorectal cancer | ||
| Esophagus | 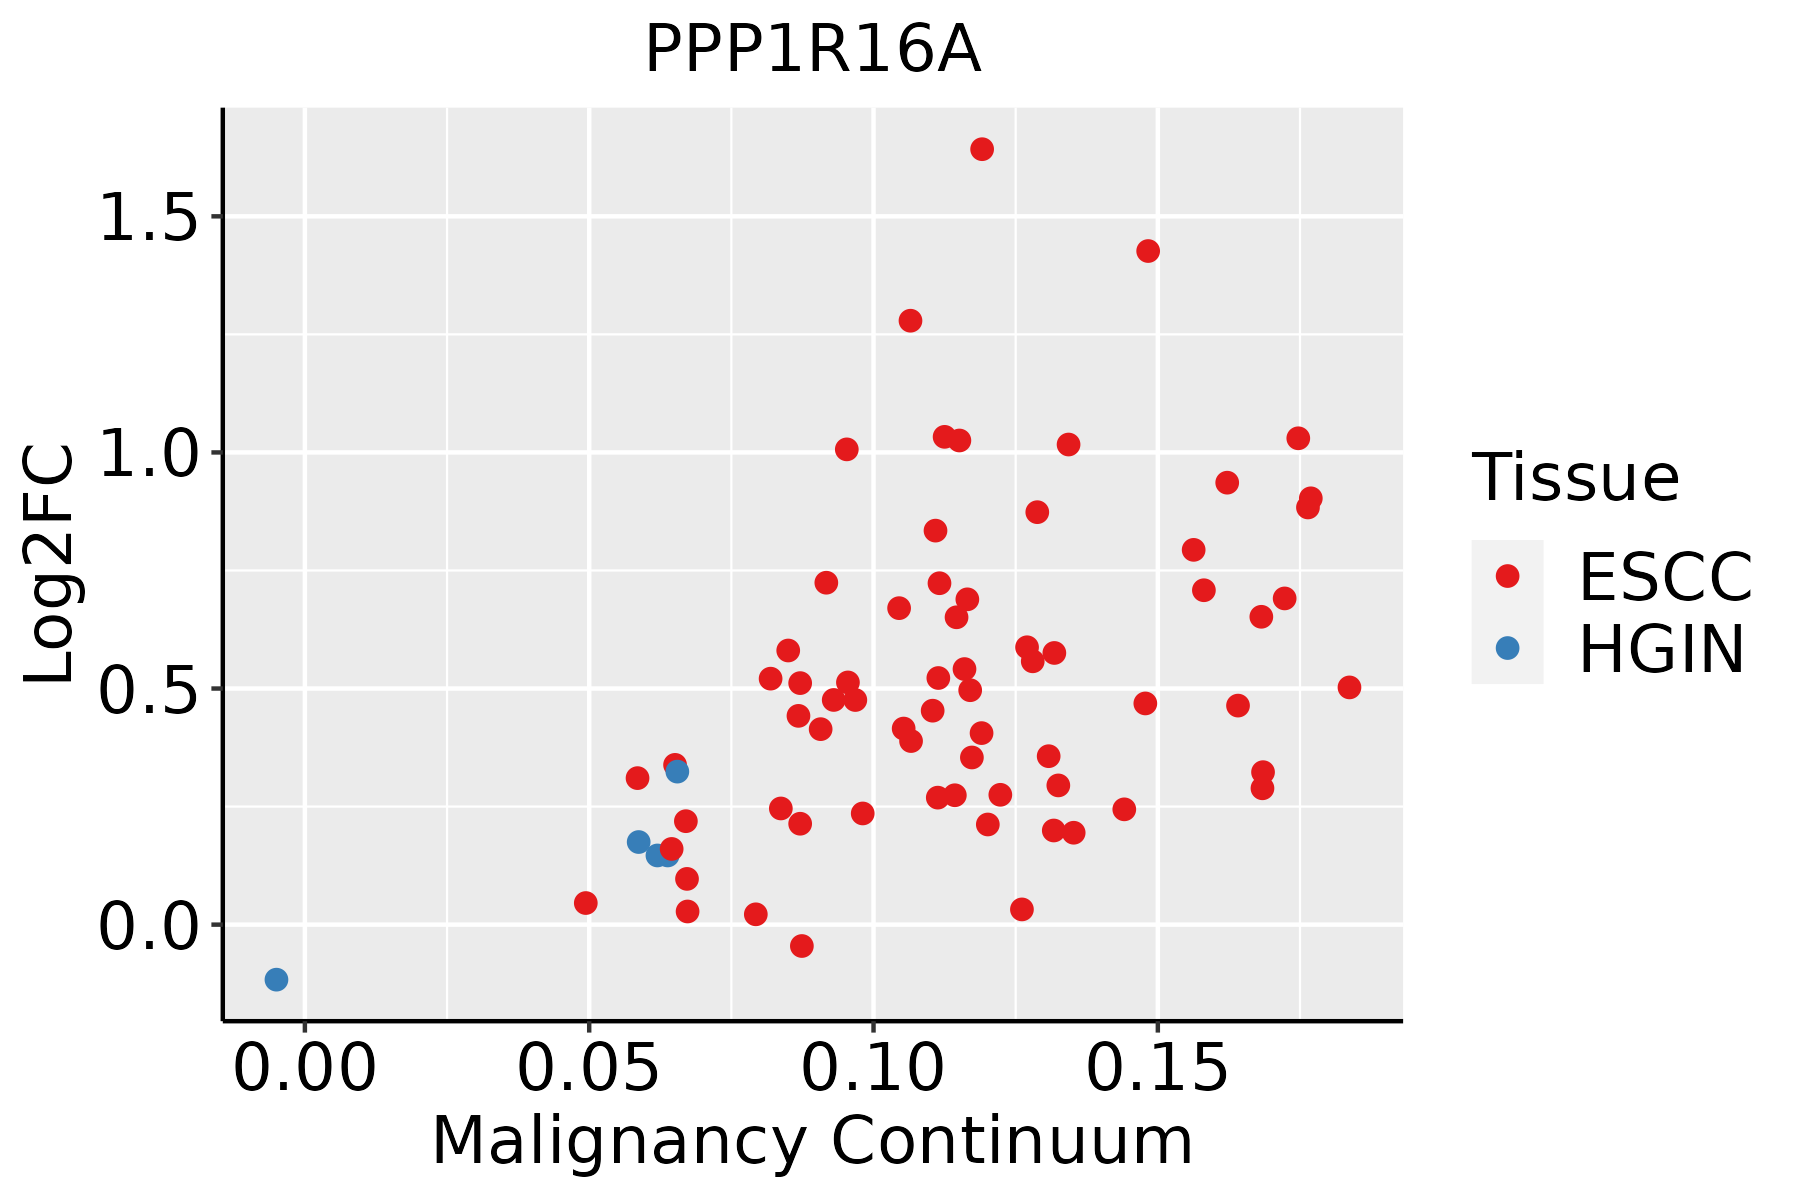 | ESCC: Esophageal squamous cell carcinoma |
| HGIN: High-grade intraepithelial neoplasias | ||
| LGIN: Low-grade intraepithelial neoplasias | ||
| GC |  | CAG: Chronic atrophic gastritis |
| CAG with IM: Chronic atrophic gastritis with intestinal metaplasia | ||
| CSG: Chronic superficial gastritis | ||
| GC: Gastric cancer | ||
| SIM: Severe intestinal metaplasia | ||
| WIM: Wild intestinal metaplasia | ||
| Liver | 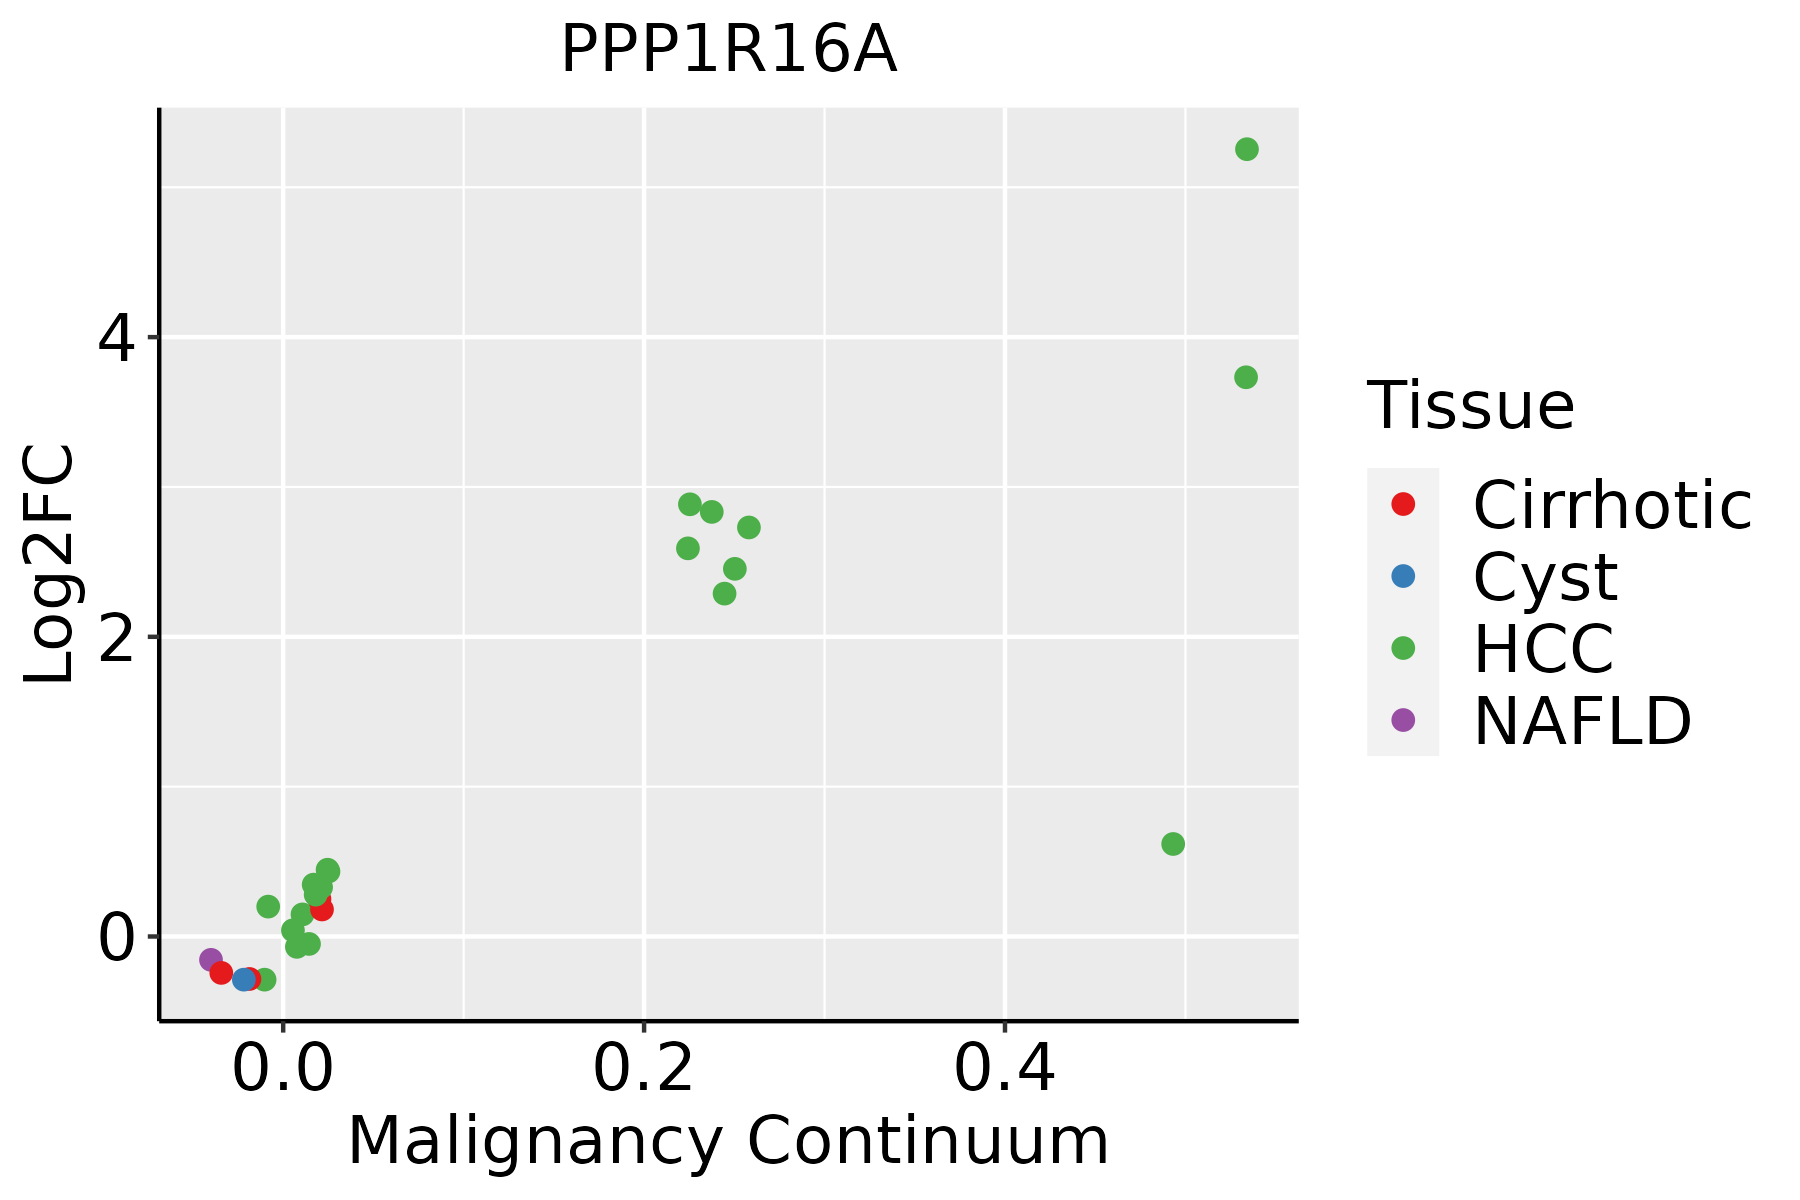 | HCC: Hepatocellular carcinoma |
| NAFLD: Non-alcoholic fatty liver disease | ||
| Oral Cavity |  | EOLP: Erosive Oral lichen planus |
| LP: leukoplakia | ||
| NEOLP: Non-erosive oral lichen planus | ||
| OSCC: Oral squamous cell carcinoma | ||
| Skin |  | AK: Actinic keratosis |
| cSCC: Cutaneous squamous cell carcinoma | ||
| SCCIS:squamous cell carcinoma in situ | ||
| Thyroid | 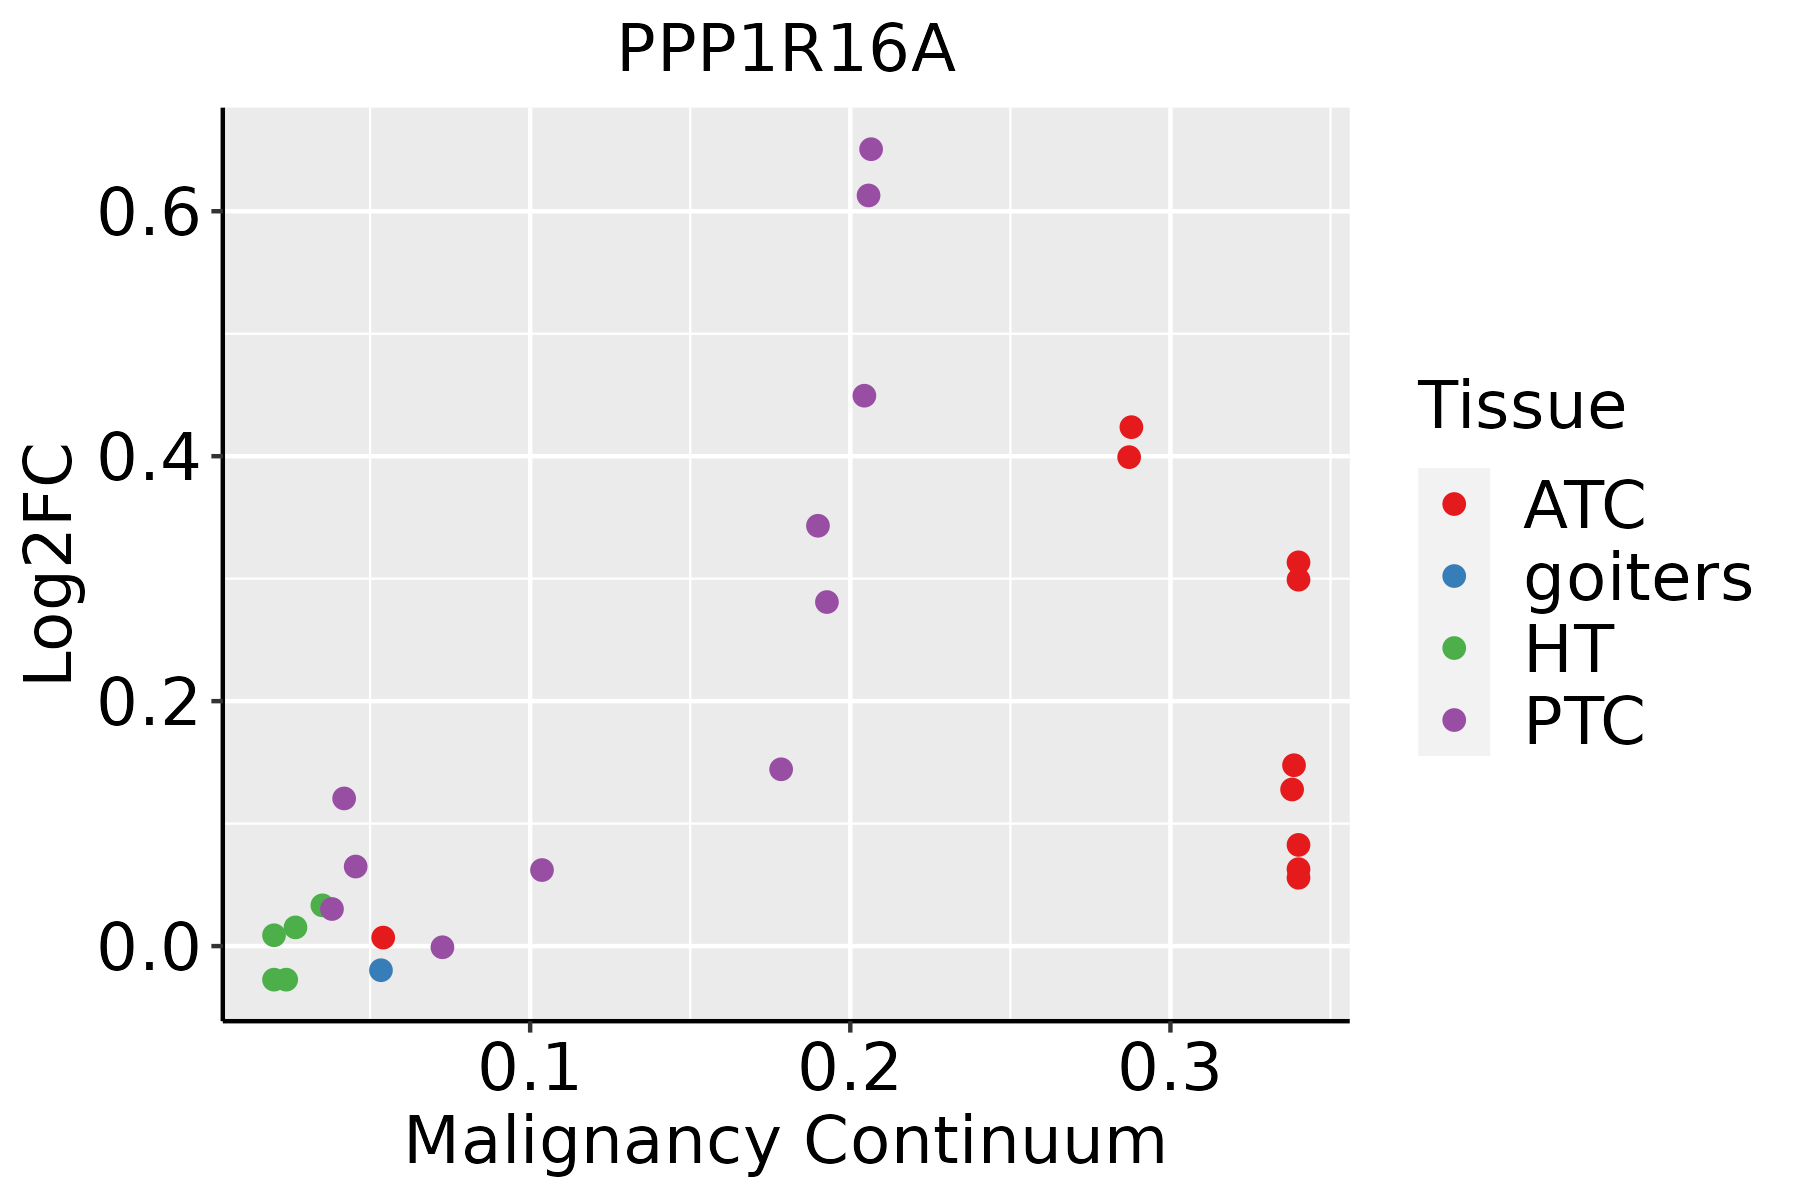 | ATC: Anaplastic thyroid cancer |
| HT: Hashimoto's thyroiditis | ||
| PTC: Papillary thyroid cancer |
| ∗log2FC in expression of this searched gene in stem-like cells from each diseased tissue sample relative to stem-like cells in normal samples in each tissue plotted against the malignancy continuum. Samples are colored based on if they are from different disease stage. |
Top |
Malignant transformation related pathway analysis |
| Find out the enriched GO biological processes and KEGG pathways involved in transition from healthy to precancer to cancer |
| Tissue | Disease Stage | Enriched GO biological Processes |
| Colorectum | AD |  |
| Colorectum | SER |  |
| Colorectum | MSS |  |
| Colorectum | MSI-H |  |
| Colorectum | FAP |  |
| ∗Top 15 enriched GO BP terms are showed in the bar plot of each disease state in each tissue. Each row represents a significant GO biological process which is colored according to the -log10(p.adjust). |
| Page: 1 2 3 4 5 6 7 8 9 |
| GO ID | Tissue | Disease Stage | Description | Gene Ratio | Bg Ratio | pvalue | p.adjust | Count |
| GO:0016311 | Colorectum | AD | dephosphorylation | 123/3918 | 417/18723 | 1.84e-05 | 3.82e-04 | 123 |
| GO:0006470 | Colorectum | AD | protein dephosphorylation | 88/3918 | 281/18723 | 2.56e-05 | 4.89e-04 | 88 |
| GO:0035303 | Colorectum | AD | regulation of dephosphorylation | 46/3918 | 128/18723 | 6.20e-05 | 1.04e-03 | 46 |
| GO:0035304 | Colorectum | AD | regulation of protein dephosphorylation | 33/3918 | 90/18723 | 4.23e-04 | 4.77e-03 | 33 |
| GO:00064701 | Colorectum | SER | protein dephosphorylation | 65/2897 | 281/18723 | 4.44e-04 | 6.51e-03 | 65 |
| GO:00353031 | Colorectum | SER | regulation of dephosphorylation | 33/2897 | 128/18723 | 1.71e-03 | 1.78e-02 | 33 |
| GO:00353041 | Colorectum | SER | regulation of protein dephosphorylation | 25/2897 | 90/18723 | 2.00e-03 | 1.98e-02 | 25 |
| GO:00163111 | Colorectum | SER | dephosphorylation | 86/2897 | 417/18723 | 2.73e-03 | 2.46e-02 | 86 |
| GO:00353032 | Colorectum | MSS | regulation of dephosphorylation | 41/3467 | 128/18723 | 1.64e-04 | 2.33e-03 | 41 |
| GO:00353042 | Colorectum | MSS | regulation of protein dephosphorylation | 30/3467 | 90/18723 | 5.58e-04 | 6.19e-03 | 30 |
| GO:00064702 | Colorectum | MSS | protein dephosphorylation | 73/3467 | 281/18723 | 1.15e-03 | 1.12e-02 | 73 |
| GO:00163112 | Colorectum | MSS | dephosphorylation | 101/3467 | 417/18723 | 1.98e-03 | 1.70e-02 | 101 |
| GO:00163113 | Colorectum | FAP | dephosphorylation | 95/2622 | 417/18723 | 7.07e-07 | 3.32e-05 | 95 |
| GO:00064704 | Colorectum | FAP | protein dephosphorylation | 69/2622 | 281/18723 | 1.47e-06 | 6.39e-05 | 69 |
| GO:00353034 | Colorectum | FAP | regulation of dephosphorylation | 36/2622 | 128/18723 | 2.22e-05 | 5.28e-04 | 36 |
| GO:00353044 | Colorectum | FAP | regulation of protein dephosphorylation | 24/2622 | 90/18723 | 1.12e-03 | 1.08e-02 | 24 |
| GO:00163114 | Colorectum | CRC | dephosphorylation | 79/2078 | 417/18723 | 1.27e-06 | 7.21e-05 | 79 |
| GO:00064705 | Colorectum | CRC | protein dephosphorylation | 57/2078 | 281/18723 | 4.49e-06 | 1.87e-04 | 57 |
| GO:00353035 | Colorectum | CRC | regulation of dephosphorylation | 30/2078 | 128/18723 | 5.27e-05 | 1.20e-03 | 30 |
| GO:00353045 | Colorectum | CRC | regulation of protein dephosphorylation | 20/2078 | 90/18723 | 1.77e-03 | 1.82e-02 | 20 |
| Page: 1 2 3 4 |
| Pathway ID | Tissue | Disease Stage | Description | Gene Ratio | Bg Ratio | pvalue | p.adjust | qvalue | Count |
| Page: 1 |
Top |
Cell-cell communication analysis |
| Identification of potential cell-cell interactions between two cell types and their ligand-receptor pairs for different disease states |
| Ligand | Receptor | LRpair | Pathway | Tissue | Disease Stage |
| Page: 1 |
Top |
Single-cell gene regulatory network inference analysis |
| Find out the significant the regulons (TFs) and the target genes of each regulon across cell types for different disease states |
| TF | Cell Type | Tissue | Disease Stage | Target Gene | RSS | Regulon Activity |
| ∗The dot plots of a searched regulon are shown for all cell subpopulations in each disease state of each tissue based on the regulon specific score inferred using pySCENIC and by calculating the average expression. |
| Page: 1 |
Top |
Somatic mutation of malignant transformation related genes |
| Annotation of somatic variants for genes involved in malignant transformation |
| Hugo Symbol | Variant Class | Variant Classification | dbSNP RS | HGVSc | HGVSp | HGVSp Short | SWISSPROT | BIOTYPE | SIFT | PolyPhen | Tumor Sample Barcode | Tissue | Histology | Sex | Age | Stage | Therapy Types | Drugs | Outcome |
| PPP1R16A | SNV | Missense_Mutation | c.1330N>G | p.Pro444Ala | p.P444A | Q96I34 | protein_coding | tolerated(0.27) | benign(0) | TCGA-IR-A3LK-01 | Cervix | cervical & endocervical cancer | Female | >=65 | I/II | Chemotherapy | cisplatin | PD | |
| PPP1R16A | SNV | Missense_Mutation | rs559264971 | c.1262G>A | p.Arg421Gln | p.R421Q | Q96I34 | protein_coding | tolerated(0.29) | benign(0.022) | TCGA-AZ-4615-01 | Colorectum | colon adenocarcinoma | Male | >=65 | III/IV | Chemotherapy | xeloda | PD |
| PPP1R16A | SNV | Missense_Mutation | c.1235N>G | p.Asn412Ser | p.N412S | Q96I34 | protein_coding | tolerated(0.24) | benign(0.021) | TCGA-D5-6529-01 | Colorectum | colon adenocarcinoma | Male | >=65 | I/II | Chemotherapy | oxaliplatinum+ | SD | |
| PPP1R16A | SNV | Missense_Mutation | novel | c.1367N>C | p.Leu456Pro | p.L456P | Q96I34 | protein_coding | deleterious(0) | probably_damaging(0.999) | TCGA-G4-6314-01 | Colorectum | colon adenocarcinoma | Female | >=65 | III/IV | Ancillary | leucovorin | SD |
| PPP1R16A | deletion | Frame_Shift_Del | rs777096925 | c.1328delN | p.His445ThrfsTer15 | p.H445Tfs*15 | Q96I34 | protein_coding | TCGA-AY-6197-01 | Colorectum | colon adenocarcinoma | Male | <65 | I/II | Unknown | Unknown | SD | ||
| PPP1R16A | deletion | Frame_Shift_Del | rs777096925 | c.1328delN | p.His445ThrfsTer15 | p.H445Tfs*15 | Q96I34 | protein_coding | TCGA-CM-4743-01 | Colorectum | colon adenocarcinoma | Male | >=65 | I/II | Chemotherapy | capecitabine | SD | ||
| PPP1R16A | SNV | Missense_Mutation | novel | c.260T>C | p.Val87Ala | p.V87A | Q96I34 | protein_coding | deleterious(0) | probably_damaging(0.968) | TCGA-A5-A1OF-01 | Endometrium | uterine corpus endometrioid carcinoma | Female | <65 | I/II | Unknown | Unknown | SD |
| PPP1R16A | SNV | Missense_Mutation | novel | c.601N>A | p.Glu201Lys | p.E201K | Q96I34 | protein_coding | deleterious(0.04) | possibly_damaging(0.788) | TCGA-AJ-A3EL-01 | Endometrium | uterine corpus endometrioid carcinoma | Female | <65 | I/II | Unknown | Unknown | SD |
| PPP1R16A | SNV | Missense_Mutation | rs759928158 | c.1507N>A | p.Gly503Arg | p.G503R | Q96I34 | protein_coding | deleterious(0.01) | possibly_damaging(0.486) | TCGA-D1-A3DA-01 | Endometrium | uterine corpus endometrioid carcinoma | Female | >=65 | III/IV | Chemotherapy | carboplatin | CR |
| PPP1R16A | SNV | Missense_Mutation | rs754557567 | c.629N>A | p.Arg210His | p.R210H | Q96I34 | protein_coding | tolerated(0.55) | benign(0.009) | TCGA-DF-A2KU-01 | Endometrium | uterine corpus endometrioid carcinoma | Female | Unknown | I/II | Unknown | Unknown | SD |
| Page: 1 2 3 4 |
Top |
Related drugs of malignant transformation related genes |
| Identification of chemicals and drugs interact with genes involved in malignant transfromation |
| (DGIdb 4.0) |
| Entrez ID | Symbol | Category | Interaction Types | Drug Claim Name | Drug Name | PMIDs |
| Page: 1 |

Copyright 2023-Present -The University of Texas Health Science Center at Houston |