
|
|||||
|
 | |
| |
| |
| |
| |
| |
|
Gene: POLRMT |
Gene summary for POLRMT |
| Gene information | Species | Human | Gene symbol | POLRMT | Gene ID | 5442 |
| Gene name | RNA polymerase mitochondrial | |
| Gene Alias | APOLMT | |
| Cytomap | 19p13.3 | |
| Gene Type | protein-coding | GO ID | GO:0000959 | UniProtAcc | O00411 |
Top |
Malignant transformation analysis |
| Identification of the aberrant gene expression in precancerous and cancerous lesions by comparing the gene expression of stem-like cells in diseased tissues with normal stem cells |
| Entrez ID | Symbol | Replicates | Species | Organ | Tissue | Adj P-value | Log2FC | Malignancy |
| 5442 | POLRMT | P61T-E | Human | Esophagus | ESCC | 9.26e-15 | 2.93e-01 | 0.099 |
| 5442 | POLRMT | P62T-E | Human | Esophagus | ESCC | 2.46e-24 | 3.67e-01 | 0.1302 |
| 5442 | POLRMT | P65T-E | Human | Esophagus | ESCC | 6.43e-06 | 1.12e-01 | 0.0978 |
| 5442 | POLRMT | P74T-E | Human | Esophagus | ESCC | 3.81e-05 | 1.36e-01 | 0.1479 |
| 5442 | POLRMT | P75T-E | Human | Esophagus | ESCC | 3.60e-13 | 2.08e-01 | 0.1125 |
| 5442 | POLRMT | P76T-E | Human | Esophagus | ESCC | 7.90e-03 | 7.06e-02 | 0.1207 |
| 5442 | POLRMT | P80T-E | Human | Esophagus | ESCC | 5.57e-10 | 2.68e-01 | 0.155 |
| 5442 | POLRMT | P83T-E | Human | Esophagus | ESCC | 1.56e-24 | 5.55e-01 | 0.1738 |
| 5442 | POLRMT | P89T-E | Human | Esophagus | ESCC | 6.02e-08 | 4.26e-01 | 0.1752 |
| 5442 | POLRMT | P91T-E | Human | Esophagus | ESCC | 1.76e-08 | 5.85e-01 | 0.1828 |
| 5442 | POLRMT | P94T-E | Human | Esophagus | ESCC | 2.96e-04 | 4.61e-01 | 0.0879 |
| 5442 | POLRMT | P104T-E | Human | Esophagus | ESCC | 9.44e-05 | 2.29e-01 | 0.0931 |
| 5442 | POLRMT | P107T-E | Human | Esophagus | ESCC | 3.64e-18 | 3.35e-01 | 0.171 |
| 5442 | POLRMT | P126T-E | Human | Esophagus | ESCC | 4.04e-08 | 3.91e-01 | 0.1125 |
| 5442 | POLRMT | P127T-E | Human | Esophagus | ESCC | 3.92e-07 | 1.31e-01 | 0.0826 |
| 5442 | POLRMT | P128T-E | Human | Esophagus | ESCC | 2.93e-10 | 3.08e-01 | 0.1241 |
| 5442 | POLRMT | P130T-E | Human | Esophagus | ESCC | 2.27e-21 | 3.62e-01 | 0.1676 |
| 5442 | POLRMT | HCC1_Meng | Human | Liver | HCC | 1.05e-18 | -7.62e-03 | 0.0246 |
| 5442 | POLRMT | HCC2_Meng | Human | Liver | HCC | 4.16e-09 | 6.60e-02 | 0.0107 |
| 5442 | POLRMT | HCC2 | Human | Liver | HCC | 1.03e-07 | 3.52e+00 | 0.5341 |
| Page: 1 2 3 4 |
| Tissue | Expression Dynamics | Abbreviation |
| Esophagus | 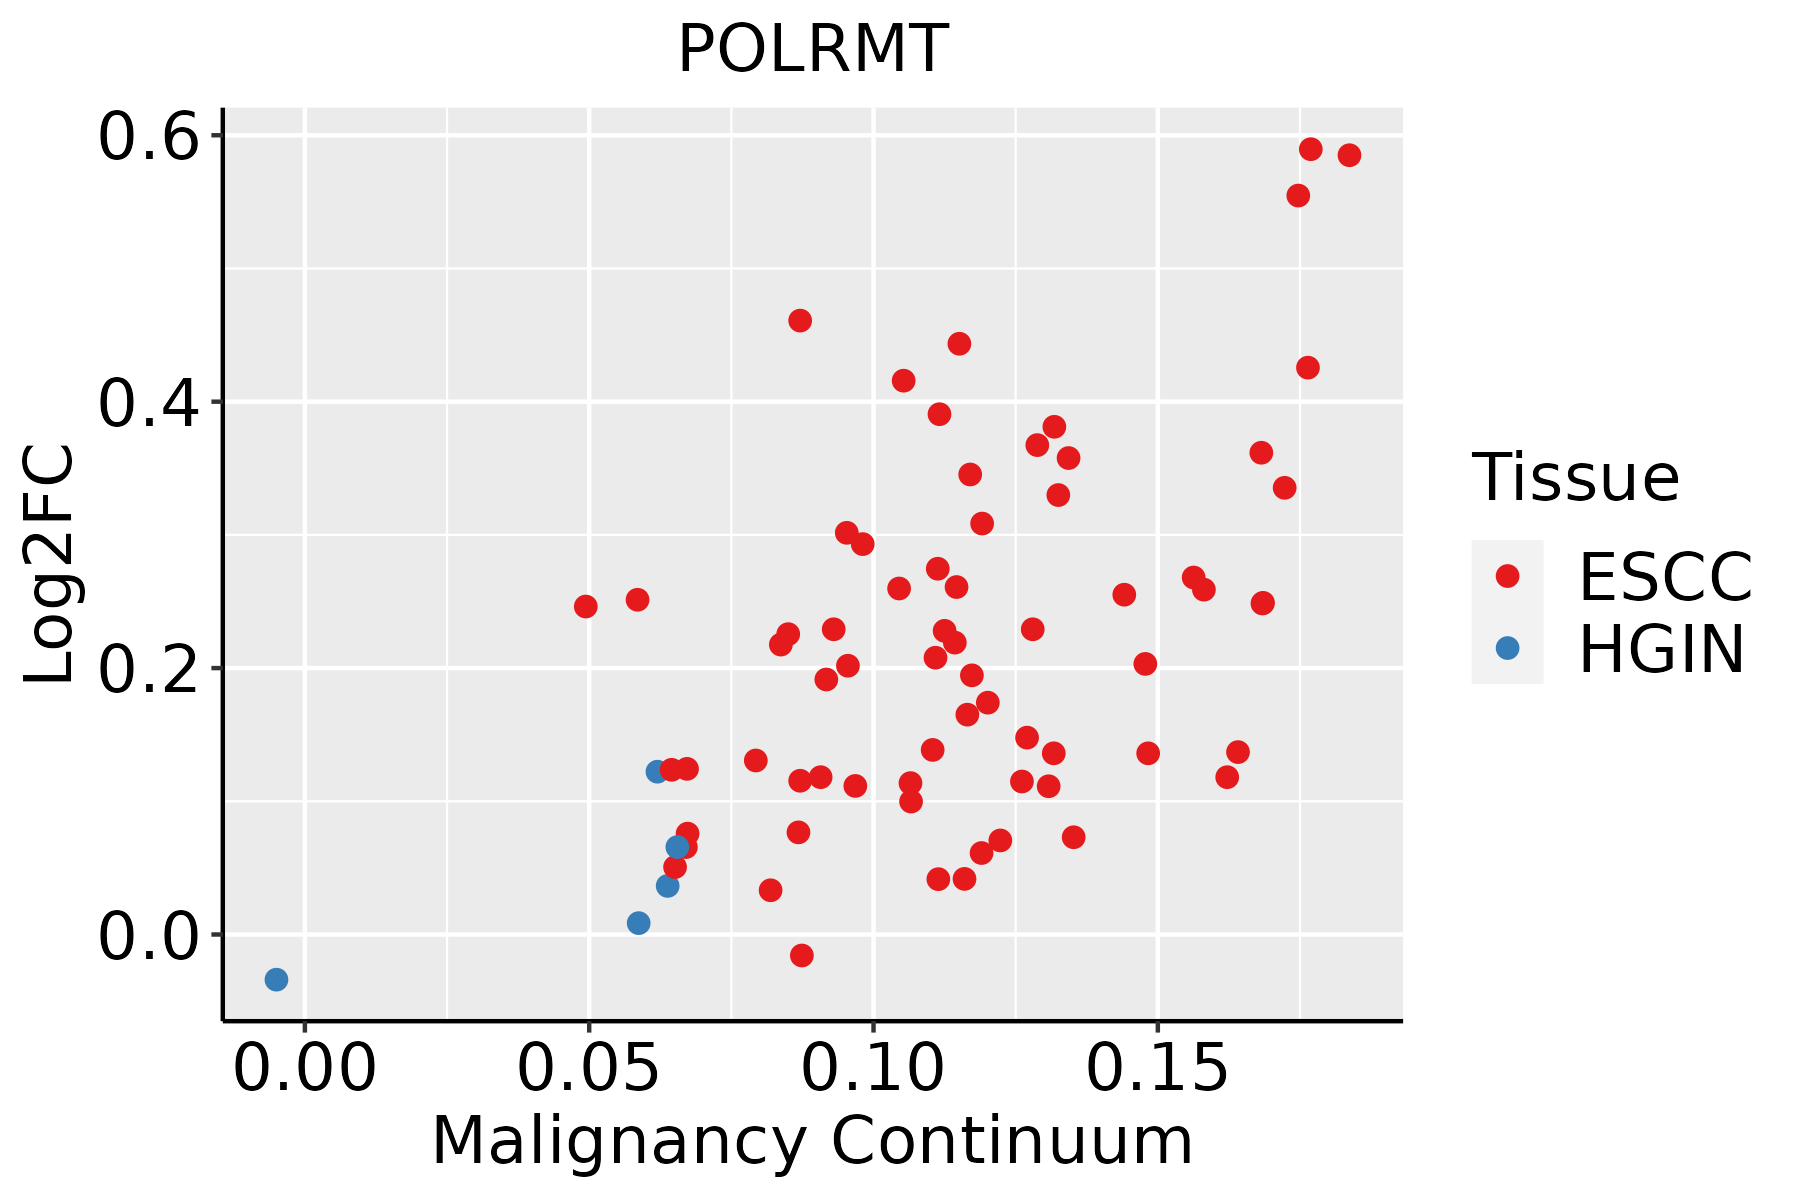 | ESCC: Esophageal squamous cell carcinoma |
| HGIN: High-grade intraepithelial neoplasias | ||
| LGIN: Low-grade intraepithelial neoplasias | ||
| Liver | 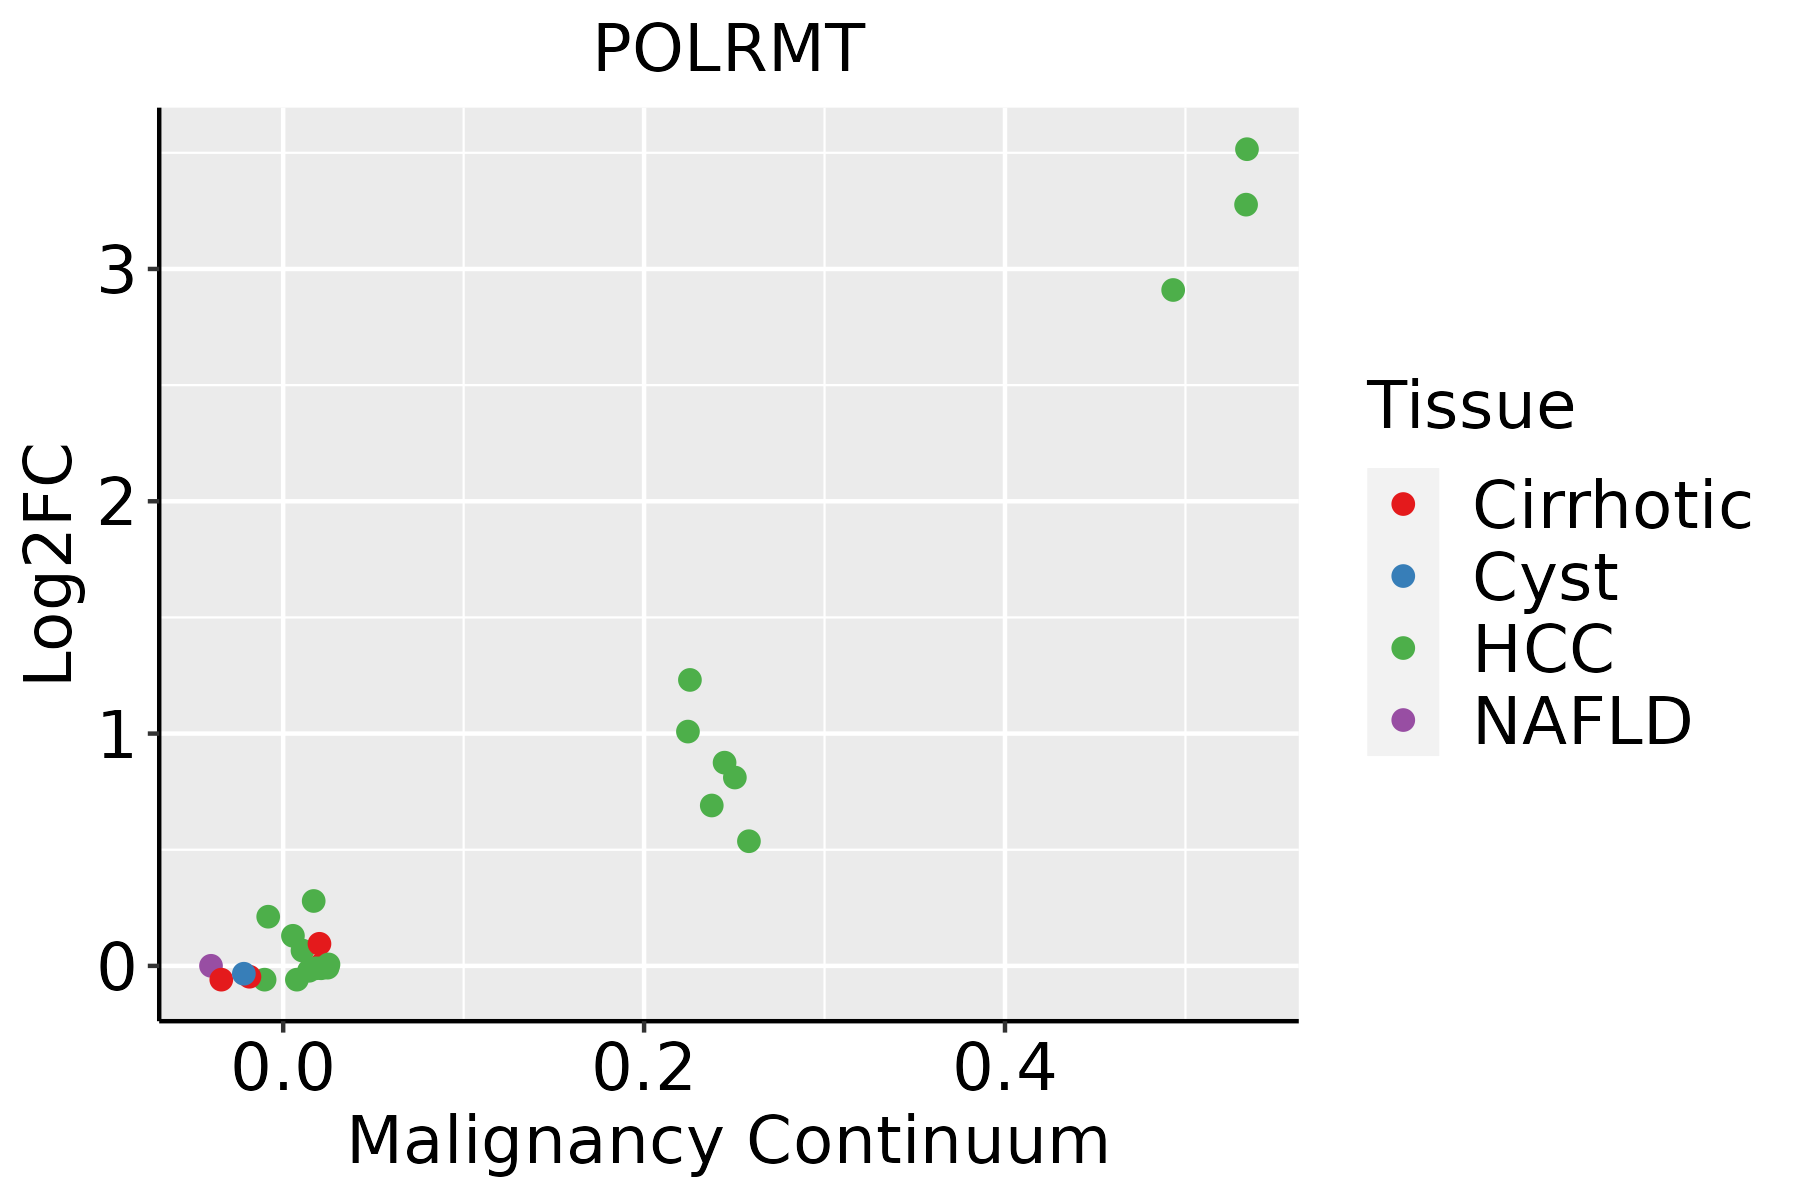 | HCC: Hepatocellular carcinoma |
| NAFLD: Non-alcoholic fatty liver disease | ||
| Thyroid | 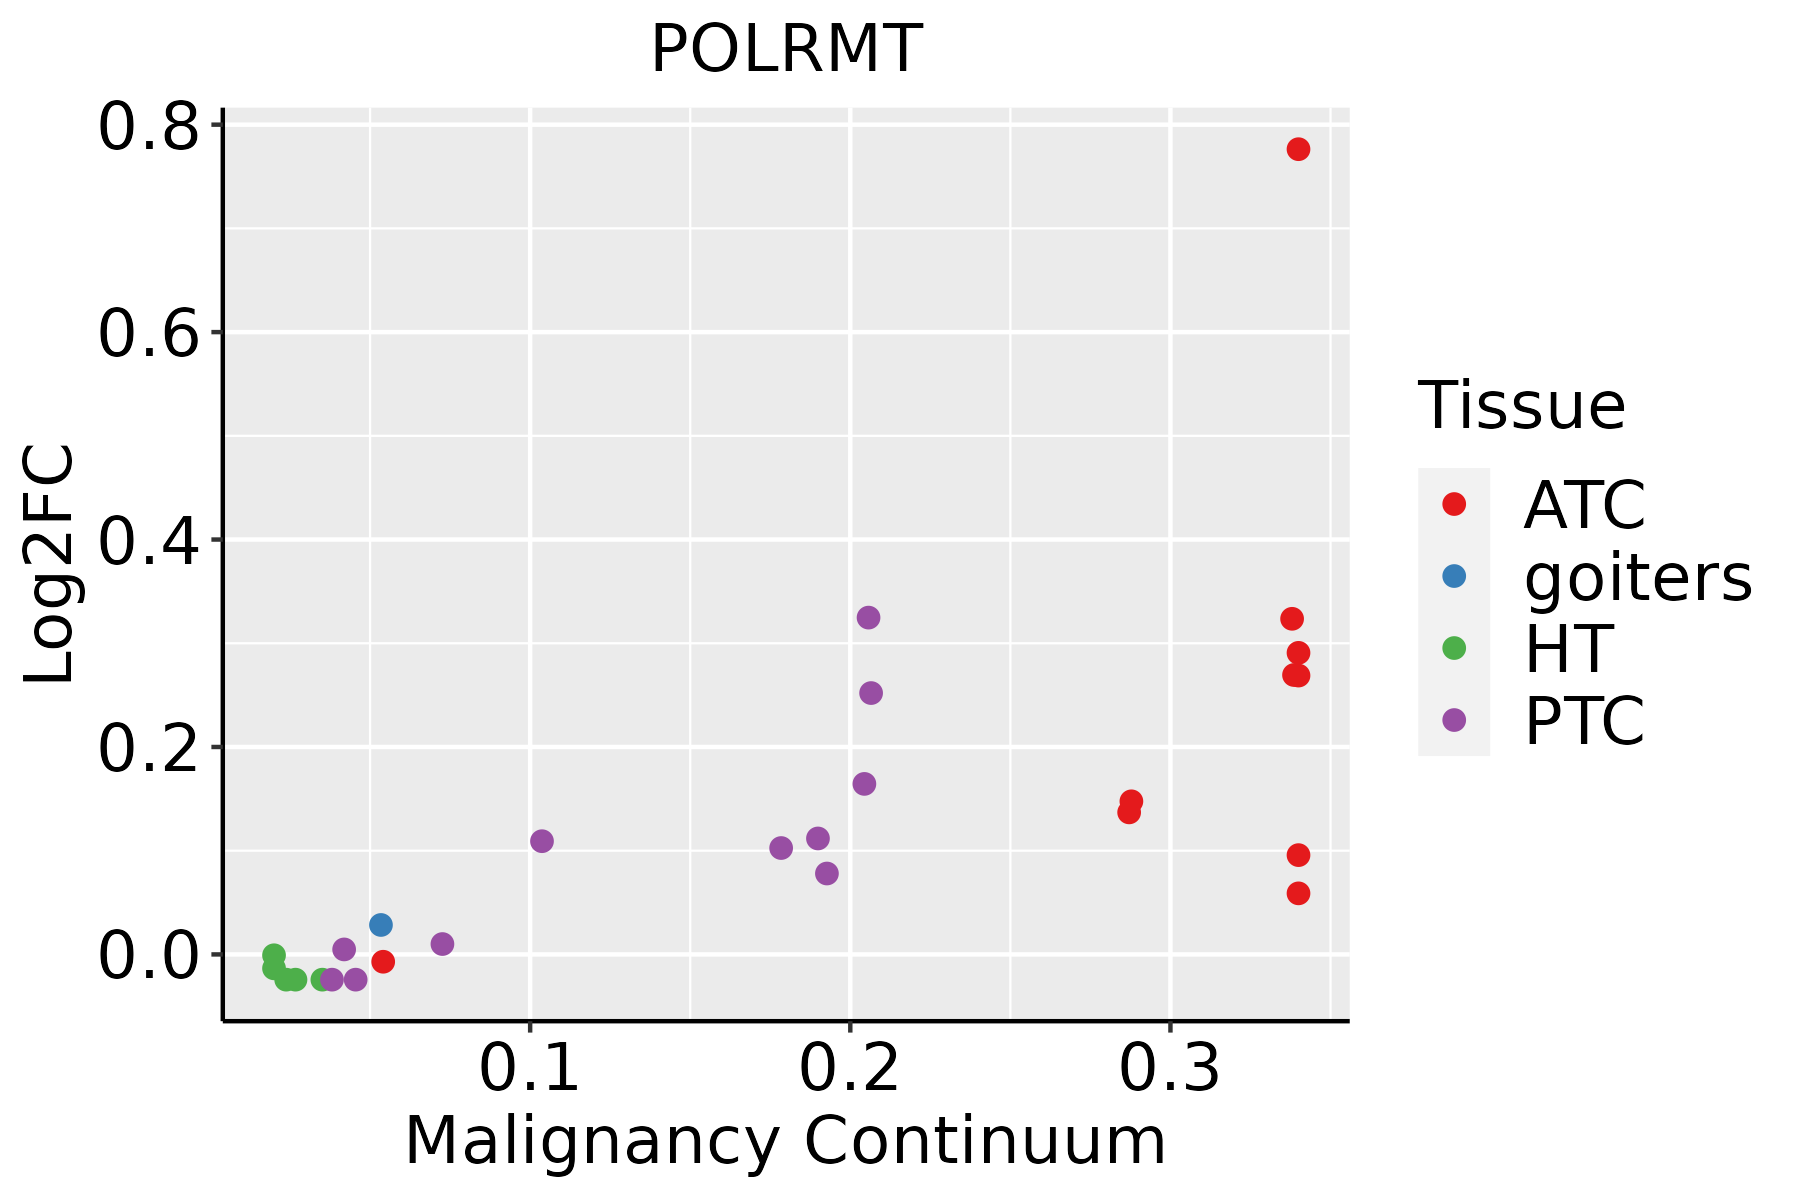 | ATC: Anaplastic thyroid cancer |
| HT: Hashimoto's thyroiditis | ||
| PTC: Papillary thyroid cancer |
| ∗log2FC in expression of this searched gene in stem-like cells from each diseased tissue sample relative to stem-like cells in normal samples in each tissue plotted against the malignancy continuum. Samples are colored based on if they are from different disease stage. |
Top |
Malignant transformation related pathway analysis |
| Find out the enriched GO biological processes and KEGG pathways involved in transition from healthy to precancer to cancer |
| Tissue | Disease Stage | Enriched GO biological Processes |
| Colorectum | AD |  |
| Colorectum | SER |  |
| Colorectum | MSS |  |
| Colorectum | MSI-H |  |
| Colorectum | FAP |  |
| ∗Top 15 enriched GO BP terms are showed in the bar plot of each disease state in each tissue. Each row represents a significant GO biological process which is colored according to the -log10(p.adjust). |
| Page: 1 2 3 4 5 6 7 8 9 |
| GO ID | Tissue | Disease Stage | Description | Gene Ratio | Bg Ratio | pvalue | p.adjust | Count |
| GO:014005313 | Esophagus | ESCC | mitochondrial gene expression | 93/8552 | 108/18723 | 1.96e-18 | 2.03e-16 | 93 |
| GO:00009592 | Esophagus | ESCC | mitochondrial RNA metabolic process | 39/8552 | 49/18723 | 1.20e-06 | 1.49e-05 | 39 |
| GO:01400531 | Liver | HCC | mitochondrial gene expression | 82/7958 | 108/18723 | 1.49e-12 | 7.20e-11 | 82 |
| GO:0000959 | Liver | HCC | mitochondrial RNA metabolic process | 30/7958 | 49/18723 | 6.31e-03 | 2.57e-02 | 30 |
| GO:01400536 | Thyroid | PTC | mitochondrial gene expression | 51/5968 | 108/18723 | 6.04e-04 | 3.83e-03 | 51 |
| GO:014005314 | Thyroid | ATC | mitochondrial gene expression | 51/6293 | 108/18723 | 2.26e-03 | 1.06e-02 | 51 |
| Page: 1 |
| Pathway ID | Tissue | Disease Stage | Description | Gene Ratio | Bg Ratio | pvalue | p.adjust | qvalue | Count |
| Page: 1 |
Top |
Cell-cell communication analysis |
| Identification of potential cell-cell interactions between two cell types and their ligand-receptor pairs for different disease states |
| Ligand | Receptor | LRpair | Pathway | Tissue | Disease Stage |
| Page: 1 |
Top |
Single-cell gene regulatory network inference analysis |
| Find out the significant the regulons (TFs) and the target genes of each regulon across cell types for different disease states |
| TF | Cell Type | Tissue | Disease Stage | Target Gene | RSS | Regulon Activity |
| ∗The dot plots of a searched regulon are shown for all cell subpopulations in each disease state of each tissue based on the regulon specific score inferred using pySCENIC and by calculating the average expression. |
| Page: 1 |
Top |
Somatic mutation of malignant transformation related genes |
| Annotation of somatic variants for genes involved in malignant transformation |
| Hugo Symbol | Variant Class | Variant Classification | dbSNP RS | HGVSc | HGVSp | HGVSp Short | SWISSPROT | BIOTYPE | SIFT | PolyPhen | Tumor Sample Barcode | Tissue | Histology | Sex | Age | Stage | Therapy Types | Drugs | Outcome |
| POLRMT | SNV | Missense_Mutation | novel | c.722N>A | p.Leu241His | p.L241H | O00411 | protein_coding | tolerated(0.13) | probably_damaging(0.921) | TCGA-A7-A2KD-01 | Breast | breast invasive carcinoma | Female | <65 | III/IV | Chemotherapy | cytoxan | SD |
| POLRMT | SNV | Missense_Mutation | c.3281N>T | p.Gly1094Val | p.G1094V | O00411 | protein_coding | deleterious(0.01) | possibly_damaging(0.579) | TCGA-AC-A23H-01 | Breast | breast invasive carcinoma | Female | >=65 | I/II | Unknown | Unknown | PD | |
| POLRMT | SNV | Missense_Mutation | novel | c.226G>A | p.Glu76Lys | p.E76K | O00411 | protein_coding | tolerated(0.09) | benign(0.24) | TCGA-AC-A5XS-01 | Breast | breast invasive carcinoma | Female | >=65 | I/II | Hormone Therapy | femara | SD |
| POLRMT | SNV | Missense_Mutation | novel | c.2681N>G | p.Thr894Arg | p.T894R | O00411 | protein_coding | deleterious(0) | probably_damaging(0.993) | TCGA-AC-A6IW-01 | Breast | breast invasive carcinoma | Female | >=65 | I/II | Unknown | Unknown | SD |
| POLRMT | SNV | Missense_Mutation | rs771810687 | c.3310N>A | p.Gly1104Arg | p.G1104R | O00411 | protein_coding | tolerated(0.35) | benign(0.153) | TCGA-AR-A2LE-01 | Breast | breast invasive carcinoma | Female | >=65 | I/II | Hormone Therapy | tamoxiphen | PD |
| POLRMT | SNV | Missense_Mutation | c.503N>A | p.Ser168Asn | p.S168N | O00411 | protein_coding | tolerated(0.41) | benign(0) | TCGA-BH-A18G-01 | Breast | breast invasive carcinoma | Female | >=65 | I/II | Unknown | Unknown | SD | |
| POLRMT | SNV | Missense_Mutation | novel | c.2092N>A | p.Ala698Thr | p.A698T | O00411 | protein_coding | tolerated(0.23) | benign(0.124) | TCGA-2W-A8YY-01 | Cervix | cervical & endocervical cancer | Female | <65 | I/II | Chemotherapy | cisplatin | CR |
| POLRMT | SNV | Missense_Mutation | c.2542N>G | p.Leu848Val | p.L848V | O00411 | protein_coding | deleterious(0) | probably_damaging(0.98) | TCGA-DR-A0ZM-01 | Cervix | cervical & endocervical cancer | Female | <65 | III/IV | Unspecific | Cisplatin | SD | |
| POLRMT | SNV | Missense_Mutation | c.324N>C | p.Gln108His | p.Q108H | O00411 | protein_coding | deleterious(0.04) | benign(0) | TCGA-DR-A0ZM-01 | Cervix | cervical & endocervical cancer | Female | <65 | III/IV | Unspecific | Cisplatin | SD | |
| POLRMT | SNV | Missense_Mutation | novel | c.2903G>T | p.Arg968Met | p.R968M | O00411 | protein_coding | deleterious(0.05) | benign(0.145) | TCGA-EA-A410-01 | Cervix | cervical & endocervical cancer | Female | <65 | I/II | Unknown | Unknown | SD |
| Page: 1 2 3 4 5 6 7 8 9 10 11 12 |
Top |
Related drugs of malignant transformation related genes |
| Identification of chemicals and drugs interact with genes involved in malignant transfromation |
| (DGIdb 4.0) |
| Entrez ID | Symbol | Category | Interaction Types | Drug Claim Name | Drug Name | PMIDs |
| 5442 | POLRMT | NA | 2',2'-DIFLUORODEOXYCYTIDINE 5'-TRIPHOSPHATE | 2',2'-DIFLUORODEOXYCYTIDINE 5'-TRIPHOSPHATE | 25667954 |
| Page: 1 |

Copyright 2023-Present -The University of Texas Health Science Center at Houston |