
|
|||||
|
 | |
| |
| |
| |
| |
| |
|
Gene: POLR2I |
Gene summary for POLR2I |
| Gene information | Species | Human | Gene symbol | POLR2I | Gene ID | 5438 |
| Gene name | RNA polymerase II subunit I | |
| Gene Alias | RPB9 | |
| Cytomap | 19q13.12 | |
| Gene Type | protein-coding | GO ID | GO:0001192 | UniProtAcc | P36954 |
Top |
Malignant transformation analysis |
| Identification of the aberrant gene expression in precancerous and cancerous lesions by comparing the gene expression of stem-like cells in diseased tissues with normal stem cells |
| Entrez ID | Symbol | Replicates | Species | Organ | Tissue | Adj P-value | Log2FC | Malignancy |
| 5438 | POLR2I | AEH-subject3 | Human | Endometrium | AEH | 4.79e-20 | -3.90e-01 | -0.2576 |
| 5438 | POLR2I | AEH-subject4 | Human | Endometrium | AEH | 1.50e-11 | -4.52e-01 | -0.2657 |
| 5438 | POLR2I | AEH-subject5 | Human | Endometrium | AEH | 1.12e-11 | -3.97e-01 | -0.2953 |
| 5438 | POLR2I | EEC-subject1 | Human | Endometrium | EEC | 4.25e-18 | -4.74e-01 | -0.2682 |
| 5438 | POLR2I | EEC-subject2 | Human | Endometrium | EEC | 2.86e-11 | -3.68e-01 | -0.2607 |
| 5438 | POLR2I | EEC-subject3 | Human | Endometrium | EEC | 1.26e-57 | -5.78e-01 | -0.2525 |
| 5438 | POLR2I | EEC-subject4 | Human | Endometrium | EEC | 1.58e-12 | -3.91e-01 | -0.2571 |
| 5438 | POLR2I | EEC-subject5 | Human | Endometrium | EEC | 8.04e-14 | -3.86e-01 | -0.249 |
| 5438 | POLR2I | GSM5276934 | Human | Endometrium | EEC | 1.07e-26 | -5.34e-01 | -0.0913 |
| 5438 | POLR2I | GSM5276937 | Human | Endometrium | EEC | 1.21e-14 | -4.97e-01 | -0.0897 |
| 5438 | POLR2I | GSM6177620_NYU_UCEC1_lib1_lib1 | Human | Endometrium | EEC | 3.73e-34 | -5.76e-01 | -0.1869 |
| 5438 | POLR2I | GSM6177620_NYU_UCEC1_lib2_lib2 | Human | Endometrium | EEC | 7.47e-33 | -6.27e-01 | -0.1875 |
| 5438 | POLR2I | GSM6177620_NYU_UCEC1_lib3_lib3 | Human | Endometrium | EEC | 3.02e-32 | -5.14e-01 | -0.1883 |
| 5438 | POLR2I | GSM6177621_NYU_UCEC2_lib1_lib1 | Human | Endometrium | EEC | 6.20e-33 | -3.99e-01 | -0.1934 |
| 5438 | POLR2I | GSM6177622_NYU_UCEC3_lib1_lib1 | Human | Endometrium | EEC | 1.18e-49 | -4.93e-01 | -0.1917 |
| 5438 | POLR2I | GSM6177622_NYU_UCEC3_lib2_lib2 | Human | Endometrium | EEC | 1.17e-47 | -4.66e-01 | -0.1916 |
| 5438 | POLR2I | GSM6177623_NYU_UCEC3_Vis | Human | Endometrium | EEC | 1.17e-08 | -1.76e-01 | -0.1269 |
| 5438 | POLR2I | LZE2T | Human | Esophagus | ESCC | 3.02e-05 | 9.36e-01 | 0.082 |
| 5438 | POLR2I | LZE4T | Human | Esophagus | ESCC | 1.03e-14 | 5.96e-01 | 0.0811 |
| 5438 | POLR2I | LZE5T | Human | Esophagus | ESCC | 2.71e-06 | 1.03e+00 | 0.0514 |
| Page: 1 2 3 4 5 6 7 8 9 10 11 |
| Tissue | Expression Dynamics | Abbreviation |
| Cervix |  | CC: Cervix cancer |
| HSIL_HPV: HPV-infected high-grade squamous intraepithelial lesions | ||
| N_HPV: HPV-infected normal cervix | ||
| Colorectum (GSE201348) |  | FAP: Familial adenomatous polyposis |
| CRC: Colorectal cancer | ||
| Colorectum (HTA11) |  | AD: Adenomas |
| SER: Sessile serrated lesions | ||
| MSI-H: Microsatellite-high colorectal cancer | ||
| MSS: Microsatellite stable colorectal cancer | ||
| Endometrium | 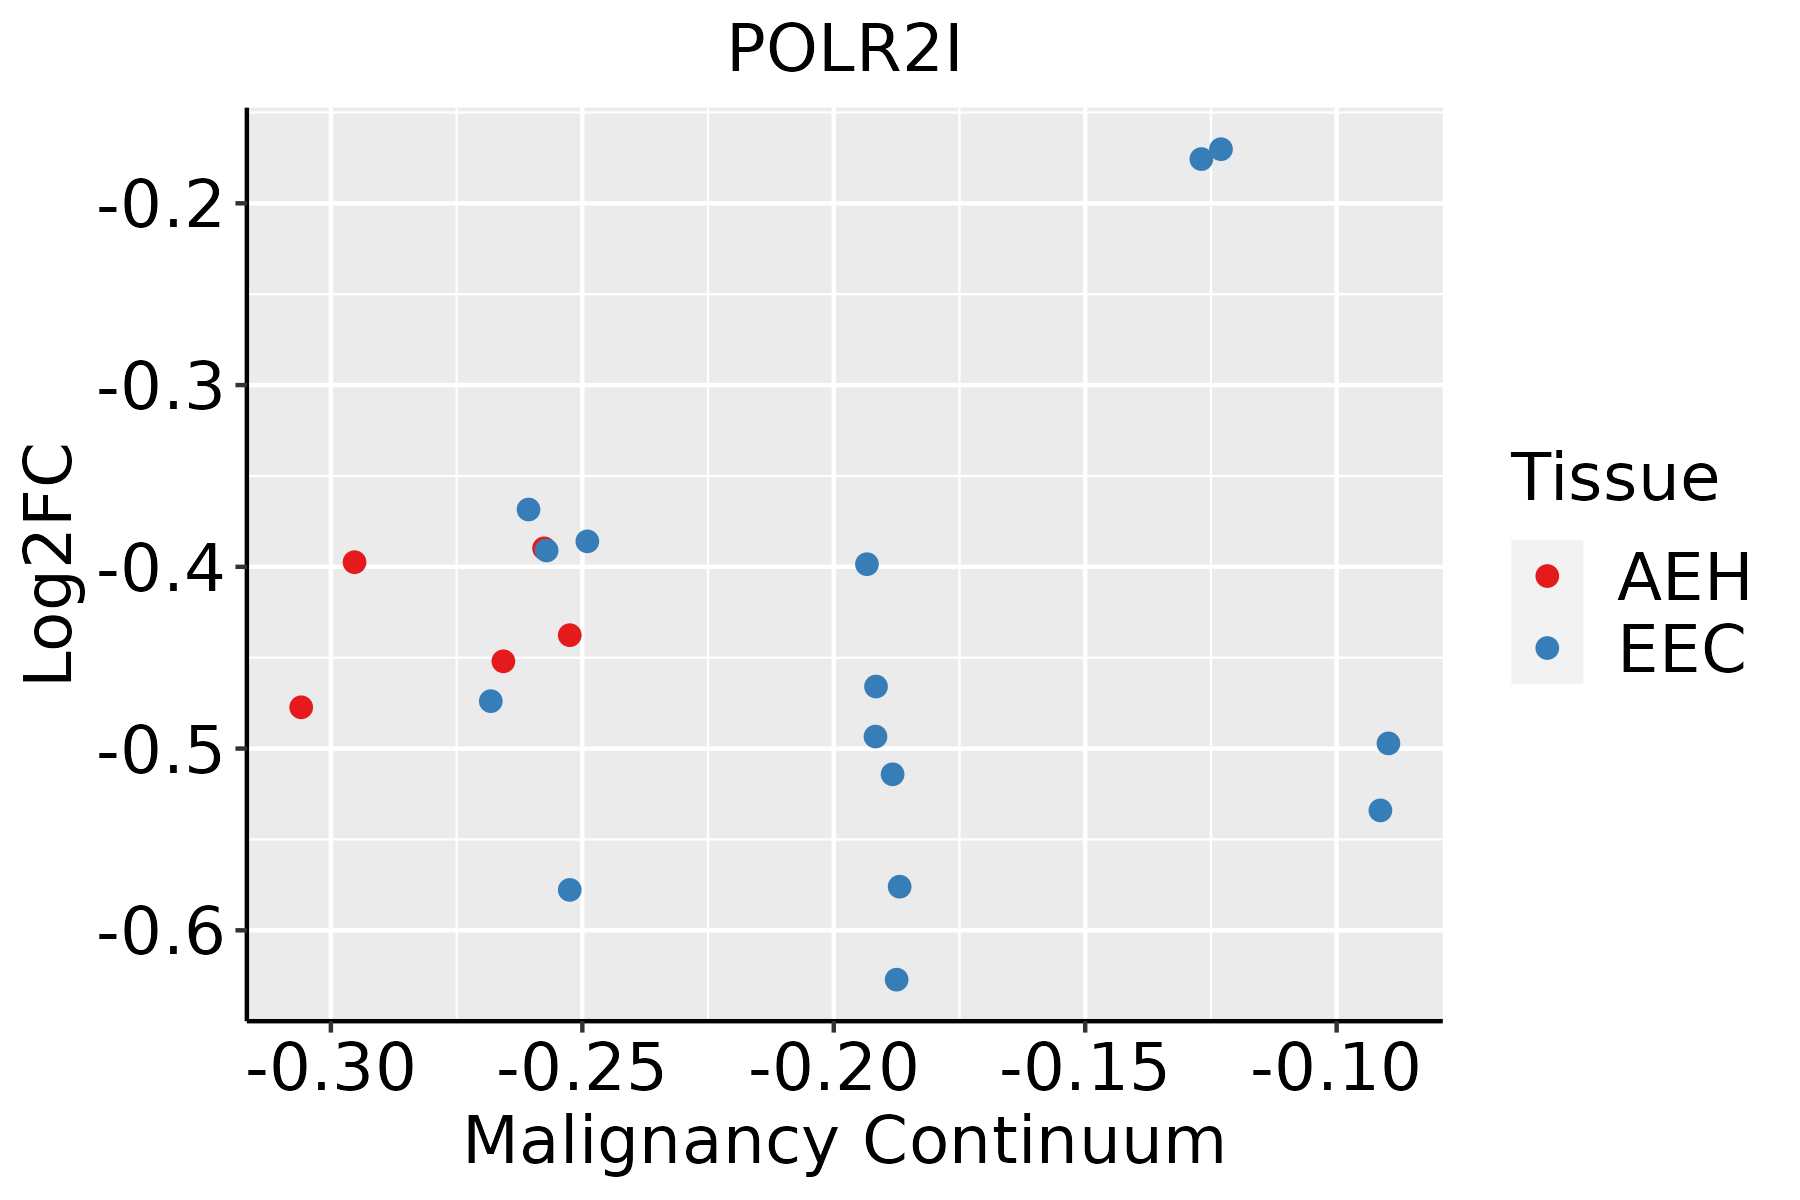 | AEH: Atypical endometrial hyperplasia |
| EEC: Endometrioid Cancer | ||
| Esophagus |  | ESCC: Esophageal squamous cell carcinoma |
| HGIN: High-grade intraepithelial neoplasias | ||
| LGIN: Low-grade intraepithelial neoplasias | ||
| GC | 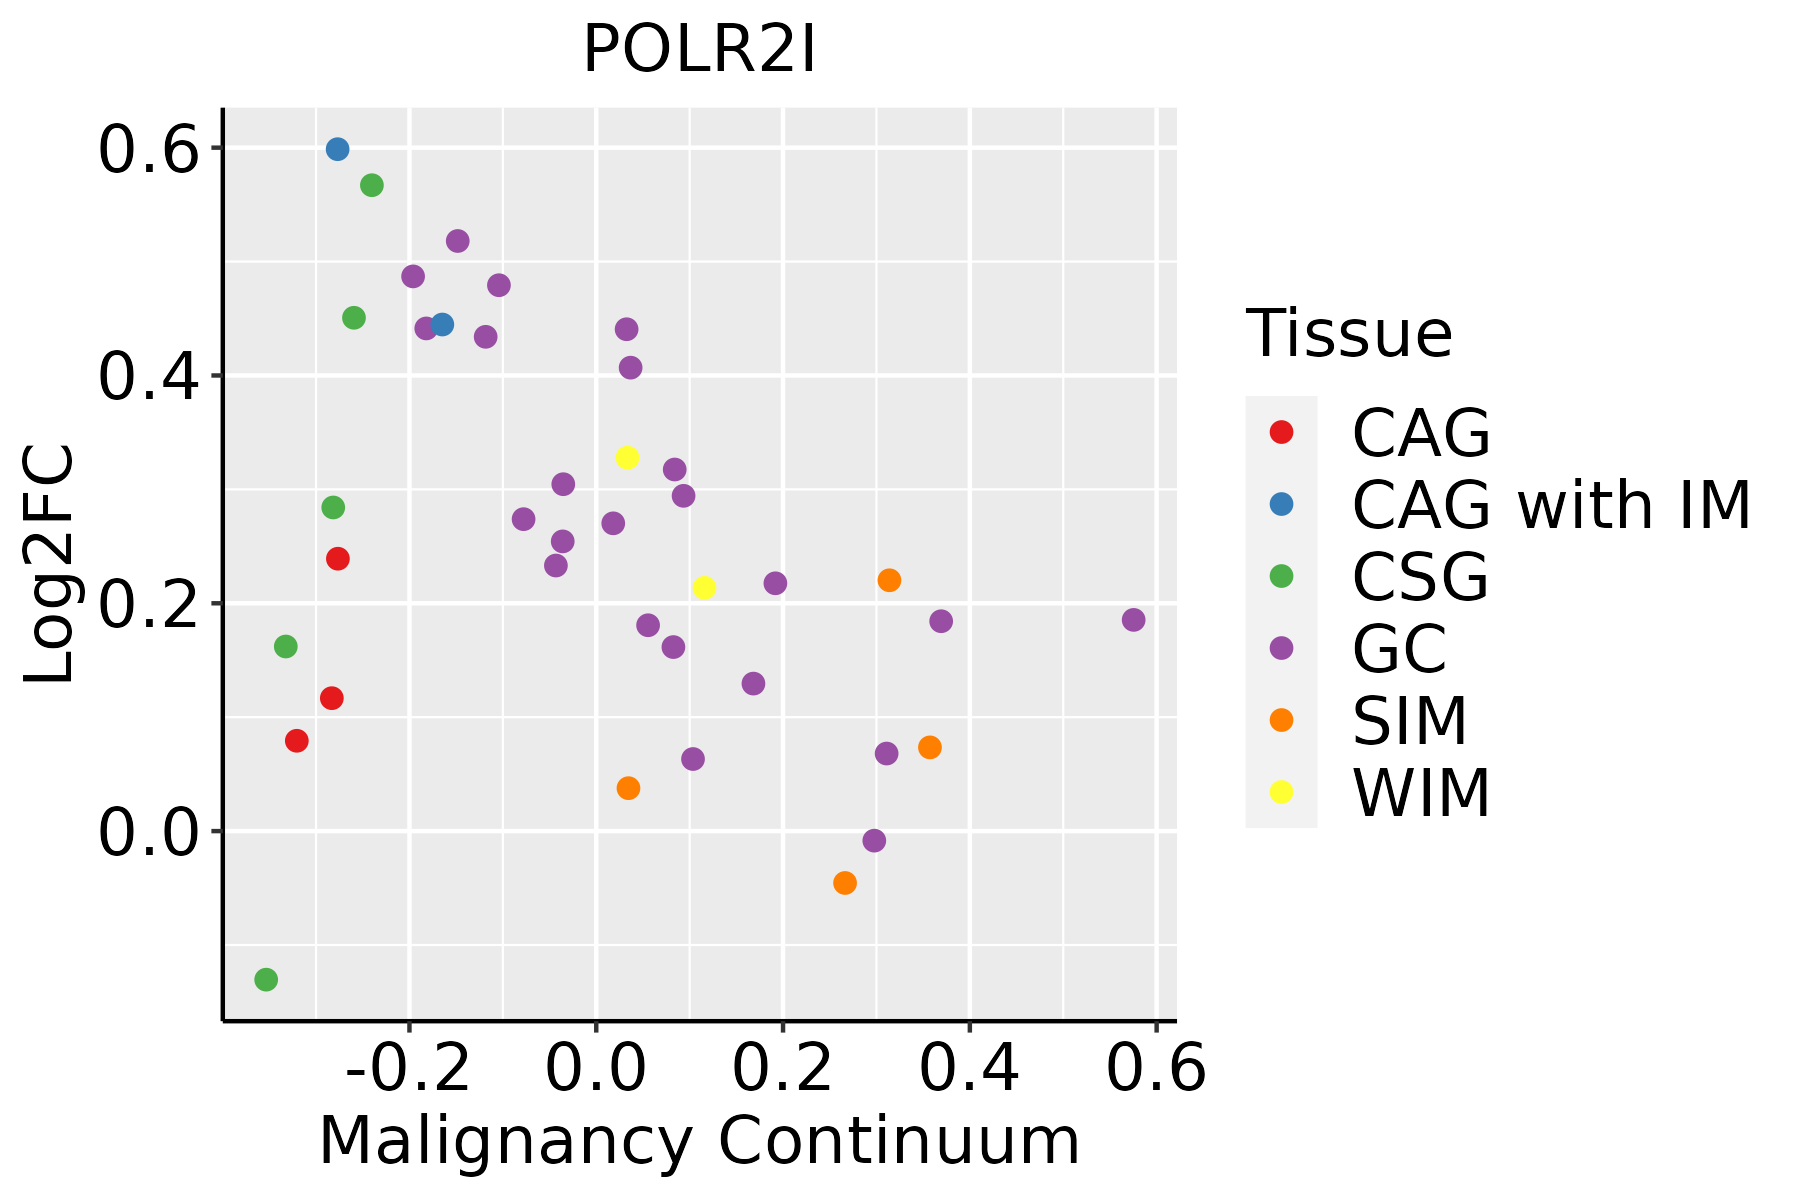 | CAG: Chronic atrophic gastritis |
| CAG with IM: Chronic atrophic gastritis with intestinal metaplasia | ||
| CSG: Chronic superficial gastritis | ||
| GC: Gastric cancer | ||
| SIM: Severe intestinal metaplasia | ||
| WIM: Wild intestinal metaplasia | ||
| Liver | 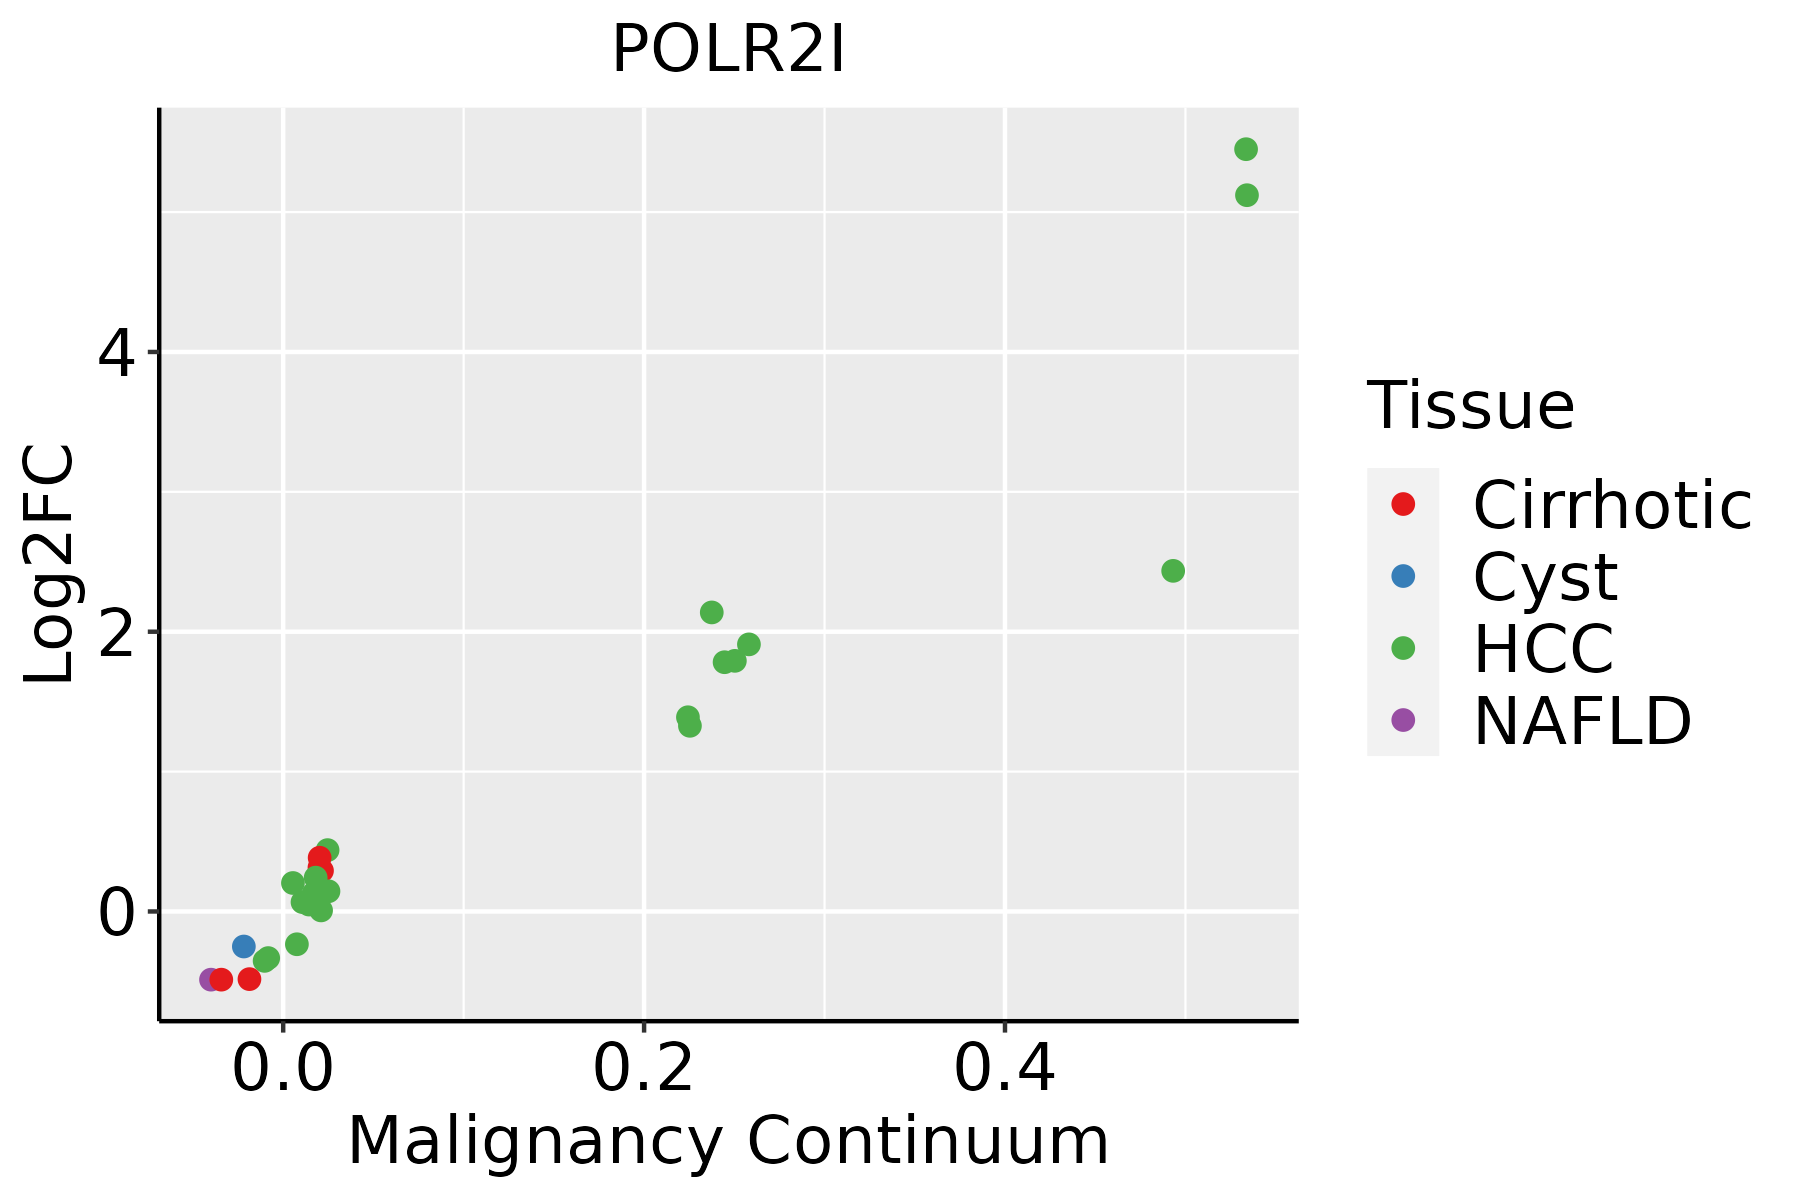 | HCC: Hepatocellular carcinoma |
| NAFLD: Non-alcoholic fatty liver disease | ||
| Oral Cavity | 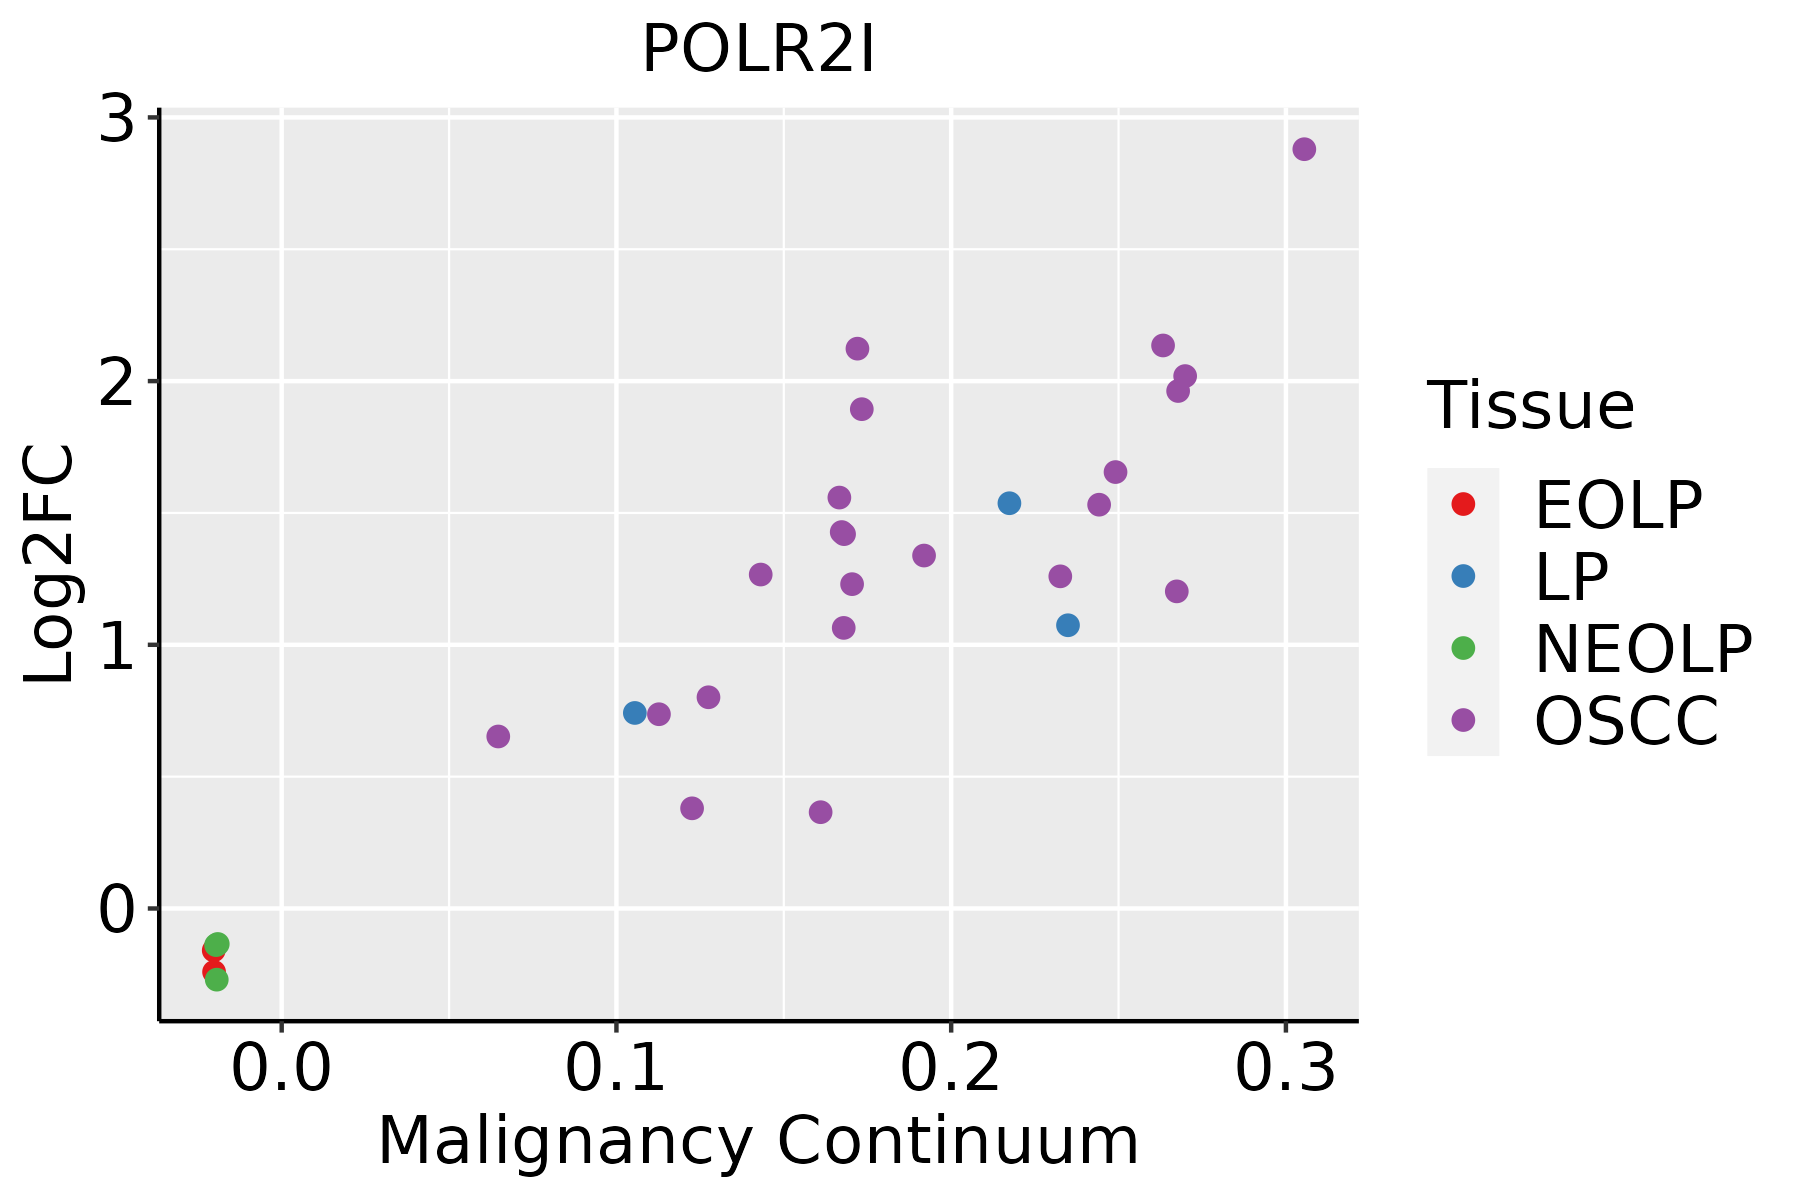 | EOLP: Erosive Oral lichen planus |
| LP: leukoplakia | ||
| NEOLP: Non-erosive oral lichen planus | ||
| OSCC: Oral squamous cell carcinoma | ||
| Prostate | 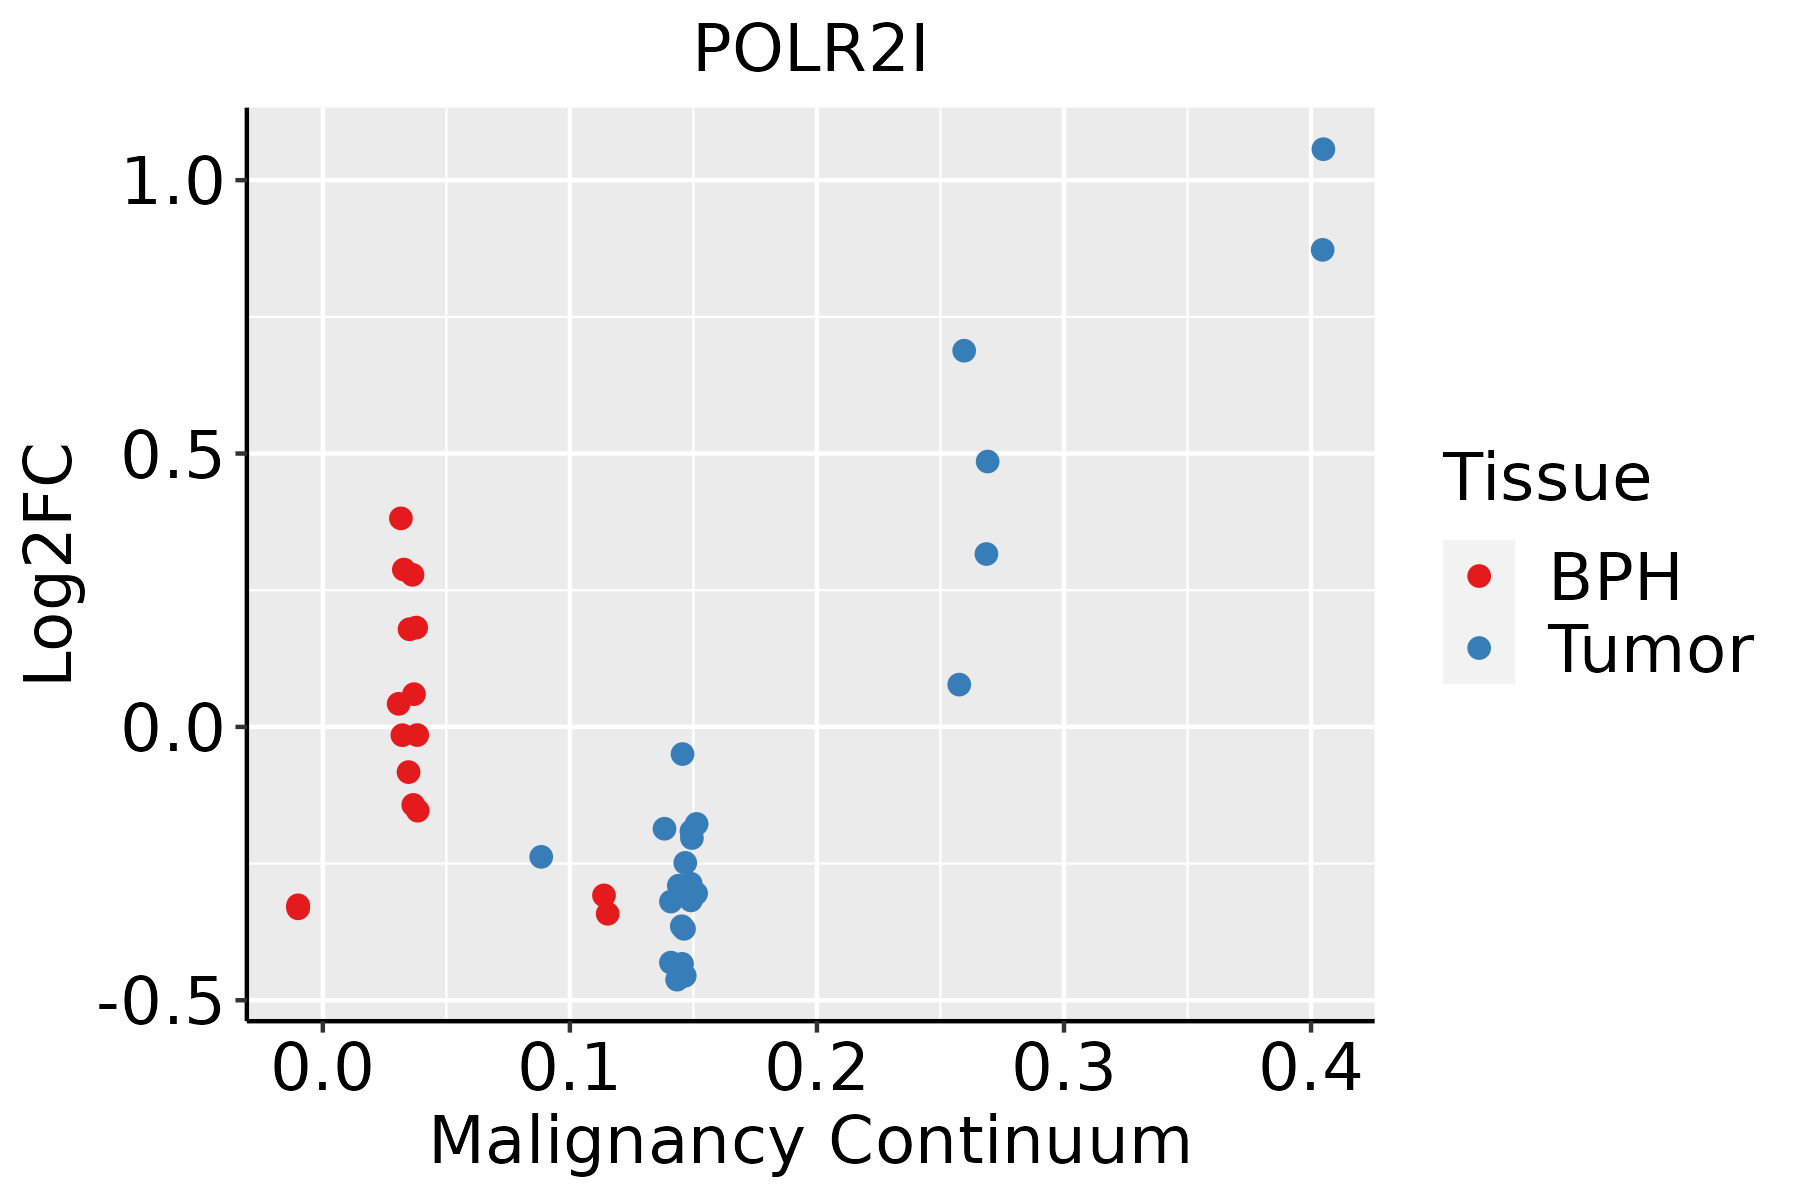 | BPH: Benign Prostatic Hyperplasia |
| Skin | 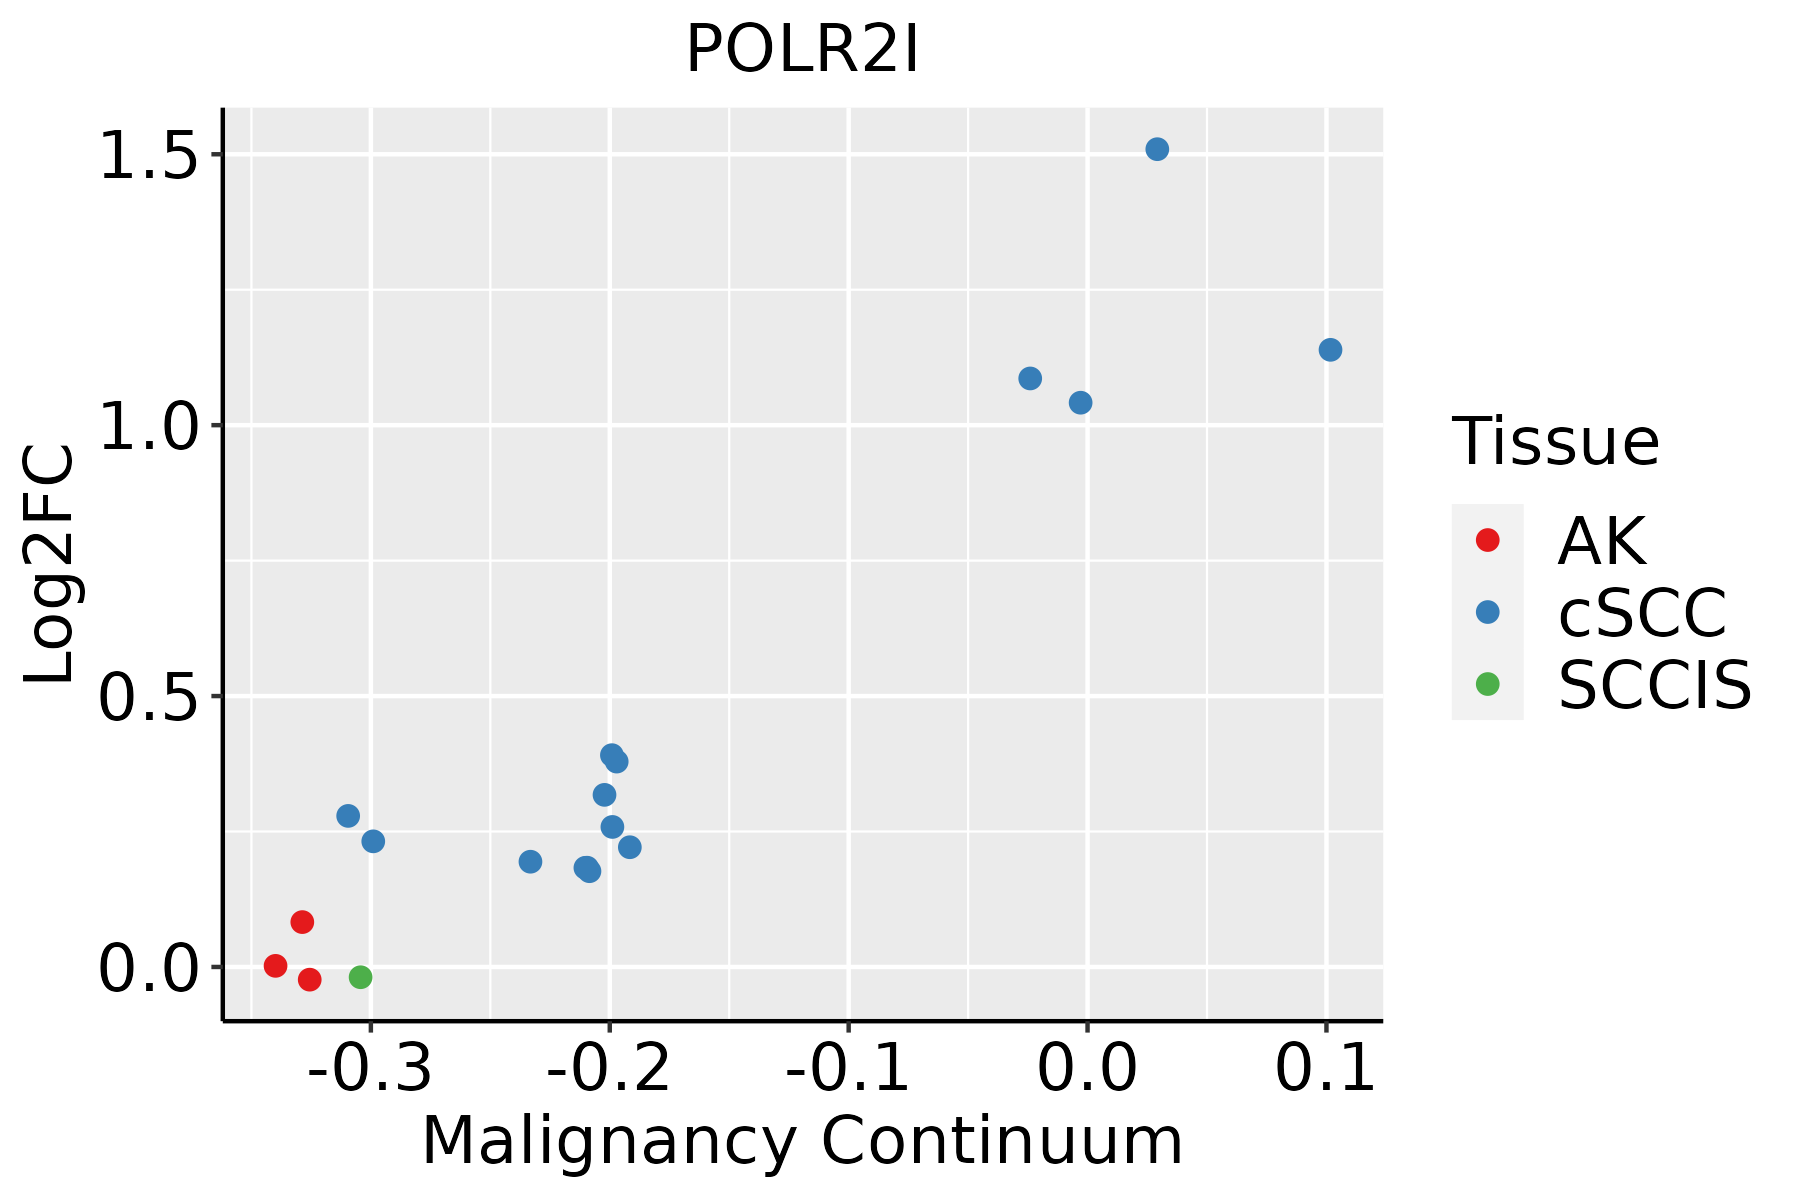 | AK: Actinic keratosis |
| cSCC: Cutaneous squamous cell carcinoma | ||
| SCCIS:squamous cell carcinoma in situ | ||
| Thyroid | 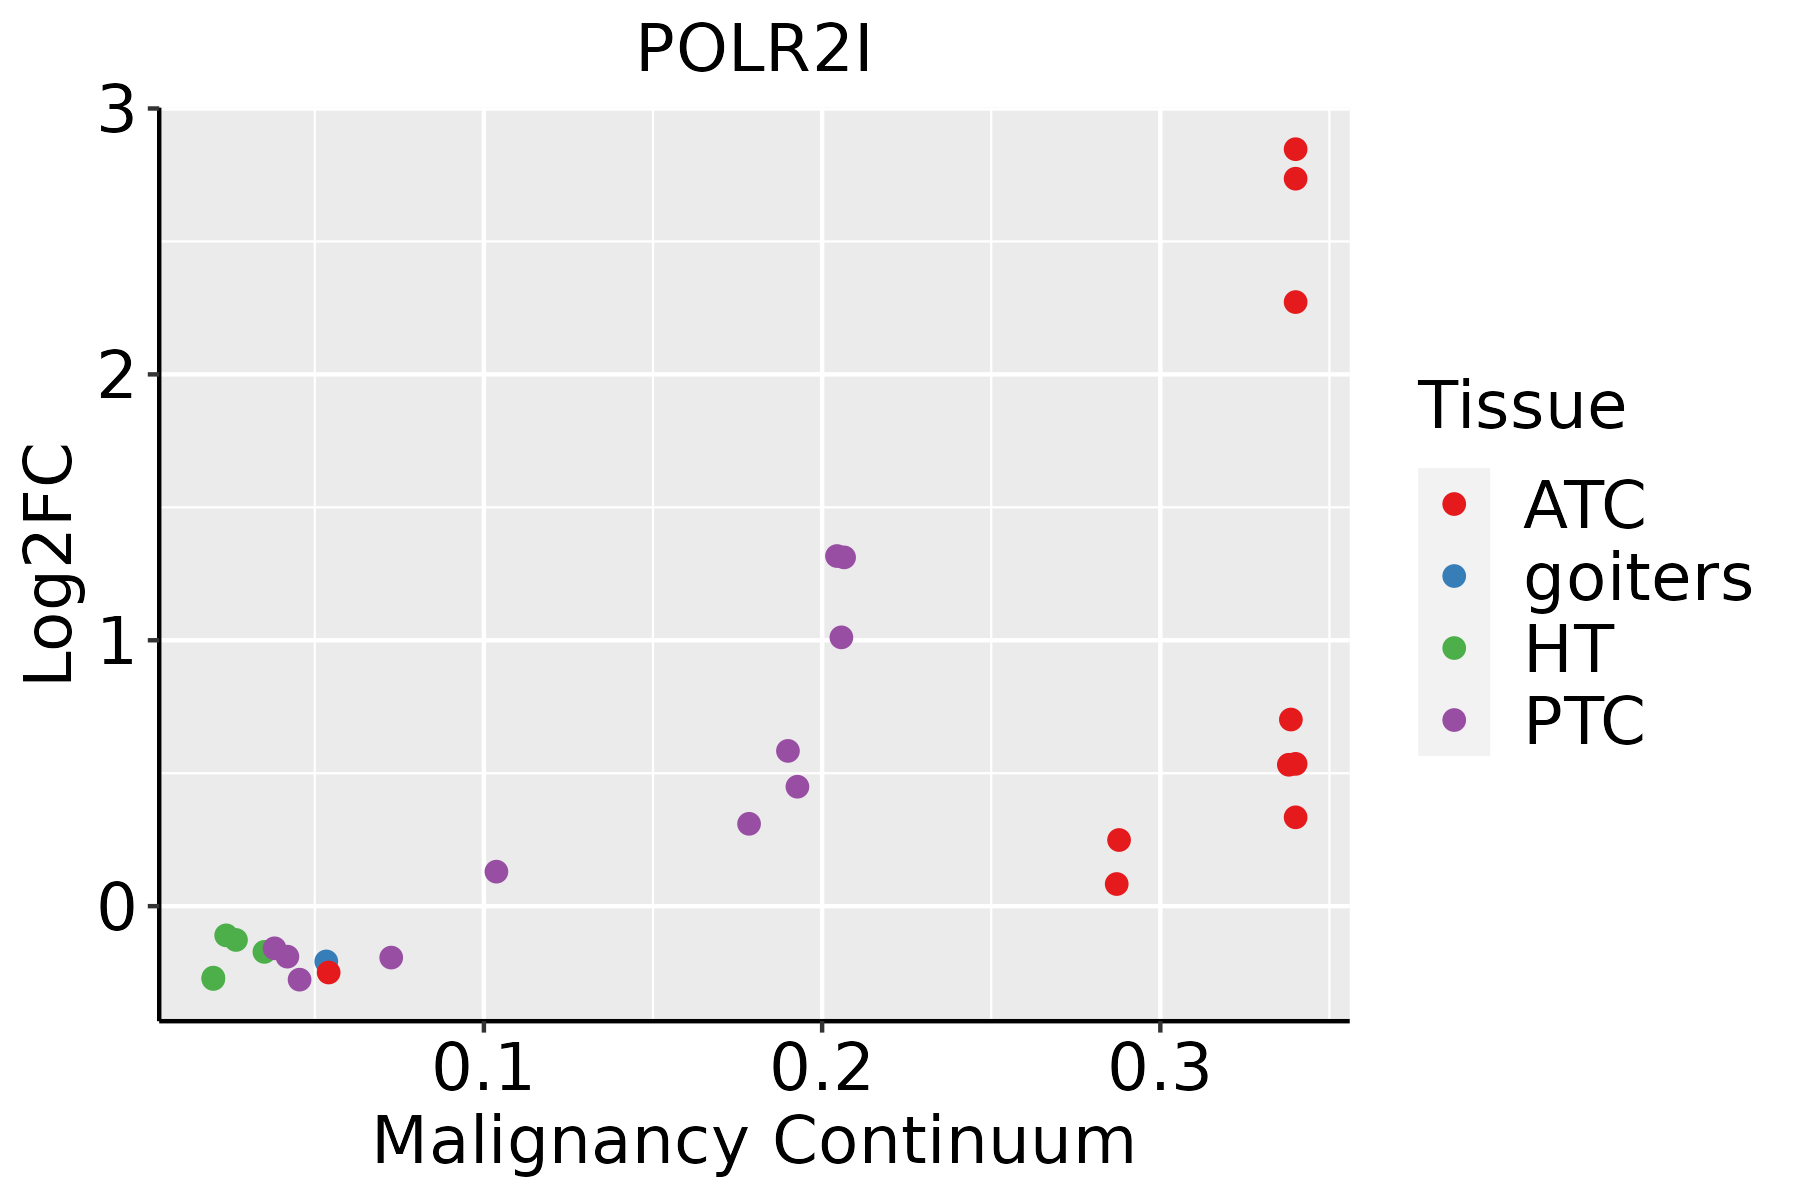 | ATC: Anaplastic thyroid cancer |
| HT: Hashimoto's thyroiditis | ||
| PTC: Papillary thyroid cancer |
| ∗log2FC in expression of this searched gene in stem-like cells from each diseased tissue sample relative to stem-like cells in normal samples in each tissue plotted against the malignancy continuum. Samples are colored based on if they are from different disease stage. |
Top |
Malignant transformation related pathway analysis |
| Find out the enriched GO biological processes and KEGG pathways involved in transition from healthy to precancer to cancer |
| Tissue | Disease Stage | Enriched GO biological Processes |
| Colorectum | AD |  |
| Colorectum | SER |  |
| Colorectum | MSS |  |
| Colorectum | MSI-H |  |
| Colorectum | FAP |  |
| ∗Top 15 enriched GO BP terms are showed in the bar plot of each disease state in each tissue. Each row represents a significant GO biological process which is colored according to the -log10(p.adjust). |
| Page: 1 2 3 4 5 6 7 8 9 |
| GO ID | Tissue | Disease Stage | Description | Gene Ratio | Bg Ratio | pvalue | p.adjust | Count |
| GO:00063684 | Cervix | CC | transcription elongation from RNA polymerase II promoter | 17/2311 | 69/18723 | 3.65e-03 | 2.33e-02 | 17 |
| GO:00063545 | Cervix | CC | DNA-templated transcription, elongation | 20/2311 | 91/18723 | 6.88e-03 | 3.74e-02 | 20 |
| GO:0006354 | Colorectum | AD | DNA-templated transcription, elongation | 31/3918 | 91/18723 | 2.46e-03 | 1.90e-02 | 31 |
| GO:0006368 | Colorectum | AD | transcription elongation from RNA polymerase II promoter | 24/3918 | 69/18723 | 5.35e-03 | 3.52e-02 | 24 |
| GO:00063541 | Colorectum | MSS | DNA-templated transcription, elongation | 29/3467 | 91/18723 | 1.52e-03 | 1.39e-02 | 29 |
| GO:00063681 | Colorectum | MSS | transcription elongation from RNA polymerase II promoter | 22/3467 | 69/18723 | 5.31e-03 | 3.62e-02 | 22 |
| GO:00063687 | Esophagus | HGIN | transcription elongation from RNA polymerase II promoter | 24/2587 | 69/18723 | 8.93e-06 | 2.64e-04 | 24 |
| GO:00063548 | Esophagus | HGIN | DNA-templated transcription, elongation | 27/2587 | 91/18723 | 6.62e-05 | 1.52e-03 | 27 |
| GO:00063523 | Esophagus | HGIN | DNA-templated transcription, initiation | 30/2587 | 130/18723 | 2.86e-03 | 2.79e-02 | 30 |
| GO:00062892 | Esophagus | HGIN | nucleotide-excision repair | 16/2587 | 60/18723 | 6.22e-03 | 4.95e-02 | 16 |
| GO:000635414 | Esophagus | ESCC | DNA-templated transcription, elongation | 76/8552 | 91/18723 | 8.35e-14 | 4.11e-12 | 76 |
| GO:00905013 | Esophagus | ESCC | RNA phosphodiester bond hydrolysis | 110/8552 | 152/18723 | 1.95e-11 | 6.81e-10 | 110 |
| GO:000636814 | Esophagus | ESCC | transcription elongation from RNA polymerase II promoter | 56/8552 | 69/18723 | 1.40e-09 | 3.30e-08 | 56 |
| GO:00903053 | Esophagus | ESCC | nucleic acid phosphodiester bond hydrolysis | 163/8552 | 261/18723 | 3.07e-08 | 5.73e-07 | 163 |
| GO:00063673 | Esophagus | ESCC | transcription initiation from RNA polymerase II promoter | 56/8552 | 77/18723 | 1.30e-06 | 1.59e-05 | 56 |
| GO:000635211 | Esophagus | ESCC | DNA-templated transcription, initiation | 86/8552 | 130/18723 | 1.88e-06 | 2.19e-05 | 86 |
| GO:00062891 | Esophagus | ESCC | nucleotide-excision repair | 42/8552 | 60/18723 | 1.18e-04 | 8.14e-04 | 42 |
| GO:00063793 | Esophagus | ESCC | mRNA cleavage | 17/8552 | 22/18723 | 2.60e-03 | 1.11e-02 | 17 |
| GO:0090501 | Liver | Cirrhotic | RNA phosphodiester bond hydrolysis | 54/4634 | 152/18723 | 1.89e-03 | 1.19e-02 | 54 |
| GO:0006367 | Liver | Cirrhotic | transcription initiation from RNA polymerase II promoter | 31/4634 | 77/18723 | 1.91e-03 | 1.20e-02 | 31 |
| Page: 1 2 3 4 |
| Pathway ID | Tissue | Disease Stage | Description | Gene Ratio | Bg Ratio | pvalue | p.adjust | qvalue | Count |
| hsa0501618 | Cervix | CC | Huntington disease | 94/1267 | 306/8465 | 8.49e-13 | 3.06e-11 | 1.81e-11 | 94 |
| hsa0501619 | Cervix | CC | Huntington disease | 94/1267 | 306/8465 | 8.49e-13 | 3.06e-11 | 1.81e-11 | 94 |
| hsa0501644 | Cervix | N_HPV | Huntington disease | 36/349 | 306/8465 | 9.73e-09 | 2.65e-07 | 2.07e-07 | 36 |
| hsa0501654 | Cervix | N_HPV | Huntington disease | 36/349 | 306/8465 | 9.73e-09 | 2.65e-07 | 2.07e-07 | 36 |
| hsa05016 | Colorectum | AD | Huntington disease | 147/2092 | 306/8465 | 1.93e-19 | 9.26e-18 | 5.91e-18 | 147 |
| hsa050161 | Colorectum | AD | Huntington disease | 147/2092 | 306/8465 | 1.93e-19 | 9.26e-18 | 5.91e-18 | 147 |
| hsa050162 | Colorectum | SER | Huntington disease | 127/1580 | 306/8465 | 3.29e-21 | 1.37e-19 | 9.92e-20 | 127 |
| hsa050163 | Colorectum | SER | Huntington disease | 127/1580 | 306/8465 | 3.29e-21 | 1.37e-19 | 9.92e-20 | 127 |
| hsa050164 | Colorectum | MSS | Huntington disease | 141/1875 | 306/8465 | 2.90e-21 | 1.62e-19 | 9.92e-20 | 141 |
| hsa050165 | Colorectum | MSS | Huntington disease | 141/1875 | 306/8465 | 2.90e-21 | 1.62e-19 | 9.92e-20 | 141 |
| hsa050166 | Colorectum | MSI-H | Huntington disease | 83/797 | 306/8465 | 7.06e-20 | 3.81e-18 | 3.20e-18 | 83 |
| hsa050167 | Colorectum | MSI-H | Huntington disease | 83/797 | 306/8465 | 7.06e-20 | 3.81e-18 | 3.20e-18 | 83 |
| hsa0501620 | Endometrium | AEH | Huntington disease | 118/1197 | 306/8465 | 3.00e-27 | 2.44e-25 | 1.78e-25 | 118 |
| hsa05016110 | Endometrium | AEH | Huntington disease | 118/1197 | 306/8465 | 3.00e-27 | 2.44e-25 | 1.78e-25 | 118 |
| hsa0501625 | Endometrium | EEC | Huntington disease | 120/1237 | 306/8465 | 3.86e-27 | 4.23e-25 | 3.15e-25 | 120 |
| hsa0501635 | Endometrium | EEC | Huntington disease | 120/1237 | 306/8465 | 3.86e-27 | 4.23e-25 | 3.15e-25 | 120 |
| hsa0501630 | Esophagus | HGIN | Huntington disease | 129/1383 | 306/8465 | 6.81e-28 | 7.41e-26 | 5.88e-26 | 129 |
| hsa034205 | Esophagus | HGIN | Nucleotide excision repair | 29/1383 | 63/8465 | 2.96e-08 | 5.36e-07 | 4.26e-07 | 29 |
| hsa030205 | Esophagus | HGIN | RNA polymerase | 12/1383 | 34/8465 | 5.62e-03 | 3.99e-02 | 3.17e-02 | 12 |
| hsa05016113 | Esophagus | HGIN | Huntington disease | 129/1383 | 306/8465 | 6.81e-28 | 7.41e-26 | 5.88e-26 | 129 |
| Page: 1 2 3 4 |
Top |
Cell-cell communication analysis |
| Identification of potential cell-cell interactions between two cell types and their ligand-receptor pairs for different disease states |
| Ligand | Receptor | LRpair | Pathway | Tissue | Disease Stage |
| Page: 1 |
Top |
Single-cell gene regulatory network inference analysis |
| Find out the significant the regulons (TFs) and the target genes of each regulon across cell types for different disease states |
| TF | Cell Type | Tissue | Disease Stage | Target Gene | RSS | Regulon Activity |
| ∗The dot plots of a searched regulon are shown for all cell subpopulations in each disease state of each tissue based on the regulon specific score inferred using pySCENIC and by calculating the average expression. |
| Page: 1 |
Top |
Somatic mutation of malignant transformation related genes |
| Annotation of somatic variants for genes involved in malignant transformation |
| Hugo Symbol | Variant Class | Variant Classification | dbSNP RS | HGVSc | HGVSp | HGVSp Short | SWISSPROT | BIOTYPE | SIFT | PolyPhen | Tumor Sample Barcode | Tissue | Histology | Sex | Age | Stage | Therapy Types | Drugs | Outcome |
| POLR2I | insertion | Frame_Shift_Ins | novel | c.258_259insTTGA | p.Gln87LeufsTer49 | p.Q87Lfs*49 | P36954 | protein_coding | TCGA-A8-A0A6-01 | Breast | breast invasive carcinoma | Female | <65 | III/IV | Chemotherapy | epirubicin | CR | ||
| POLR2I | insertion | Frame_Shift_Ins | novel | c.257_258insTTGGCCAGGCTGGT | p.Gln87TrpfsTer? | p.Q87Wfs*? | P36954 | protein_coding | TCGA-A8-A0A6-01 | Breast | breast invasive carcinoma | Female | <65 | III/IV | Chemotherapy | epirubicin | CR | ||
| POLR2I | SNV | Missense_Mutation | c.305C>T | p.Ala102Val | p.A102V | P36954 | protein_coding | tolerated(0.2) | benign(0.021) | TCGA-AA-3672-01 | Colorectum | colon adenocarcinoma | Female | >=65 | III/IV | Unknown | Unknown | SD | |
| POLR2I | SNV | Missense_Mutation | c.347N>T | p.Ala116Val | p.A116V | P36954 | protein_coding | tolerated(0.07) | benign(0.012) | TCGA-CK-4951-01 | Colorectum | colon adenocarcinoma | Female | >=65 | I/II | Unknown | Unknown | PD | |
| POLR2I | SNV | Missense_Mutation | novel | c.346N>A | p.Ala116Thr | p.A116T | P36954 | protein_coding | tolerated(0.11) | benign(0.138) | TCGA-A5-A1OF-01 | Endometrium | uterine corpus endometrioid carcinoma | Female | <65 | I/II | Unknown | Unknown | SD |
| POLR2I | SNV | Missense_Mutation | novel | c.86N>G | p.Asp29Gly | p.D29G | P36954 | protein_coding | deleterious(0) | probably_damaging(0.981) | TCGA-AJ-A5DW-01 | Endometrium | uterine corpus endometrioid carcinoma | Female | <65 | I/II | Unknown | Unknown | SD |
| POLR2I | SNV | Missense_Mutation | novel | c.325C>T | p.Arg109Cys | p.R109C | P36954 | protein_coding | tolerated(0.05) | benign(0.062) | TCGA-AX-A1CE-01 | Endometrium | uterine corpus endometrioid carcinoma | Female | <65 | I/II | Unspecific | Paclitaxel | SD |
| POLR2I | SNV | Missense_Mutation | novel | c.223N>T | p.Asp75Tyr | p.D75Y | P36954 | protein_coding | deleterious(0) | probably_damaging(0.97) | TCGA-AX-A2HD-01 | Endometrium | uterine corpus endometrioid carcinoma | Female | >=65 | III/IV | Unknown | Unknown | SD |
| POLR2I | SNV | Missense_Mutation | novel | c.249N>A | p.Asp83Glu | p.D83E | P36954 | protein_coding | tolerated(0.41) | benign(0.022) | TCGA-AX-A2HJ-01 | Endometrium | uterine corpus endometrioid carcinoma | Female | <65 | I/II | Unknown | Unknown | SD |
| POLR2I | SNV | Missense_Mutation | c.236C>A | p.Pro79Gln | p.P79Q | P36954 | protein_coding | deleterious(0) | possibly_damaging(0.884) | TCGA-EP-A2KA-01 | Liver | liver hepatocellular carcinoma | Female | <65 | III/IV | Targeted Molecular therapy | sorafenib | PD |
| Page: 1 2 |
Top |
Related drugs of malignant transformation related genes |
| Identification of chemicals and drugs interact with genes involved in malignant transfromation |
| (DGIdb 4.0) |
| Entrez ID | Symbol | Category | Interaction Types | Drug Claim Name | Drug Name | PMIDs |
| Page: 1 |

Copyright 2023-Present -The University of Texas Health Science Center at Houston |